. 2024 Mar 10;24(1):103.
doi: 10.1186/s12935-024-03274-9.

Influential upregulation of KCNE4: Propelling cancer associated fibroblasts-driven colorectal cancer progression

Affiliations

Influential upregulation of KCNE4: Propelling cancer associated fibroblasts-driven colorectal cancer progression

Zizhen Zhang et al. Cancer Cell Int. .

Abstract

Background: Colorectal cancer (CRC) is a malignancy of remarkable heterogeneity and heightened morbidity. Cancer associated fibroblasts (CAFs) are abundant in CRC tissues and are essential for CRC growth. Here, we aimed to develop a CAF-related classifier for predicting the prognosis of CRC and identify critical pro-tumorigenic genes in CAFs.

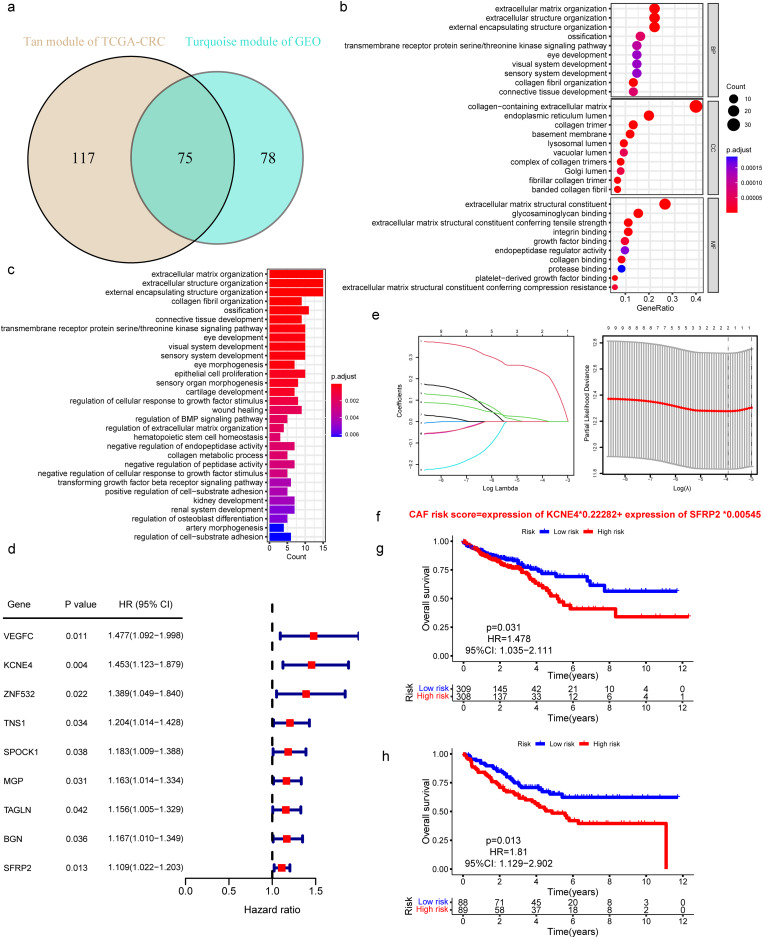
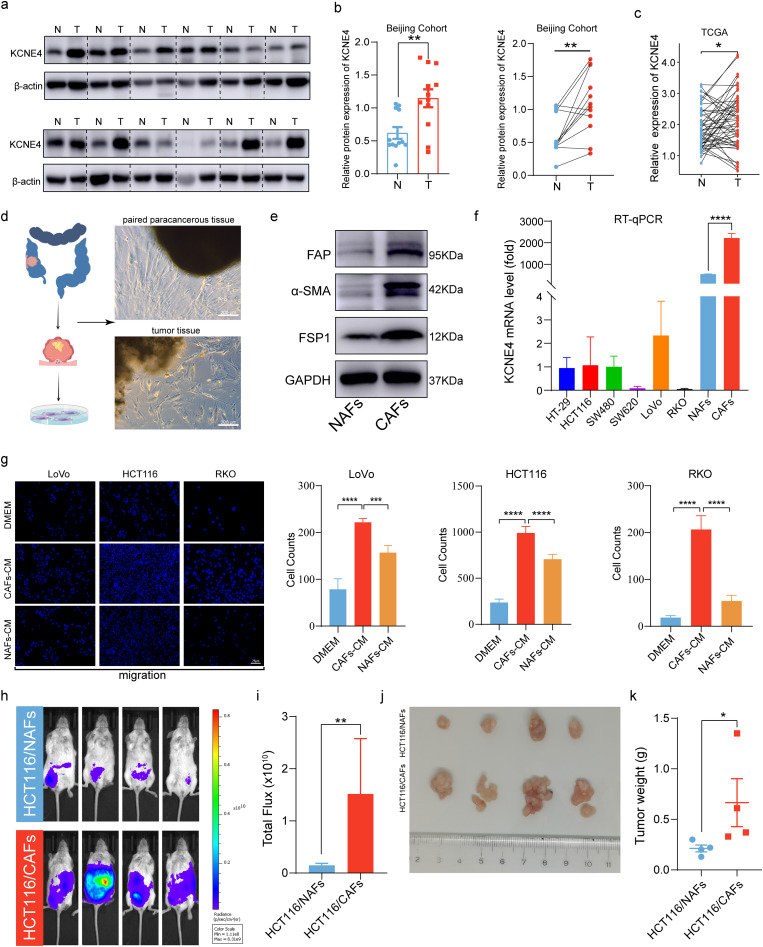
Method: The mRNA expression and clinical information of CRC samples were sourced from two comprehensive databases, The Cancer Genome Atlas (TCGA) and Gene Expression Omnibus (GEO). Using a weighted gene co-expression network analysis (WGCNA) approach, CAF-related genes were identified and a CAF risk signature was developed through the application of univariate analysis and the least absolute shrinkage and selection operator (LASSO) Cox regression model. EdU cell proliferation assay, and transwell assay were performed to detect the oncogenic role of KCNE4 in CAFs.

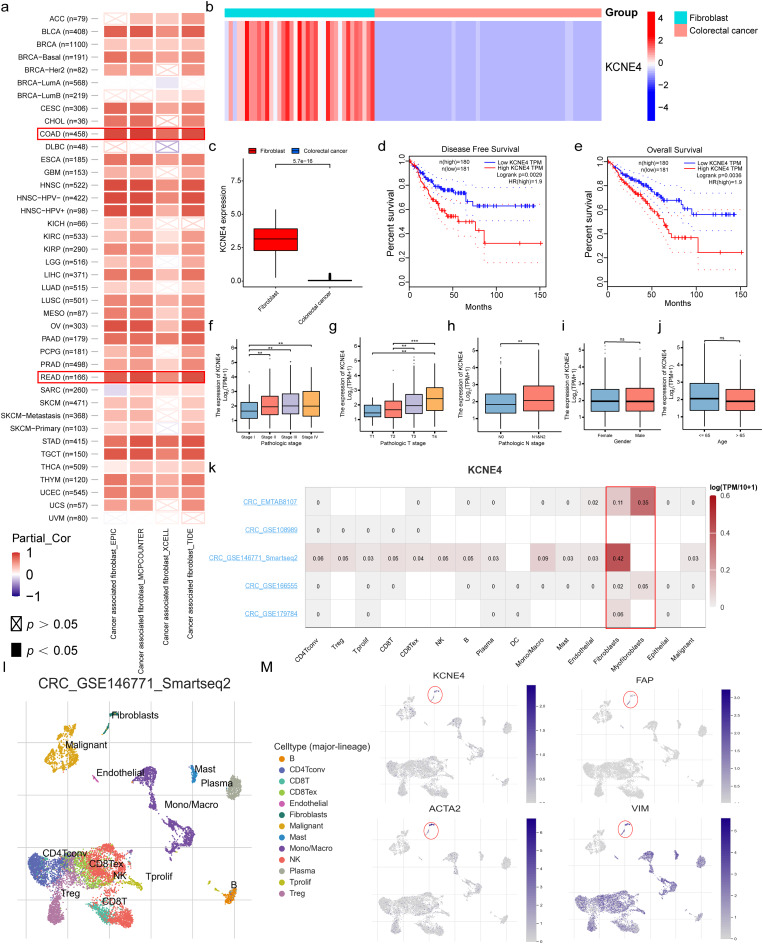
Results: We constructed a prognostic CAF model consisting of two genes (SFRP2 and KCNE4). CRC patients were classified into low- and high-CAF-risk groups using the median CAF risk score, and patients in the high-CAF-risk group had worse prognosis. Meanwhile, a higher risk score for CAFs was associated with greater stromal and CAF infiltrations, as well as higher expression of CAF markers. Furthermore, TIDE analysis indicated that patients with a high CAF risk score are less responsive to immunotherapy. Our further experiments had confirmed the strong correlation between KCNE4 and the malignant phenotypes of CAFs. Moreover, we had shown that KCNE4 could actively promote tumor-promoting phenotypes in CAFs, indicating its critical role in cancer progression.

Conclusion: The two-gene prognostic CAF signature was constructed and could be reliable for predicting prognosis for CRC patients. Moreover, KCNE4 may be a promising strategy for the development of novel anti-cancer therapeutics specifically directed against CAFs.

Keywords: Adhesion; Cancer-associated fibroblasts (CAFs); Colorectal cancer (CRC); KCNE4; Migration.


Conflict of interest statement

The authors declare no competing interests.

Figures

Fig. 1
Fig. 1
Co-expression network constructed by WGCNA. a, b. A soft-thresholding power (β) of 4 was chosen for subsequent analysis based on the scale-free topology criterion in TCGA-CRC (a) and GSE17536 (b). c, d. Genes with similar expression patterns were clustered into co-expression modules in TCGA-CRC (c) and GSE17536 (d) based on dendrograms created from hierarchical clustering. e, f. Correlation between gene modules’ eigengenes and phenotypes in TCGA-CRC (e) and GSE17536 (f) datasets. g, h. Scatter plots of the module membership (MM) and gene significance (GS) of each gene in the tan module of TCGA-CRC (g) and the turquoise module of GSE17536 (h)
Fig. 2
Fig. 2
Identification of Key Genes and Establishment of Prognostic Models. (a) The intersection of TCGA-CRC tan and GSE17536 turquoise module genes was presented in the Venn diagram. (b, c). GO, KEGG analysis of the 75 genes. (d) Genes associated with overall survival in TCGA-CRC were screened using the univariate Cox analysis. (e) The two-gene prognostic signature was identified by Lasso–Cox regression analysis. (f) The construction of the CAF risk model. g, H. Kaplan-Meier analyses revealed that CRC patients in the high-CAF-risk group had poorer overall survival rates in both TCGA-CRC (g) and GSE17536 (h) cohorts
Fig. 3
Fig. 3
Correlations Between CAF risk score and Infiltration, somatic variation, and drug response. (a) Spearman’s correlation analysis of CAF risk score with stromal scores and multi-estimated CAF infiltration. (b) Spearman’s correlation analysis of CAF markers with CAF risk score and two signature genes. (c) The top 20 mutational genes in low- and high-CAF-risk groups of TCGA-CRC. (d) Comparison of chemotherapy drug IC50 values between low- and high-CAF-risk Groups. (e, f). TIDE immunotherapy prediction analyses. (g) ROC curves of the CAF risk score in predicting immunotherapy responses in TCGA-CRC
Fig. 4
Fig. 4
Cross-dataset validation of important gene-KCNE4. (a) The results of TIMER2.0 analysis reveal significant correlations between KCNE4 expression and the infiltration of CAFs in various tumor tissues, which are represented by red and blue squares on the scatterplot, where red denotes significant positive correlations, while blue denotes significant negative correlations. b, c. The expression levels of KCNE4 in CCLE database were analyzed using a heat map (b) and box plot (c). (d, e). The association between KCNE4 expression and OS as well as DFS in TCGA-CRC cohort. (f-h). The analysis also showed a positive correlation between KCNE4 expression levels and tumor stage. (i) The expression differences of KCNE4 in age status. (j) KCNE4 expression differences in gender. (k) The KCNE4 expression levels in different cell types using five single-cell sequencing datasets from the GEO database in CRC. (l, m). The relationship between KCNE4 expression levels and the expression of CAFs marker genes FAP, ACTA2, and VIM utilizing the single-cell dataset from CRC_GSE146771. Data in bar graphs indicate mean ± SEM. ns: no significant, **P < 0.01 and ***P < 0.001
Fig. 5
Fig. 5
KCNE4 tissue expression validation and CAFs extraction in CRC. (a, b). KCNE4 protein expression was shown in 12 paired tumor and para-tumor tissue by Western blot. (“N” for non-tumor, “T” for tumor). (c) KCNE4 expression in paired CRC samples from TCGA. (d) Images display the isolation of NAFs and CAFs from CRC adjacent normal tissue and tumor tissue. (e) Western blot was used to measure the expression levels of FAP, α-SMA and FSP1 in NAFs and CAFs. (f) qRT-PCR analysis of KCNE4 in different cell types. (g) Migration of CRC cells incubated with CM derived from NAFs or CAFs. (h-i). In vivo bioluminescence imaging of mice administered with HCT116 (Luci) cells via intravenous intraperitoneal injection in the presence of either NAFs or CAFs (n = 4). (j) Dissected intraperitoneal tumor nodules after humanitarian execution (n = 4). (k) The intraperitoneal tumor weights in each group were statistically analyzed. Data in bar graphs indicate mean ± SEM. *P < 0.05, **P < 0.01, ***P < 0.001, ****P < 0.0001. Student’s t test (b, i, k), paired Student’s t test (c), multi-group analysis of variance (g)
Fig. 6
Fig. 6
The oncogenic role of KCNE4 in CAFs. (a) Spearman’s correlation analysis was utilized to determine the correlation between the expression levels of FAP, VIM, FSP1, ACTA2, and KCNE4, with the data from the GEPIA database. (b) Immunoblot Analysis of CAFs Markers in NAFs with Induced KCNE4 overexpression. (c) The effect of KCNE4 on NAFs proliferation was determined by EdU incorporation assay. (d) Impact of KCNE4 on NAFs migration revealed via transwell Migration. (e) The protein levels of CAFs markers in CAFs transfected with KCNE4 siRNAs. (f) EdU assay for detecting proliferation CAFs Proliferation following KCNE4 siRNA transfection. (g) Migration of CAFs transfected with KCNE4 siRNAs. (h) Cell adhesion assay of LoVo- and HCT116-GFP cells on CAFs transfected with KCNE4 siRNA-NC or siRNA-KCNE4. (i) Migration of LoVo and HCT116 cells incubated with CM derived from CAFs transfected with KCNE4 siRNA-NC or siRNA-KCNE4. (j) The mRNA expression levels of the target genes of multiple chemokine and cytokine. (k) Analysis of the correlation between KCNE4 and IGF1 from the TCGA database. Data in bar graphs indicate mean ± SEM. **P < 0.01, ***P < 0.001, ****P < 0.0001. Student’s t test (c, d), multi-group analysis of variance (f, g, h, i, j)
Fig. 7
Fig. 7
Upregulation of KCNE4 in CAFs drives liver metastasis of CRC cells. (a) A mouse liver metastasis model was constructed by simultaneous injection of CRC cells and NAFs into the spleen. (b) In vivo bioluminescence imaging of mice administered with HCT116 (Luci) cells via intrasplenic injection in the presence of either NAFs-OE Vector or NAFs-OE KCNE4 (n = 5). (c) Comparison of liver metastases in HCT116/NAFs-OE Vector and HCT116/NAFs-OE KCNE4 groups. (d) Representative HE staining reveals liver metastasis in nude mice following 8 weeks of spleen injection with CRC cells and NAFs-OE Vector or NAFs-OE KCNE4 (n = 5). The white arrow indicates the metastatic node (scale bar, 1000 μm). (e) In vivo bioluminescence imaging of mice administered with HCT116 (Luci) cells via intraperitoneal injection in the presence of either NAFs-OE Vector or NAFs-OE KCNE4 (n = 5). (f) Comparison of intraperitoneal metastases in HCT116/NAFs-OE Vector and HCT116/NAFs-OE KCNE4 groups. (g) Immunohistochemistry was employed to assess the distribution of KCNE4 and α-SMA in peritoneal metastatic nodules derived from mice in Fig. 7f. (h) Immunohistochemistry was employed to scrutinize the distribution of KCNE4 and α-SMA in paired primary colorectal cancer tumors and their corresponding liver metastases. Data in bar graphs indicate mean ± SEM. *P < 0.05, **P < 0.01. Student’s t test (b, c, e, f)

References

    1. Sung H, Ferlay J, Siegel RL, Laversanne M, Soerjomataram I, Jemal A, Bray F. Global Cancer statistics 2020: GLOBOCAN estimates of incidence and Mortality Worldwide for 36 cancers in 185 countries. Cancer J Clin. 2021;71(3):209–49. doi: 10.3322/caac.21660. - DOI - PubMed
    1. Siegel RL, Miller KD, Fuchs HE, Jemal A. Cancer Statistics, 2021. CA: a cancer journal for clinicians 2021, 71(1):7–33. - PubMed
    1. Jackstadt R, van Hooff SR, Leach JD, Cortes-Lavaud X, Lohuis JO, Ridgway RA, Wouters VM, Roper J, Kendall TJ, Roxburgh CS, et al. Epithelial NOTCH Signaling rewires the Tumor Microenvironment of Colorectal Cancer to drive poor-prognosis subtypes and metastasis. Cancer Cell. 2019;36(3):319–336e317. doi: 10.1016/j.ccell.2019.08.003. - DOI - PMC - PubMed
    1. Zheng L, Liang H, Zhang Q, Shen Z, Sun Y, Zhao X, Gong J, Hou Z, Jiang K, Wang Q, et al. circPTEN1, a circular RNA generated from PTEN, suppresses cancer progression through inhibition of TGF-β/Smad signaling. Mol Cancer. 2022;21(1):41. doi: 10.1186/s12943-022-01495-y. - DOI - PMC - PubMed
    1. Nishina T, Deguchi Y, Ohshima D, Takeda W, Ohtsuka M, Shichino S, Ueha S, Yamazaki S, Kawauchi M, Nakamura E, et al. Interleukin-11-expressing fibroblasts have a unique gene signature correlated with poor prognosis of colorectal cancer. Nat Commun. 2021;12(1):2281. doi: 10.1038/s41467-021-22450-3. - DOI - PMC - PubMed

LinkOut - more resources