. 2024 Jun 1;17(6):dmm050639.
doi: 10.1242/dmm.050639. Epub 2024 May 9.

Impaired polyamine metabolism causes behavioral and neuroanatomical defects in a mouse model of Snyder-Robinson syndrome

Affiliations

Impaired polyamine metabolism causes behavioral and neuroanatomical defects in a mouse model of Snyder-Robinson syndrome

Oluwaseun Akinyele et al. Dis Model Mech. .

Abstract

Snyder-Robinson syndrome (SRS) is a rare X-linked recessive disorder caused by a mutation in the SMS gene, which encodes spermine synthase, and aberrant polyamine metabolism. SRS is characterized by intellectual disability, thin habitus, seizure, low muscle tone/hypotonia and osteoporosis. Progress towards understanding and treating SRS requires a model that recapitulates human gene variants and disease presentations. Here, we evaluated molecular and neurological presentations in the G56S mouse model, which carries a missense mutation in the Sms gene. The lack of SMS protein in the G56S mice resulted in increased spermidine/spermine ratio, failure to thrive, short stature and reduced bone density. They showed impaired learning capacity, increased anxiety, reduced mobility and heightened fear responses, accompanied by reduced total and regional brain volumes. Furthermore, impaired mitochondrial oxidative phosphorylation was evident in G56S cerebral cortex, G56S fibroblasts and Sms-null hippocampal cells, indicating that SMS may serve as a future therapeutic target. Collectively, our study establishes the suitability of the G56S mice as a preclinical model for SRS and provides a set of molecular and functional outcome measures that can be used to evaluate therapeutic interventions for SRS.

Keywords: Mouse model; Neurological functions; Pathogenesis; Rare disease; Spermine; Spermine synthase.


Conflict of interest statement

Competing interests The authors declare no competing or financial interests.

Figures

Fig. 1.
Fig. 1.
Lack of spermine synthase and perturbation of polyamine metabolism in SRS. (A) Polyamine metabolism pathway in humans with SRS compared with unaffected individuals. The absence of SMS leads to a decrease in the conversion of spermidine to spermine, leading to increased spermidine and decreased spermine content. AMD-1, adenosylmethionine decarboxylase; dcSAM, decarboxylated s-adenosylmethionine; ODC, ornithine decarboxylase; PAO, acetylpolyamine oxidase; SAM, s-adenosylmethionine; SAT1, spermidine/spermine acetyltransferase; SMOX, spermine oxidase; SMS, spermine synthase; SRM, spermidine synthase. (B) Sms mRNA expression in the brain of 7-week-old wild-type (WT) and G56S mutant mice. (C) SMS protein expression in brain and skeletal muscles (triceps and gastrocnemius) of 7-week-old wild-type and G56S mice. (D) 2D-crystal structure of the SMS protein with glycine at position 56 in the N-terminal region (circled). The 2D-crystal structure of SMS was modeled from protein data bank ID: 3C6M. (E) The atomic structure of glycine at position 56 in the N-terminal region of SMS protein. (F) Serine in place of glycine at position 56 of SMS protein; the extended serine sidechain is highlighted in yellow. (G,H) Brain (G) and skeletal muscle (H) polyamine content and spermidine/spermine (Spd/Spm) ratios in 24-week-old wild-type and G56S mice quantified by HPLC. Note that putrescine levels were below the limit of detection in the G56S skeletal muscle. Data represent mean±s.e.m. from n=3-5 mice per group. ns, not significant. *P<0.05, **P<0.01, ***P<0.001 (unpaired two-tailed t-tests).
Fig. 2.
Fig. 2.
Biometric analyses of G56S and wild-type mice. (A) Body weight was measured at the indicated ages. (B) Body length of 24-week-old mice. (C) Body composition of 15-week-old mice (percentage lean muscle and percentage fat weight) determined by EchoMRI scan. (D) Bone mineral density of 20-week-old mice measured by micro-CT scan. Data represent mean±s.e.m., n=7 mice per group. **P<0.01, ***P<0.001, ****P<0.0001 (unpaired two-tailed t-tests). WT, wild type.
Fig. 3.
Fig. 3.
Anxiety-related response monitoring in an open-field test. (A) Representative movement pattern of 24-week-old wild-type and G56S mice. Green, inner zone; red, outer zone. (B) Total activity of the animals at the indicated ages. (C) Number of entries to the inner zone of the open-field chamber. (D) Resting time (seconds) in the outer zone of the open-field chamber. Data represent mean±s.e.m., n=7. *P<0.05; **P<0.01 (unpaired two-tailed t-tests). ns, not significant. WT, wild type.
Fig. 4.
Fig. 4.
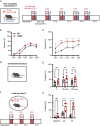
Performance of 16-week-old G56S and wild-type mice in the MWM test. (A) Illustration of the three components of the MWM test. The escape platform is submerged/hidden during the training period (daily for 5 days), removed during the probe test (day 6), or placed above the water level during the visible test (day 6). The top view of the area illustrates the location of the quadrants in which the animals are placed and the placement of the escape platform. (B) Time required to locate a hidden/submerged escape platform on each day of the five-day training period. (C) Time spent in the escape quadrant during the probe test, in which the platform was absent. (D) Time required to locate a visible escape platform on day 6. Data represent mean±s.e.m., n=7 mice per group. *P<0.05 (two-way ANOVA for repeated measures for B and unpaired two-tailed t-tests for C,D). ns, not significant. WT, wild type.
Fig. 5.
Fig. 5.
Auditory-cued fear responses of 5-month-old G56S and wild-type mice. (A) Illustration of fear acquisition training on day 1, in which the animals were subjected to sound stimulation for 20 s at 75 decibels, i.e. conditioned stimulation (CS), followed by foot shock and staggered inter-trial interval (ITI). (B,C) The fear response was expressed as the percentage of time spent in a stereotypical freezing state during CS (B) and ITI (C) periods. (D) Illustration of contextual test on day 2, in which the animal was placed in the same environment (indicated by a square cage), but without sound and shock stimulation. (E) The freezing state of the animals was recorded at the indicated times. (F) Illustration of cued-fear response on day 3, in which the animals were placed in a new environment (indicated by a circular cage) and provided with CS, i.e. sound stimulation for 20 s at 75 decibels, three times with no foot shock and variable ITIs. (G) The freezing state of the animals was recorded at baseline (during habituation), during CS and during ITIs. Data represent mean±s.e.m. from n=7 animals per group. *P<0.05; **P<0.01; ***P<0.001; ****P<0.0001 (two-way ANOVA analysis for repeated measures for B,C,E and unpaired two-tailed t-tests for G). ns, not significant. WT, wild type.
Fig. 6.
Fig. 6.
Brain MRI of 18-week-old wild-type and G56S mice. (A) Representative MRI images of coronal sections of wild-type and G56S brains. Annotations of different brain regions were based on the Allen Mouse Brain Atlas. (B,C) Volumetric analyses of the total brain volume (B) and volumes of the annotated regions (C) highlighted in A. Regional brain volumes were normalized to the total brain volumes. (D) Fractional anisotropy was quantified using DSI-Studio software. Comparisons of single variables between wild-type and G56S mice were performed using unpaired two-tailed t-tests. Data represent mean±s.e.m., n=5-7 mice per group. *P<0.05; **P<0.01; ***P<0.001. ns, not significant. WT, wild type.
Fig. 7.
Fig. 7.
Transcriptomic analysis of brain cortex from 18-week-old wild-type and G56S mice. (A) Comparison of brain cortical region between wild-type and G56S mice revealed 1137 differentially expressed genes (DEGs), comprising 589 upregulated and 548 downregulated transcripts. (B) Heatmap of selected genes that exhibit statistically significant differences in expression (P<0.05) and absolute values of log2-fold change (LFC) greater than or equal to 1. (C) Different biological pathways identified by gene enrichment analysis of the upregulated and downregulated transcripts with P<0.05 and absolute LFC≥0.5. (D) Volcano plot showing the relative expression of selected genes involved in oxidative phosphorylation. (E) qPCR validation of selected genes implicated in oxidative phosphorylation, eukaryotic initiation factor 2 (eIF2) signaling and Huntington's disease. Data represent mean±s.e.m. from n=3 animals per group. *P<0.05; **P<0.01 (unpaired two-tailed t-tests). ns, not significant. WT, wild type.
Fig. 8.
Fig. 8.
Mitochondrial respiration in Sms knockout murine hippocampal cells. (A,B) An SMS-deficient in vitro model (SMS-KO) was generated using CRISPR-mediated deletion in murine embryonic hippocampal (mHippoE) cells. SMS protein expression in the SMS-KO and control (CTRL) mHippoE cells was assessed by western blotting (A) and polyamine content measured by HPLC (B). (C) Mitochondrial respiration profiles of CTRL (red line) and SMS-KO (blue) cells. Oligomycin (ATP synthase inhibitor), FCCP (H+ ionophore) and rotenone/antimycin (mitochondria complex I/III inhibitors) were added at the indicated times. (D-G) Comparison of basal respiration (D), maximal respiration (E), ATP production (F) and spare respiratory capacity (G) between mHippoE SMS-KO and CTRL cells assessed using a Seahorse XFe96 analyzer. Data represent mean±s.e.m. from n=16 technical replicates of three independent experiments. *P<0.05; **P<0.01; ***P<0.001 (unpaired two-tailed t-tests).

Update of

Similar articles

Cited by

References

    1. Akinyele, O. and Wallace, H. M. (2022). Understanding the polyamine and mTOR pathway interaction in breast cancer cell growth. Med. Sci. 10, 51. 10.3390/medsci10030051 - DOI - PMC - PubMed
    1. Arruabarrena-Aristorena, A., Zabala-Letona, A. and Carracedo, A. (2018). Oil for the cancer engine: the cross-talk between oncogenic signaling and polyamine metabolism. Sci. Adv. 4, eaar2606. 10.1126/sciadv.aar2606 - DOI - PMC - PubMed
    1. Bachrach, U., Wang, Y. C. and Tabib, A. (2001). Polyamines: new cues in cellular signal transduction. News Physiol. Sci. 16, 106-109. 10.1152/physiologyonline.2001.16.3.106 - DOI - PubMed
    1. Cason, A. L., Ikeguchi, Y., Skinner, C., Wood, T. C., Holden, K. R., Lubs, H. A., Martinez, F., Simensen, R. J., Stevenson, R. E., Pegg, A. E.et al. (2003). X-linked spermine synthase gene (SMS) defect: the first polyamine deficiency syndrome. Eur. J. Hum. Genet. 11, 937-944. 10.1038/sj.ejhg.5201072 - DOI - PubMed
    1. Cervetto, C., Vergani, L., Passalacqua, M., Ragazzoni, M., Venturini, A., Cecconi, F., Berretta, N., Mercuri, N., D'Amelio, M., Maura, G.et al. (2016). Astrocyte-dependent vulnerability to excitotoxicity in spermine oxidase-overexpressing mouse. Neuromolecular Med. 18, 50-68. 10.1007/s12017-015-8377-3 - DOI - PubMed

Publication types

MeSH terms

Supplementary concepts