

Urea breath test for Helicobacter pylori infection in adult dyspeptic patients: A meta-analysis of diagnostic test accuracy
- PMID: 38463019
- PMCID: PMC10921142
- DOI: 10.3748/wjg.v30.i6.579
Urea breath test for Helicobacter pylori infection in adult dyspeptic patients: A meta-analysis of diagnostic test accuracy
Abstract
Background: Helicobacter pylori (H. pylori) infection has been well-established as a significant risk factor for several gastrointestinal disorders. The urea breath test (UBT) has emerged as a leading non-invasive method for detecting H. pylori. Despite numerous studies confirming its substantial accuracy, the reliability of UBT results is often compromised by inherent limitations. These findings underscore the need for a rigorous statistical synthesis to clarify and reconcile the diagnostic accuracy of the UBT for the diagnosis of H. pylori infection.
Aim: To determine and compare the diagnostic accuracy of 13C-UBT and 14C-UBT for H. pylori infection in adult patients with dyspepsia.
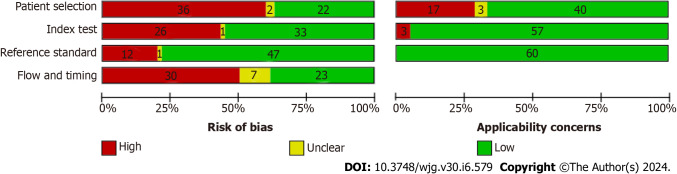
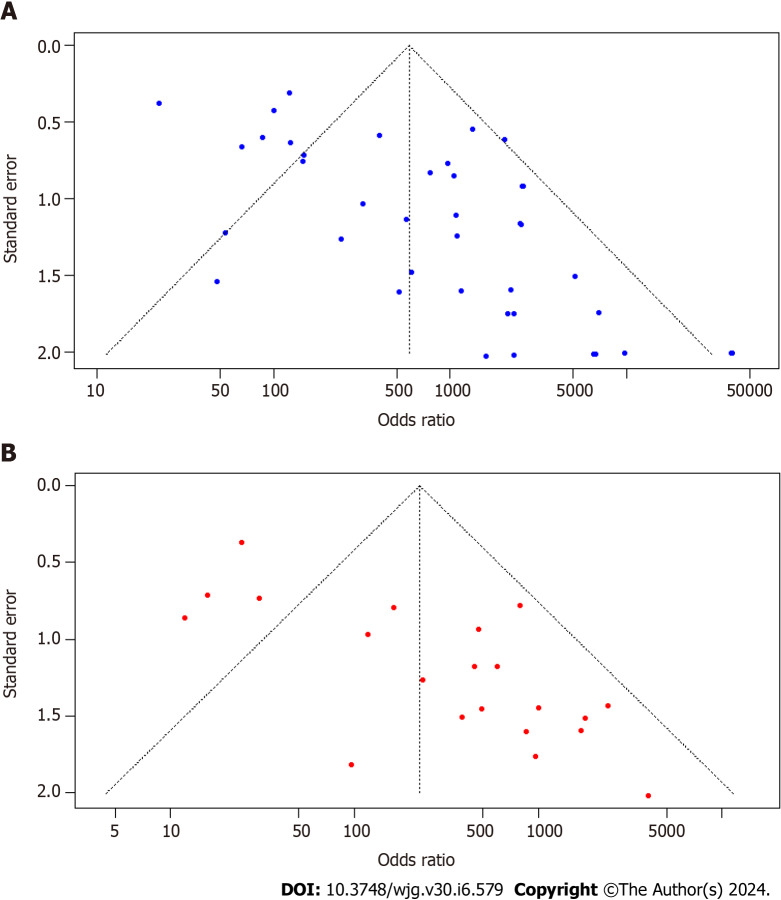
Methods: We conducted an independent search of the PubMed/MEDLINE, EMBASE, and Cochrane Central databases until April 2022. Our search included diagnostic accuracy studies that evaluated at least one of the index tests (13C-UBT or 14C-UBT) against a reference standard. We used the QUADAS-2 tool to assess the methodological quality of the studies. We utilized the bivariate random-effects model to calculate sensitivity, specificity, positive and negative test likelihood ratios (LR+ and LR-), as well as the diagnostic odds ratio (DOR), and their 95% confidence intervals. We conducted subgroup analyses based on urea dosing, time after urea administration, and assessment technique. To investigate a possible threshold effect, we conducted Spearman correlation analysis, and we generated summary receiver operating characteristic (SROC) curves to assess heterogeneity. Finally, we visually inspected a funnel plot and used Egger's test to evaluate publication bias.
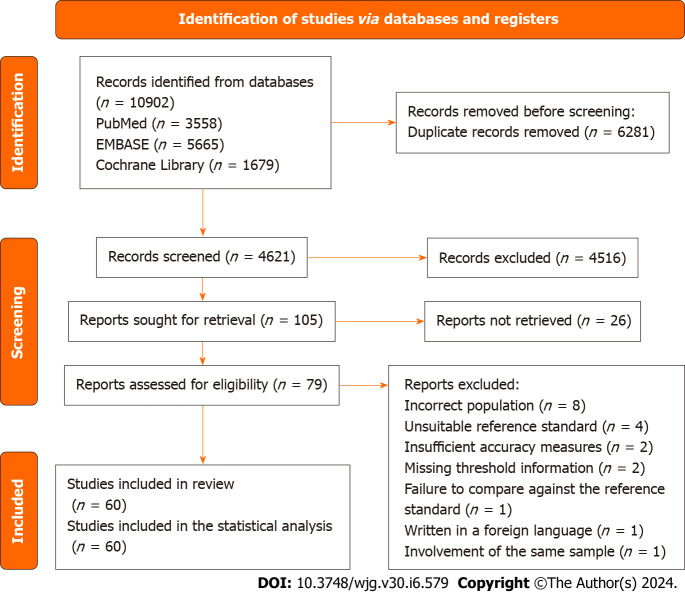
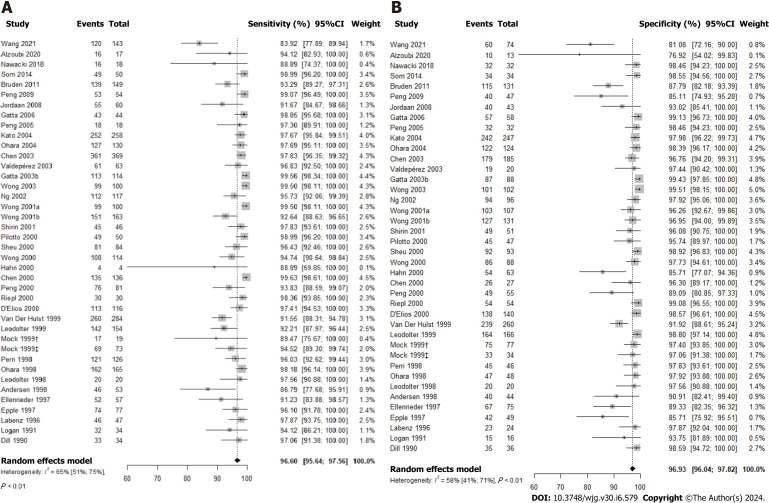
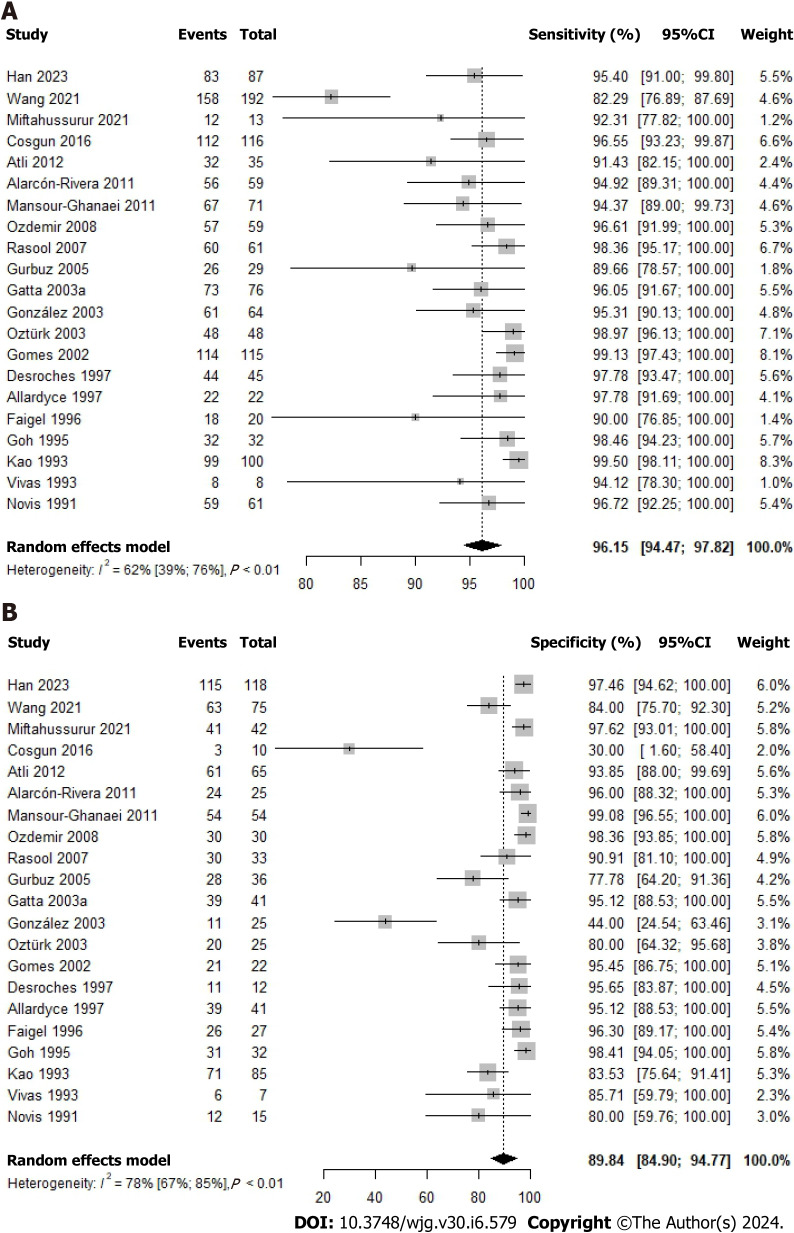
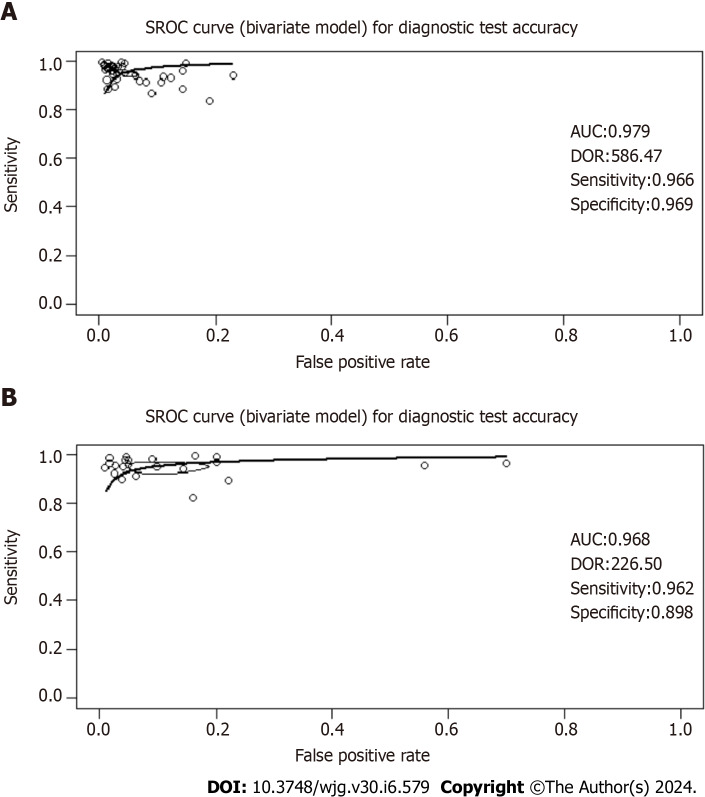
Results: The titles and abstracts of 4621 studies were screened; 79 articles were retrieved and selected for full-text reading. Finally, 60 studies were included in the diagnostic test accuracy meta-analysis. Our analysis demonstrates superior diagnostic accuracy of 13C-UBT over 14C-UBT, indicated by higher sensitivity (96.60% vs 96.15%), specificity (96.93% vs 89.84%), likelihood ratios (LR+ 22.00 vs 10.10; LR- 0.05 vs 0.06), and area under the curve (AUC; 0.979 vs 0.968). Notably, 13C-UBT's DOR (586.47) significantly outperforms 14C-UBT (DOR 226.50), making it the preferred diagnostic tool for dyspeptic individuals with H. pylori infection. Correlation analysis revealed no threshold effect (13C-UBT: r = 0.48; 14C-UBT: r = -0.01), and SROC curves showed consistent accuracy. Both 13C-UBT and 14C-UBT showed high AUC values (13C-UBT 0.979; 14C-UBT 0.968) near 1.00, reinforcing their excellent accuracy and endorsing both as reliable diagnostic tools in clinical practice.
Conclusion: In summary, our study has demonstrated that 13C-UBT has been found to outperform the 14C-UBT, making it the preferred diagnostic approach. Additionally, our results emphasize the significance of carefully considering urea dosage, assessment timing, and measurement techniques for both tests to enhance diagnostic precision. Nevertheless, it is crucial for researchers and clinicians to evaluate the strengths and limitations of our findings before implementing them in practice.
Keywords: Diagnosis; Diagnostic test accuracy; Helicobacter pylori; Meta-analysis; Urea breath test.
©The Author(s) 2024. Published by Baishideng Publishing Group Inc. All rights reserved.
Conflict of interest statement
Conflict-of-interest statement: The authors declare no conflict of interest.
Figures
Similar articles
-
Accuracy of urea breath test in Helicobacter pylori infection: meta-analysis.World J Gastroenterol. 2015 Jan 28;21(4):1305-14. doi: 10.3748/wjg.v21.i4.1305. World J Gastroenterol. 2015. PMID: 25632206 Free PMC article. Review.
-
Evaluation of urea breath test as a diagnostic tool for Helicobacter pylori infection in adult dyspeptic patients.World J Gastroenterol. 2024 May 7;30(17):2302-2307. doi: 10.3748/wjg.v30.i17.2302. World J Gastroenterol. 2024. PMID: 38813047 Free PMC article.
-
Diagnostic accuracy of the 14C-urea breath test in Helicobacter pylori infections: a meta-analysis.Wien Klin Wochenschr. 2017 Jan;129(1-2):38-45. doi: 10.1007/s00508-016-1117-3. Epub 2016 Nov 15. Wien Klin Wochenschr. 2017. PMID: 27848071 Review.
-
Carbon-13 urea breath test for Helicobacter pylori infection in patients with uninvestigated ulcer-like dyspepsia: an evidence-based analysis.Ont Health Technol Assess Ser. 2013 Oct 1;13(19):1-30. eCollection 2013. Ont Health Technol Assess Ser. 2013. PMID: 24228082 Free PMC article. Review.
-
13C-urea breath test for the diagnosis of Helicobacter pylori infection in children: a systematic review and meta-analysis.Helicobacter. 2011 Aug;16(4):327-37. doi: 10.1111/j.1523-5378.2011.00863.x. Helicobacter. 2011. PMID: 21762274
Cited by
-
Change in Diagnosis of Helicobacter pylori Infection in the Treatment-Failure Era.Antibiotics (Basel). 2024 Apr 12;13(4):357. doi: 10.3390/antibiotics13040357. Antibiotics (Basel). 2024. PMID: 38667033 Free PMC article. Review.
-
Recent advances in rapid detection of Helicobacter pylori by lateral flow assay.Arch Microbiol. 2025 Jan 16;207(2):35. doi: 10.1007/s00203-025-04239-w. Arch Microbiol. 2025. PMID: 39820420 Review.
-
Prevalence and risk factors of H. pylori infection among outpatient in Karaganda city (Kazakhstan).Future Sci OA. 2025 Dec;11(1):2461429. doi: 10.1080/20565623.2025.2461429. Epub 2025 Feb 10. Future Sci OA. 2025. PMID: 39927633 Free PMC article.
References
-
- Li Y, Choi H, Leung K, Jiang F, Graham DY, Leung WK. Global prevalence of Helicobacter pylori infection between 1980 and 2022: a systematic review and meta-analysis. Lancet Gastroenterol Hepatol. 2023;8:553–564. - PubMed
-
- Usui Y, Taniyama Y, Endo M, Koyanagi YN, Kasugai Y, Oze I, Ito H, Imoto I, Tanaka T, Tajika M, Niwa Y, Iwasaki Y, Aoi T, Hakozaki N, Takata S, Suzuki K, Terao C, Hatakeyama M, Hirata M, Sugano K, Yoshida T, Kamatani Y, Nakagawa H, Matsuda K, Murakami Y, Spurdle AB, Matsuo K, Momozawa Y. Helicobacter pylori, Homologous-Recombination Genes, and Gastric Cancer. N Engl J Med. 2023;388:1181–1190. - PubMed
Publication types
MeSH terms
Substances
LinkOut - more resources
Full Text Sources
Medical
Miscellaneous
