. 2024 Feb 26;3(3):pgae094.
doi: 10.1093/pnasnexus/pgae094. eCollection 2024 Mar.

Genetic dissection of mutagenic repair and T-DNA capture at CRISPR-induced DNA breaks in Arabidopsis thaliana

Affiliations

Genetic dissection of mutagenic repair and T-DNA capture at CRISPR-induced DNA breaks in Arabidopsis thaliana

Lycka Kamoen et al. PNAS Nexus. .

Abstract

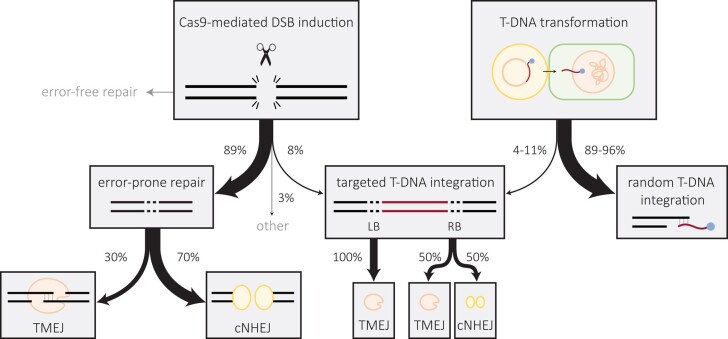
A practical and powerful approach for genome editing in plants is delivery of CRISPR reagents via Agrobacterium tumefaciens transformation. The double-strand break (DSB)-inducing enzyme is expressed from a transferred segment of bacterial DNA, the T-DNA, which upon transformation integrates at random locations into the host genome or is captured at the self-inflicted DSB site. To develop efficient strategies for precise genome editing, it is thus important to define the mechanisms that repair CRISPR-induced DSBs, as well as those that govern random and targeted integration of T-DNA. In this study, we present a detailed and comprehensive genetic analysis of Cas9-induced DSB repair and T-DNA capture in the model plant Arabidopsis thaliana. We found that classical nonhomologous end joining (cNHEJ) and polymerase theta-mediated end joining (TMEJ) are both, and in part redundantly, acting on CRISPR-induced DSBs to produce very different mutational outcomes. We used newly developed CISGUIDE technology to establish that 8% of mutant alleles have captured T-DNA at the induced break site. In addition, we find T-DNA shards within genomic DSB repair sites indicative of frequent temporary interactions during TMEJ. Analysis of thousands of plant genome-T-DNA junctions, followed up by genetic dissection, further reveals that TMEJ is responsible for attaching the 3' end of T-DNA to a CRISPR-induced DSB, while the 5' end can be attached via TMEJ as well as cNHEJ. By identifying the mechanisms that act to connect recombinogenic ends of DNA molecules at chromosomal breaks, and quantifying their contributions, our study supports the development of tailor-made strategies toward predictable engineering of crop plants.

Keywords: Arabidopsis thaliana; DNA repair; T-DNA; classical nonhomologous end joining (cNHEJ); polymerase theta-mediated end joining (TMEJ).


Figures

Fig. 1.
Fig. 1.
Mutational footprints in the PPO locus. A) A schematic overview of the experiment. T-DNA is transferred from A. tumefaciens to roots of A. thaliana seedlings. Cas9 and sgRNA is expressed from the T-DNA and a DSB is induced in the PPO locus, which can be repaired by one of the EJ pathways. After isolation of the genomic DNA, the region around the DSB is amplified and deep sequenced. B) Percentage and type of mutations. The error bars represent the SE between biological replicates. The dashed line represents control data without DSB induction. C) Mutational spectra at the PPO locus for the indicated genotypes combined for all biological replicates. The relative position on the x-axis includes the expected DSB position at 0 bp. All mutational events are stacked and sorted based on their size. The number of sequencing reads representing a specific outcome is represented by the thickness of the respective bar. The events are color-coded based on the type of event and the extent of microhomology (MH). D) Histogram depicting the deletion size class distribution of all deletion events. E) Histogram depicting the insertion size of all insertion events. F) Histogram depicting the microhomology use of all deletion events. D–F) The error bars represent the SE between biological replicates. The weighted average is indicated on top of the bars. Statistical significance between the weighted averages was calculated by Kruskal–Wallis test, followed by a post hoc Wilcoxon rank-sum test with Bonferroni correction for multiple testing. ns, not significant. **P ≤ 0.01, ***P ≤ 0.001.
Fig. 2.
Fig. 2.
Mutational footprints in the GL2 locus in stable Cas9-expressor lines. A) A schematic overview of the experiment. Homozygous Cas9-expressor lines containing a sgRNA for the GL2 locus and a single nucleotide deletion in the GL2 locus are crossed with homozygous teb or ku70 mutant lines. For each EJ mutant or wild-type (teb, TEB, ku70 and KU70), three F2 individuals were selected that were homozygous for Cas9 and sgRNA, heterozygous for GL2, and either homozygous or wild-type for the respective EJ gene. Four hundred F3 seedlings of each F2 plant were pooled, and of the isolated DNA, the GL2 locus was amplified and deep sequenced. B) Percentage of sequencing reads of the GL2 locus for Cas9-expressor lines with the indicated EJ deficiency or proficiency. The parental lines were heterozygous for the GL2 allele leading to ∼50% of reads with a single nucleotide deletion. The percentage of reads containing a mutational footprint different from the parental lines is indicated in dark blue. The error bars represent the SE between biological replicates. C) Spectra of mutations occurring in the GL2 locus for the indicated genotypes combined for all biological replicates. The relative position on the x-axis includes the expected DSB position at 0 bp. All mutational events are stacked and sorted based on their deletion size. The number of reads representing a specific outcome is represented by the thickness of the respective bar. The events are color-coded based on the type of event and the extent of microhomology (MH).
Fig. 3.
Fig. 3.
Unbiased identification of all interactants of the Cas9-induced DSB using CISGUIDE method. A) A schematic overview of the experiment. T-DNA is transferred from A. tumefaciens to roots of A. thaliana seedlings. Cas9 and the sgRNA are expressed from the T-DNA and a DSB is induced in the PPO locus, which can undergo interaction with other DNA ends (derived from genomic DNA or T-DNA). After isolation of the genomic DNA, the DNA is fragmented and adapter sequences are ligated to the ends. Junctions between the DSB flank and its interactant are subsequently enriched by PCR using one primer binding to the flank and one binding to the adapter. The resulting amplicons are deep sequenced. This experiment was performed for both flanks of the induced DSB. B) Verification of CISGUIDE outcomes. Left: schematic overview of the experiment. DNA of seedlings from wild-type and a stable T-DNA line is mixed in fixed ratios and processed. Right: percentages of T-DNA events identified by CISGUIDE compared with the input percentages. C) Percentage of nonwild-type sequencing reads. Repair indicates the distal end of the sequencing read contained the other flank of the break. T-DNA indicates the distal end contained part of the T-DNA. Other rearrangements indicate the distal end contained another sequence. The error bars represent the SE between biological replicates. D) Spectra of mutations of all events categorized as repair for the indicated genotypes combined for all biological replicates and both orientations. The relative position on the x-axis includes the expected DSB position at 0 bp. All mutational events are stacked and sorted based on their deletion size. The number of reads representing a specific outcome is represented by the thickness of the respective bar. The events are color-coded based on the type of event and the extent of microhomology (MH). E) Percentage of T-DNA events normalized for the percentage of mutagenic events depicted in B, divided in location on the T-DNA or binary vector backbone. LB and RB indicate a window of 200 bp around the respective border. Middle indicates any other location on the T-DNA. Vector indicates a position on the binary vector outside of the T region.
Fig. 4.
Fig. 4.
Mutational footprints in junctions between the genome and the T-DNA LB or RB. A) A schematic overview of the experiment. T-DNA is transferred from A. tumefaciens to roots of A. thaliana seedlings. Cas9 is expressed from the T-DNA and a DSB is induced, which can result in capture of the T-DNA. After isolation of the genomic DNA, the junction between the genome and respectively LB or RB is amplified and deep sequenced. B) Percentage of sequencing reads with or without filler sequence. The error bars represent the SE between biological replicates. Statistical significance was calculated by Kruskal–Wallis test, followed by a post hoc Wilcoxon rank-sum test with Bonferroni correction for multiple testing. **P ≤ 0.01. C) Spectra of mutations occurring in the T-DNA–genome junction for the indicated genotypes and borders, combined for all biological replicates. All mutational events are stacked and sorted based on their size. The number of reads representing a specific outcome is represented by the thickness of the respective bar. The events are color-coded based on the type of event and the extent of microhomology (MH). The relative position on the x-axis includes the expected T-DNA end and DSB position at 0 bp. Negative values indicate the T-DNA flank (red/gray) and positive values indicate the genomic flank (blue/gray). D) Histogram depicting the deletion size on the T-DNA flank of all direct capture events. E) Histogram depicting the deletion size on the genomic flank of all direct capture events. F) Histogram depicting the microhomology use of all direct capture events. D–F) The error bars represent the SE between biological replicates. The weighted average is indicated on top of the bars. Statistical significance between the weighted averages was calculated by Kruskal–Wallis test, followed by a post hoc Wilcoxon rank-sum test with Bonferroni correction for multiple testing. **P ≤ 0.01, ***P ≤ 0.001.
Fig. 5.
Fig. 5.
Origin of fillers in LB-genome junctions in wild-type. A) Distribution of fillers. Fillers smaller than 6 bp were not mapped. Fillers that were reliably mapped to either of the flanks or the T-DNA vector sequence are indicated. Unknown fillers could not be reliably mapped. B) Fillers mapping to the genomic flank. Negative values indicate the DSB flank not participating in the T-DNA junction. Positive values indicate the flank present in the junction. C) Fillers mapping to the T-DNA vector. All templated filler events are stacked and sorted based on their position on the reference sequence. Negative values on the x-axis indicate the T-DNA flank up to the expected nick site. Positive values indicate position on the binary vector downstream of the expected nick site. The number of sequencing reads representing a specific outcome is represented by the thickness of the respective bar. The size of the templated insertion is represented by the width of the bar. The events are color-coded based on their orientation relative to the reference: FW, forward; RC, reverse complement. D) Targeted vs. random T-DNA integration. T-DNA junctions that are within a 1,000-bp region around the induced DSB site are considered targeted. Targeted events are presented as a percentage of all recovered T-DNA junctions for the indicated genotypes and borders.
Fig. 6.
Fig. 6.
Scheme integrating all outcomes of our studies, which highlights the interrelation between repair of Cas9-induced breaks and T-DNA integration, and the pathways mediating them. The frequencies shown are obtained within this study.

Similar articles

Cited by

References

    1. Yadav NS, Vanderleyden J, Bennett DR, Barnes WM, Chilton M-D. 1982. Short direct repeats flank the T-DNA on a nopaline Ti plasmid. Proc Natl Acad Sci U S A. 79:6322–6326. - PMC - PubMed
    1. Gelvin SB. 2017. Integration of Agrobacterium T-DNA into the plant genome. Annu Rev Genet. 51:195–217. - PubMed
    1. Herrera-Estrella A, Van Montagu M, Wang K. 1990. A bacterial peptide acting as a plant nuclear targeting signal: the amino-terminal portion of Agrobacterium VirD2 protein directs a beta-galactosidase fusion protein into tobacco nuclei. Proc Natl Acad Sci U S A. 87:9534–9537. - PMC - PubMed
    1. Tzfira T, Frankman LR, Vaidya M, Citovsky V. 2003. Site-specific integration of Agrobacterium tumefaciens T-DNA via double-stranded intermediates. Plant Physiol. 133:1011–1023. - PMC - PubMed
    1. Liang Z, Tzfira T. 2013. In vivo formation of double-stranded T-DNA molecules by T-strand priming. Nat Commun. 4:2253. - PubMed