. 2024 Jan;42(1):25-40.
doi: 10.1111/coep.12623. Epub 2023 Aug 14.

The Impact of State Medicaid Eligibility and Benefits Policy on Neonatal Abstinence Syndrome Hospitalizations

Affiliations

The Impact of State Medicaid Eligibility and Benefits Policy on Neonatal Abstinence Syndrome Hospitalizations

Aparna Soni et al. Contemp Econ Policy. 2024 Jan.

Abstract

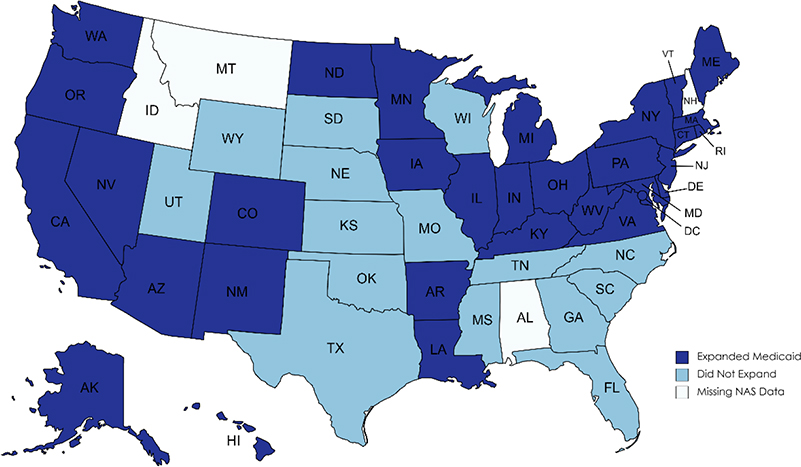
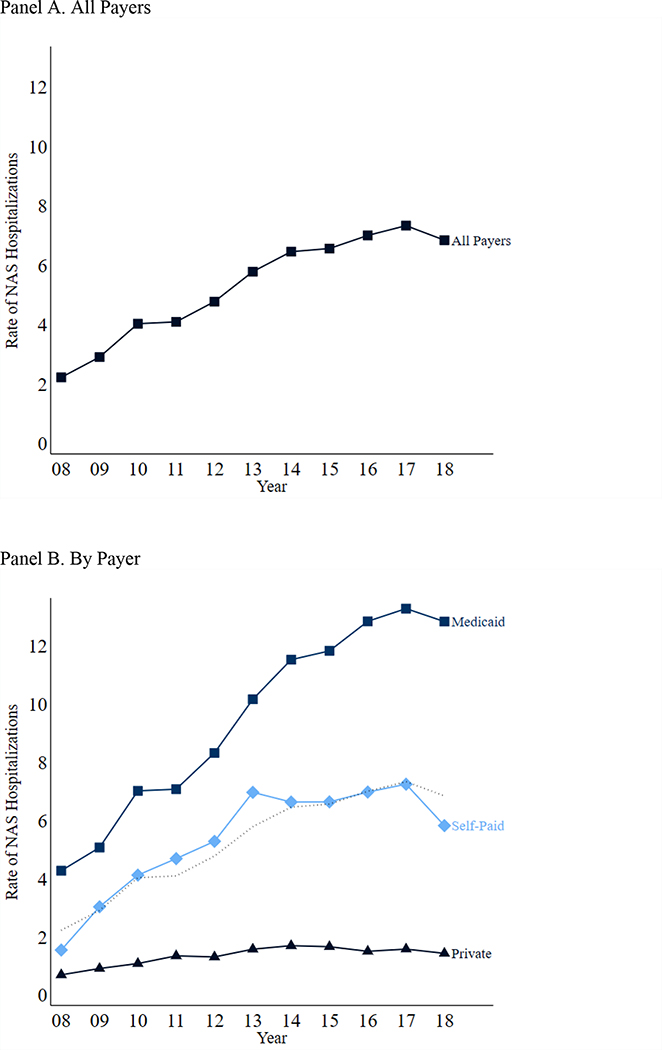
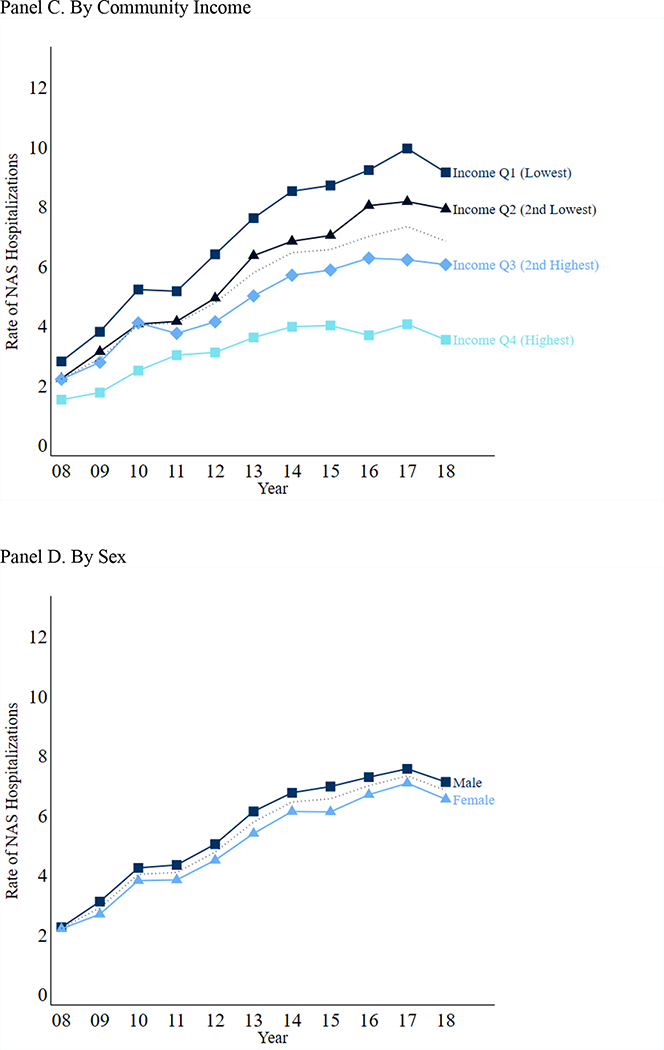
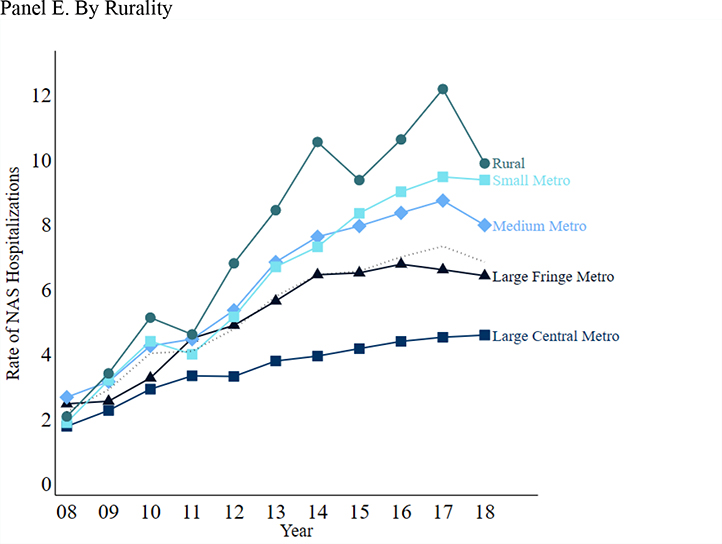
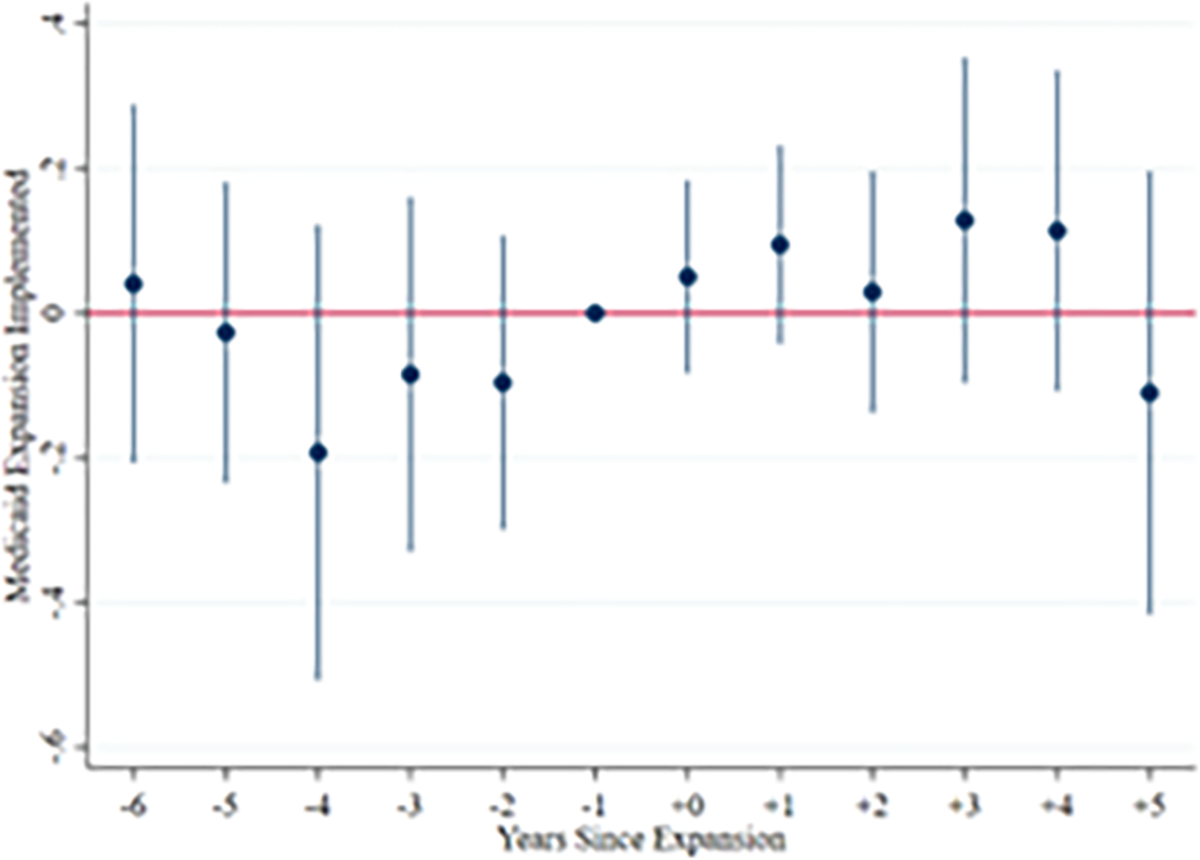
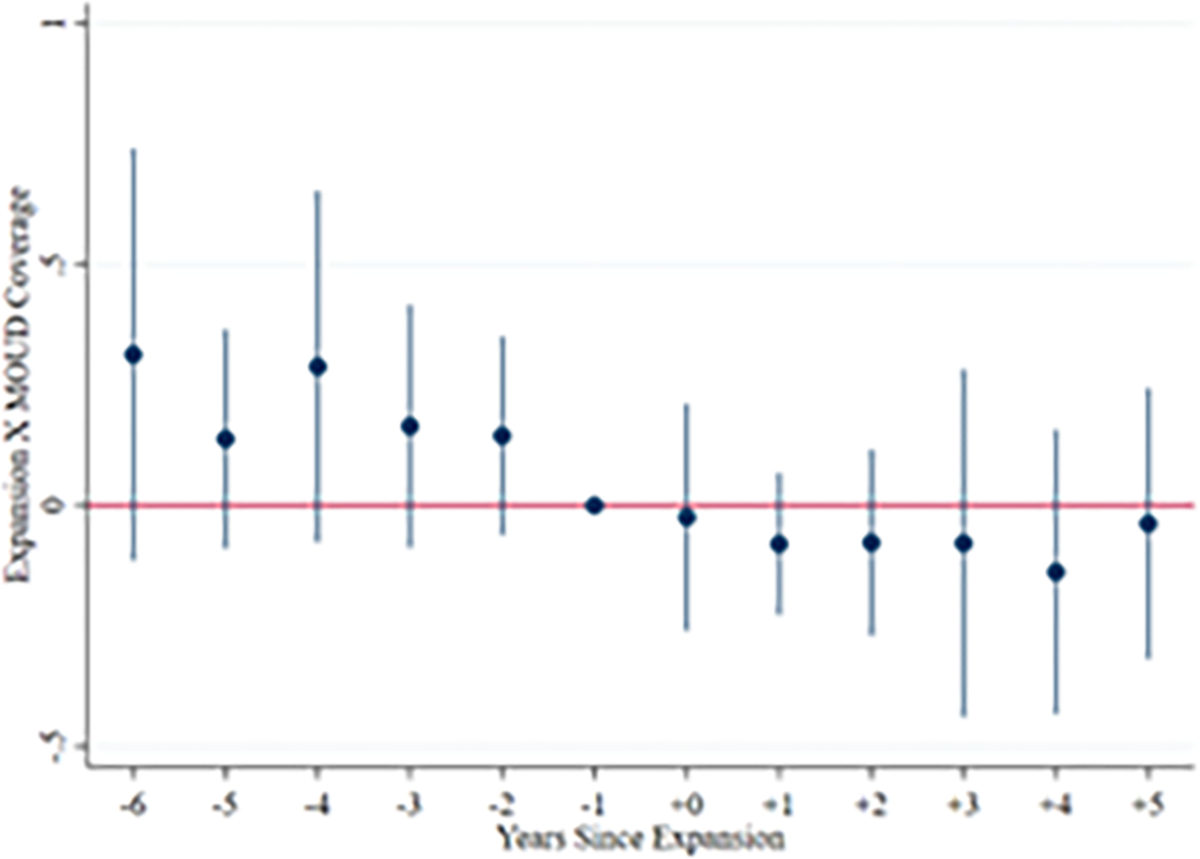
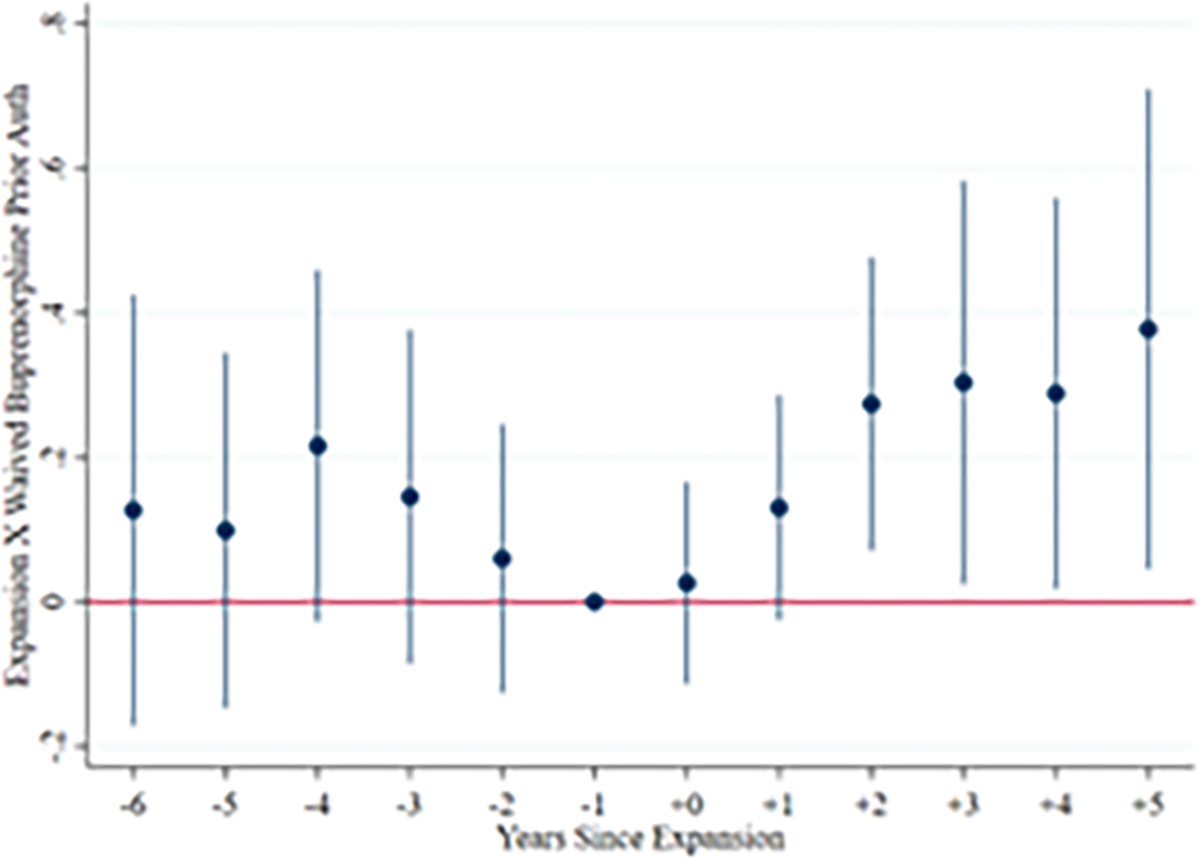
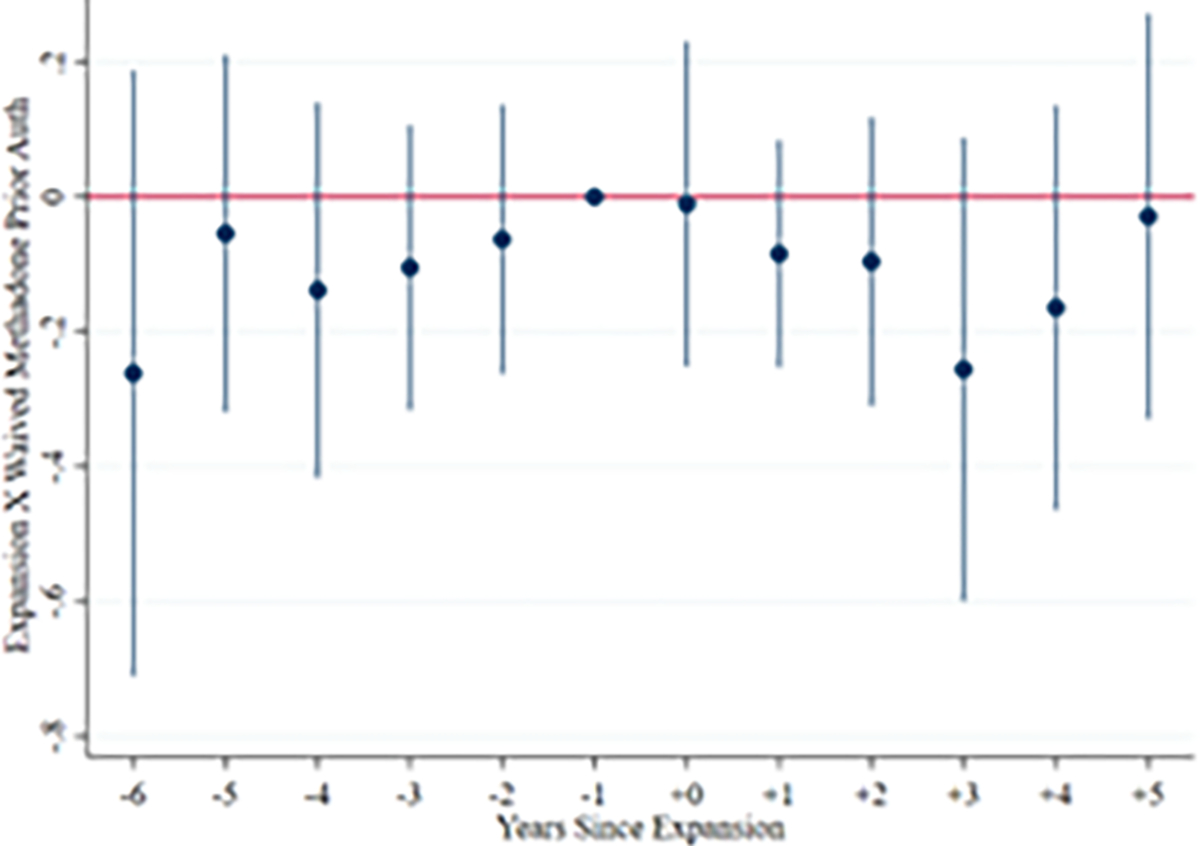
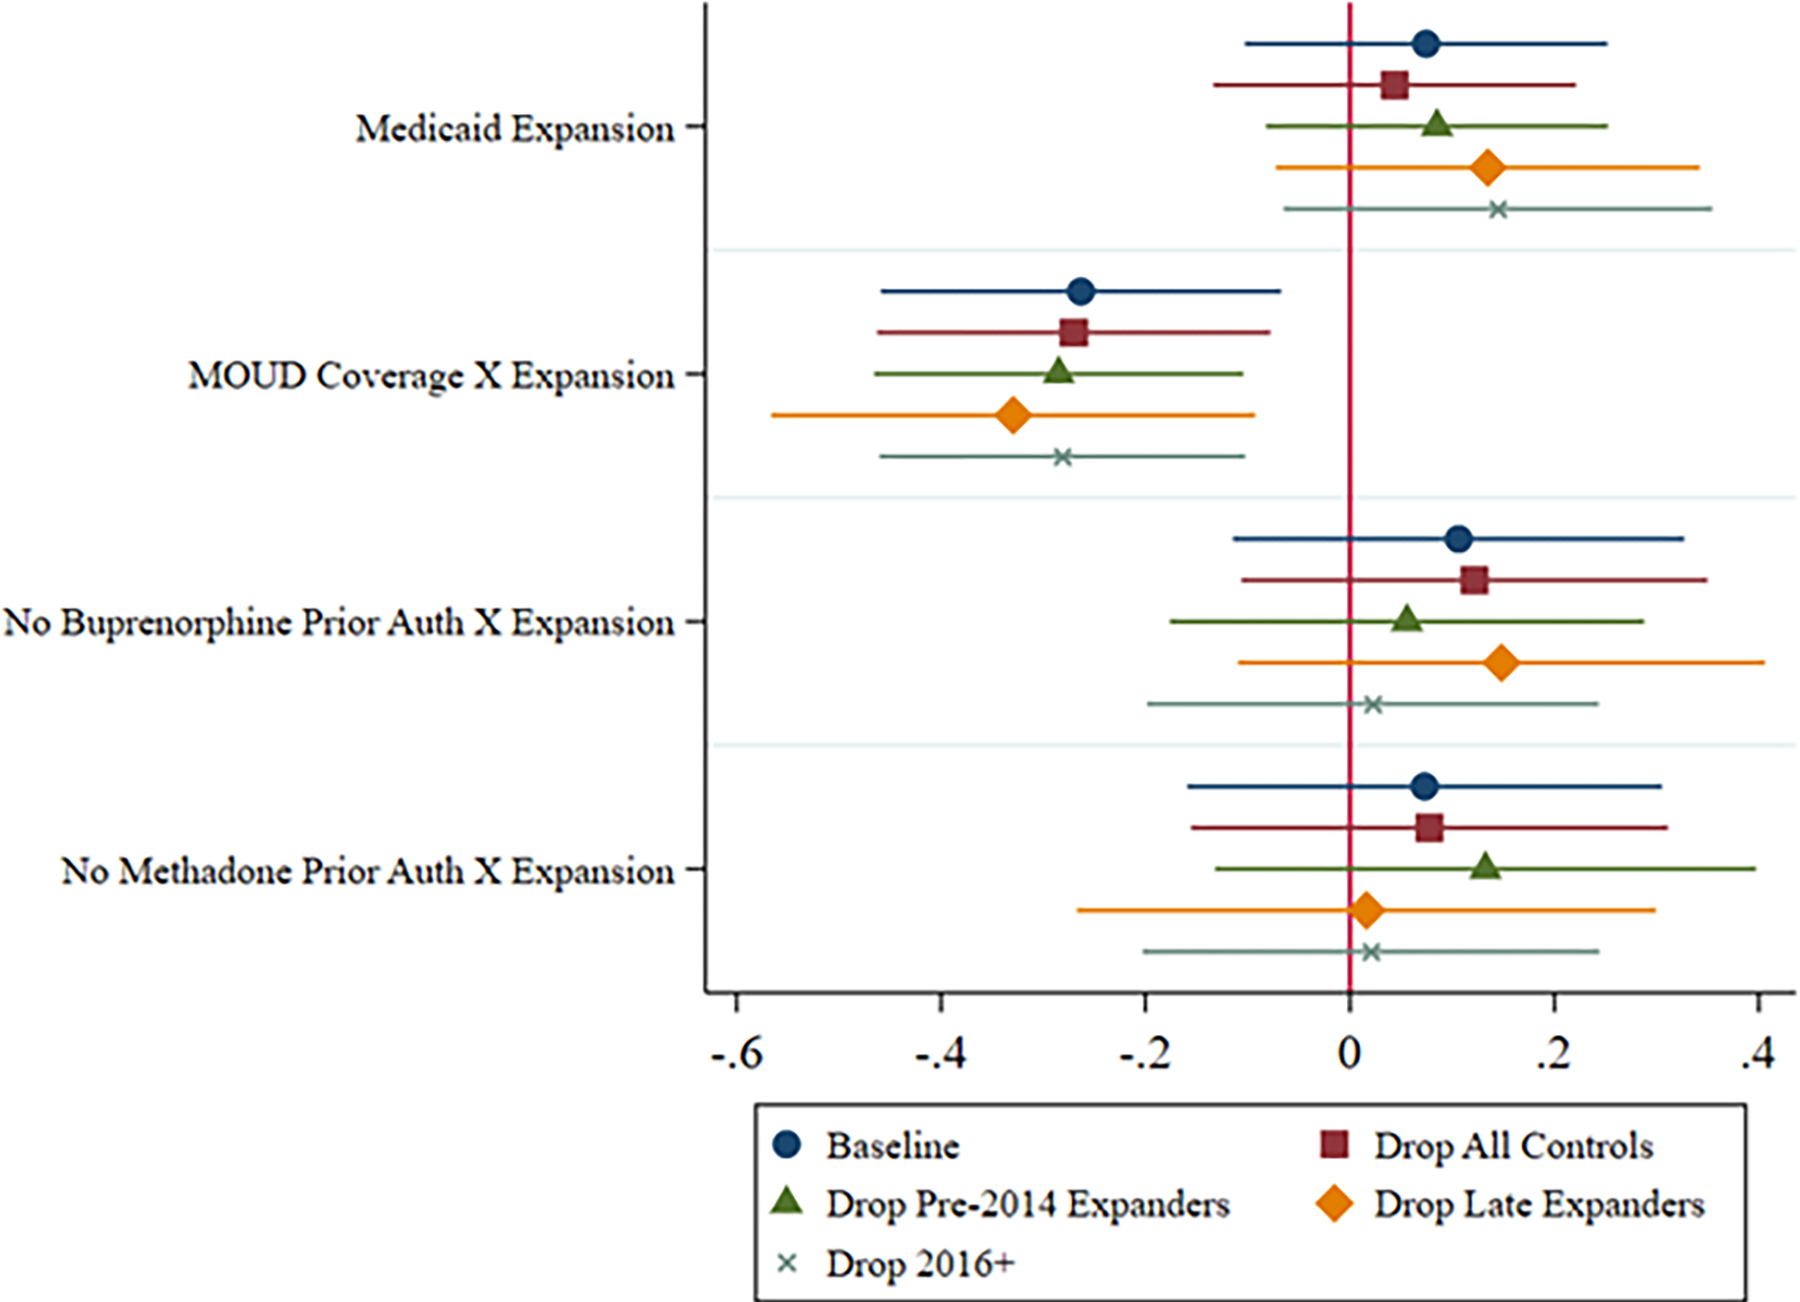
Rates of neonatal abstinence syndrome (NAS) resulting from opioid misuse are rising. However, policies to treat opioid misuse during pregnancy are unclear. We apply a difference-in-differences design to national pediatric discharge records to examine the effects of state Medicaid policies on NAS. Among states in which Medicaid covered two clinically-recommended medications for treating opioid misuse (buprenorphine, methadone), the Affordable Care Act's Medicaid expansion reduced Medicaid-covered NAS hospitalizations. Medicaid expansion did not affect NAS hospitalizations in other expansion states. These findings imply a nuanced relationship between Medicaid policy and NAS that should be considered in addressing opioid misuse among pregnant women.

Keywords: Medicaid; Neonatal abstinence syndrome; Opioids.


Conflict of interest statement

Conflict of Interest Statement: The authors have no known conflict of interest regarding the subject of this paper.

Figures

Appendix Figure 1.
Appendix Figure 1.. Implementation of State Medicaid Expansion (2019)
Notes: Authors created this figure from information in Kaiser Family Foundation (2022). States shaded in dark blue are those that implemented Medicaid expansion as of 2019. States shaded in light blue are those that did not implement Medicaid expansion as of 2019. States shaded in white are those for which NAS hospitalization data is not available in the HCUP FastStats.
Appendix Figure 2.
Appendix Figure 2.. Annual Rate of NAS Hospitalizations per 1,000 Newborn Hospitalization Over Time
Notes: Authors’ calculations based on HCUP FastStats 2008-18. Figure displays the nationwide number of NAS hospitalizations per 1,000 newborn hospitalizations each year. The denominator is consistently defined with the numerator (e.g., rates for females use NAS and newborn hospitalization counts specific to females). The dotted line in Panels B through E presents the aggregate nationwide rate.
Appendix Figure 3.
Appendix Figure 3.. Increase in Medicaid-Covered NAS Hospitalization Rate, 2008 to 2019
Notes: Authors’ calculations based on HCUP FastStats 2008-19. Figure displays state-level increases in the number of Medicaid-covered NAS hospitalizations per 1,000 (Medicaid-covered) newborn hospitalizations from 2008 to 2019. States shaded in white are missing NAS hospitalization data for at least one year between 2008 and 2019.
Appendix Figure 4.
Appendix Figure 4.. Coefficient Distributions from the “Leave One State Out” Analysis
Notes: Authors’ calculations based on HCUP FastStats 2008-19. Outcome is logged Medicaid-covered NAS hospitalizations per 1,000 (Medicaid-covered) newborn hospitalizations. Figures display the distribution of coefficients and 95% confidence intervals for β terms in Equation (1), omitting one state at a time from analysis. All regressions control for whether the state has a mandatory access PDMP, any PDMP, a good Samaritan law, a naloxone access law, treatment capacity for opioid use disorders, legalized marijuana, pre-2014 state Medicaid expansion status, state unemployment rate, state poverty rate, state fixed effects, and year fixed effects. Standard errors are clustered by state.
Appendix Figure 5.
Appendix Figure 5.. Event Study Results for Impact of State Medicaid Policy on All-Payer NAS Hospitalization Rate
Notes: Authors’ calculations based on HCUP FastStats 2008-19. Outcome is logged all-payer NAS hospitalizations per 1,000 (all-payer) newborn hospitalizations. Figures display coefficients and 95% confidence intervals for the α terms in Equation (2). Regression also controls for whether the state has a mandatory access PDMP, any PDMP, a good Samaritan law, a naloxone access law, treatment capacity for opioid use disorders, legalized marijuana, pre-2014 state Medicaid expansion status, state unemployment rate, state poverty rate, state fixed effects, and year fixed effects. Standard errors are clustered at the state level.
Figure 1.
Figure 1.. Number of Neonatal Abstinence Syndrome Hospitalizations Over Time (All Payers)
Notes: Authors’ calculations based on HCUP FastStats 2008–18. Figure displays the nationwide number of NAS hospitalizations each year. 2015 counts are not reported due to the change in clinical coding system.
Figure 2.
Figure 2.. Event Study Results for Impact of State Medicaid Policy on Medicaid-Covered NAS Hospitalization Rate
Panel A. Medicaid Expansion X Years Since Expansion Panel B. MOUD Coverage X Medicaid Expansion X Years Since Expansion Panel C. No Buprenorphine Prior Authorization X Medicaid Expansion X Years Since Expansion Panel D. No Methadone Prior Authorization X Medicaid Expansion X Years Since Expansion Notes: Authors’ calculations based on HCUP FastStats 2008–19. Outcome is logged Medicaid-covered NAS hospitalizations per 1,000 (Medicaid-covered) newborn hospitalizations. Figures display coefficients and 95% confidence intervals for the α terms in Equation (2). Regression also controls for whether the state has a mandatory access PDMP, any PDMP, a good Samaritan law, a naloxone access law, treatment capacity for opioid use disorders, legalized marijuana, pre-2014 state Medicaid expansion status, state unemployment rate, state poverty rate, state fixed effects, and year fixed effects. Standard errors are clustered at the state level.
Figure 3.
Figure 3.. Sensitivity Analyses
Notes: Authors’ calculations based on HCUP FastStats 2008–19. Figure displays coefficient estimates and 95% confidence intervals for five separate regressions. Outcome is logged Medicaid-covered NAS hospitalizations per 1,000 (Medicaid-covered) newborn hospitalizations. Unless otherwise indicated, regressions also control for whether the state has a mandatory access PDMP, any PDMP, a good Samaritan law, a naloxone access law, treatment capacity for opioid use disorders, legalized marijuana, pre-2014 state Medicaid expansion status, state unemployment rate, state poverty rate, state fixed effects, and year fixed effects. * p < 0.10, ** p < 0.05, *** p < 0.01

Similar articles

References

    1. Abraham AJ, Andrews CM, Harris SJ, & Friedmann PD (2020). Availability of medications for the treatment of alcohol and opioid use disorder in the USA. Neurotherapeutics, 17(1), 55–69. - PMC - PubMed
    1. American Society of Addiction Medicine. (2020). The ASAM National Practice Guideline for the Use of Medication in the Treatment of Addiction Involving Opioid Use: 2020 Focused Update. https://www.asam.org/docs/default-source/quality-science/npg-jam-supplem... - PMC - PubMed
    1. Andrews CM, Grogan CM, Smith BT, Abraham AJ, Pollack HA, Humphreys K, Westlake MA, & Friedmann PD (2018a). Medicaid benefits for addiction treatment expanded after implementation of the Affordable Care Act. Health Affairs (Project Hope), 37(8), 1216–1222. - PMC - PubMed
    1. Andrews CM, Grogan CM, Westlake MA, Abraham AJ, D’Aunno TA, & Friedmann PD (2018b). Do benefits restrictions limit Medicaid acceptance in addiction treatment? Results from a national study. Journal of Substance Abuse Treatment, 87, 50–55. - PMC - PubMed
    1. Andrews CM, Abraham AJ, Grogan CM, Westlake MA, Pollack HA, & Friedmann PD (2019). Impact of Medicaid restrictions on availability of buprenorphine in addiction treatment programs. American Journal of Public Health, 109(3), 434–436. - PMC - PubMed

LinkOut - more resources