

Evaluating the Practicality of Causal Inference From Non-randomized Observational Data in Small-Scale Clinical Settings: A Study on the Effects of Ninjin'yoeito
- PMID: 38463406
- PMCID: PMC10924150
- DOI: 10.7759/cureus.55825
Evaluating the Practicality of Causal Inference From Non-randomized Observational Data in Small-Scale Clinical Settings: A Study on the Effects of Ninjin'yoeito
Abstract
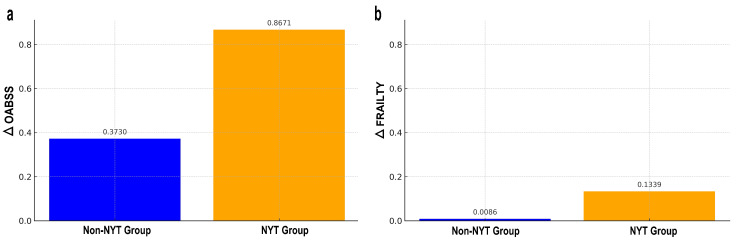
Objective The primary goal of this study was to demonstrate the practical application of causal inference using non-randomized observational data, adapting this approach to smaller populations, such as those in hospitals or community healthcare. This adaptation seeks a more effective and practical research method than randomized controlled trials (RCTs), with the goal of revealing novel insights unexplored by traditional research and enhancing understanding within the realm of causal inference. Methods This study evaluated the effects of Ninjin'yoeito (NYT), a traditional Japanese Kampo medicine, on Overactive Bladder Symptom Score (OABSS) and the frailty scores. Employing new statistical methods, this study sought to illustrate the efficacy of estimating causal relationships from non-randomized data in a clinical setting. The database included 985 women aged 65-90 years who visited a clinic between November 2016 and November 2022. By utilizing various statistical techniques, including regression analysis, inverse probability of treatment weighting (IPTW), instrumental variable (IV), and difference-in-differences (DiD) analysis, this study aimed to provide insights beyond traditional methods, attempting to bridge the gap between theory and practice in causal inference. Results After applying propensity score matching, the NYT treatment group (220 participants) and non-treatment group (182 participants) were each adjusted to two groups of 159 individuals. NYT significantly improved OABSS and frailty scores. IPTW analysis highlighted that on average, the NYT treatment group showed an improvement of 0.8671 points in OABSS and 0.1339 points in the frailty scores, surpassing the non-treatment group (p<0.05). IV analysis indicated that NYT treatment is predicted to increase ΔOABSS by an average of approximately 4.86 points, highlighting its significant positive impact on OABSS improvement. The DiD analysis showed that the NYT treatment group demonstrated an average improvement of 0.5457 points in OABSS, which was significantly higher than that of the control group. The adjusted R² value for the model is 0.025. Conclusion This study successfully implemented a practical application of causal inference using non-randomized observational data in a relatively small population. NYT showed a significant improvement in OABSS and vulnerability, and this result was confirmed using a new statistical method. The relatively low adjusted R² of the model suggests the existence of other unmeasured variables that influence OABSS and vulnerability improvement. In particular, the use of diverse statistical techniques, including IPTW, IV, and DiD analysis, is an important step toward revealing the effectiveness of inferring causal relationships from non-randomized data and narrowing the gap between theory and practice. This study provides a valid and practical alternative to RCTs and reveals new insights that have not been explored in traditional research.
Keywords: causal inference; difference-in-differences; instrumental variable; inverse probability of treatment weighting; ninjin'yoeito; non-randomized observational data; overactive bladder symptom score; propensity score matching.
Copyright © 2024, Okui et al.
Conflict of interest statement
The authors have declared that no competing interests exist.
Figures

Similar articles
-
Ninjin'yoeito in the Management of Frailty and Overactive Bladder in Elderly Women: A Report of Two Cases.Cureus. 2024 Sep 13;16(9):e69304. doi: 10.7759/cureus.69304. eCollection 2024 Sep. Cureus. 2024. PMID: 39398850 Free PMC article.
-
Ninjin'yoeito Improves Genitourinary Symptoms in Patients With Frailty.Cureus. 2023 Jun 21;15(6):e40767. doi: 10.7759/cureus.40767. eCollection 2023 Jun. Cureus. 2023. PMID: 37363115 Free PMC article.
-
Topological Data Analysis of Ninjin'yoeito Effects Unraveling Complex Interconnections in Patients With Frailty: A Pilot Study.Cureus. 2024 Nov 30;16(11):e74855. doi: 10.7759/cureus.74855. eCollection 2024 Nov. Cureus. 2024. PMID: 39737299 Free PMC article.
-
Perspectives on the Use of Ninjin'yoeito in Modern Medicine: A Review of Randomized Controlled Trials.Evid Based Complement Alternat Med. 2019 Sep 2;2019:9590260. doi: 10.1155/2019/9590260. eCollection 2019. Evid Based Complement Alternat Med. 2019. PMID: 31565066 Free PMC article. Review.
-
Ninjin'yoeito, a herbal medicine, enhances glucose tolerance in mice.Neuropeptides. 2021 Aug;88:102150. doi: 10.1016/j.npep.2021.102150. Epub 2021 Apr 16. Neuropeptides. 2021. PMID: 33895618 Review.
Cited by
-
Ninjin'yoeito in the Management of Frailty and Overactive Bladder in Elderly Women: A Report of Two Cases.Cureus. 2024 Sep 13;16(9):e69304. doi: 10.7759/cureus.69304. eCollection 2024 Sep. Cureus. 2024. PMID: 39398850 Free PMC article.
-
Laser treatment for urinary incontinence in elite female athletes analyzed using a discrete mathematics approach.Sci Rep. 2025 May 2;15(1):15450. doi: 10.1038/s41598-025-00363-1. Sci Rep. 2025. PMID: 40316601 Free PMC article.
References
-
- Designing observational studies for credible causal inference in addiction research-directed acyclic graphs, modified disjunctive cause criterion and target trial emulation. Chan GC, Sun T, Stjepanović D, Vu G, Hall WD, Connor JP, Leung J. https://onlinelibrary.wiley.com/doi/pdf/10.1111/add.16442 Addiction. 2024 - PubMed
-
- Using design thinking to differentiate useful from misleading evidence in observational research. Goodman SN, Schneeweiss S, Baiocchi M. JAMA. 2017;317:705–707. - PubMed
LinkOut - more resources
Full Text Sources
Miscellaneous