. 2024 Feb 23:7:100136.
doi: 10.1016/j.crstbi.2024.100136. eCollection 2024.

Structure-function analyses reveal Arabidopsis thaliana HDA7 to be an inactive histone deacetylase

Affiliations

Structure-function analyses reveal Arabidopsis thaliana HDA7 to be an inactive histone deacetylase

Ketul Saharan et al. Curr Res Struct Biol. .

Abstract

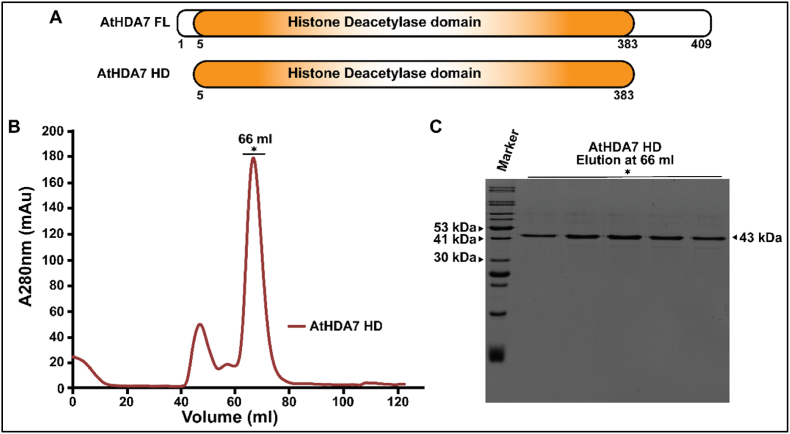
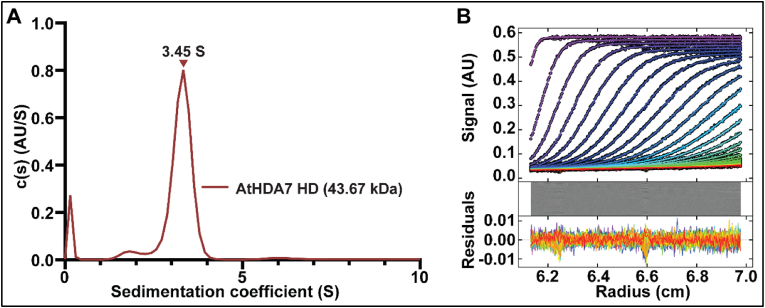
Histone deacetylases (HDACs), responsible for the removal of acetyl groups from histone tails, are important epigenetic factors. They play a critical role in the regulation of gene expression and are significant in the context of plant growth and development. The Rpd3/Hda1 family of HDACs is reported to regulate key biological processes in plants, such as stress response, seed, embryonic, and floral development. Here, we characterized Arabidopsis thaliana HDA7, a Class I, Rpd3/Hda1 family HDAC. SAXS and AUC results show that the recombinantly expressed and purified histone deacetylase domain of AtHDA7 exists as a monomer in solution. Further, the crystal structure showed AtHDA7 to fold into the typical α/β arginase fold, characteristic of Rpd3/Hda1 family HDACs. Sequence analysis revealed that the Asp and His residues of the catalytic 'XDXH' motif present in functional Rpd3/Hda1 family HDACs are mutated to Gly and Pro, respectively, in AtHDA7, suggesting that it might be catalytically inactive. The Asp and His residues are important for Zn2+-binding. Not surprisingly, the crystal structure did not have Zn2+ bound in the catalytic pocket, which is essential for the HDAC activity. Further, our in vitro activity assay revealed AtHDA7 to be inactive as an HDAC. A search in the sequence databases suggested that homologs of AtHDA7 are found exclusively in the Brassicaceae family to which Arabidopsis belongs. It is possible that HDA7 descended from HDA6 through whole genome duplication and triplication events during evolution, as suggested in a previous phylogenetic study.

Keywords: Analytical ultracentrifugation; Histone deacetylases; Small-angle X-ray scattering; X-ray crystallography.


Conflict of interest statement

The authors declare that they have no known competing financial interests or personal relationships that could have appeared to influence the work reported in this paper.

Figures

Image 1
Graphical abstract
Fig. 1
Fig. 1
Multiple sequence alignment of AtHDA7 with human class I Rpd3/Hda1 HDACs. The multiple sequence alignment of A. thaliana HDAC7 with class I Rpd3/Hda1 HDACs, including AtHDA1/19, AtHDA6, AtHDA9 and HsHDA8. The yellow boxes show similar residues, while the red boxes show identical residues. The red-colored star symbols illustrate the catalytic residues involved in substrate binding, while the cyan-colored circles show the residues involved in zinc binding. The residue numbering is shown for AtHDA7 while the secondary structural illustrations (α is α-helix, β is β-strand, and η is 310-helix) are shown for the HsHDA8. The residues substituted in the case of AtHDA7 are shown in the black boxes with residue numbering. The multiple sequence alignment was performed using the T-coffee server, and its pictorial representation was constructed using the Esprit 4.0 server. (For interpretation of the references to color in this figure legend, the reader is referred to the Web version of this article.)
Fig. 2
Fig. 2
Construct design and purification of AtHDA7 HD. (A) Illustration of AtHDA7 construct design. The full-length AtHDA7 possesses a central histone deacetylase domain (in orange) flanked by a few residues at both ends that are relatively disordered and hence avoided in the construct design. (B) The size-exclusion chromatographic purification profile of AtHDA7 HD shows a major peak at 66 ml and a minor peak near 50 ml. (C) The SDS-PAGE analysis of eluted fraction from the major peak gave a single band of 43 kDa, which is equivalent to the theoretical molecular weight of AtHDA7 HD. The asterisk symbol shows the elution fractions from SEC loaded on the SDS-PAGE. (For interpretation of the references to color in this figure legend, the reader is referred to the Web version of this article.)
Fig. 3
Fig. 3
Sedimentation velocity analytical ultracentrifugation analysis of AtHDA7 HD. (A) SV-AUC of AtHDA7 HD illustrating the continuous distribution as a function of sedimentation coefficient profile. AtHDA7 HD sample demonstrated a major peak with over 85% distribution, suggesting the protein adopts a monomeric state. (B) The upper panel shows the representative progressive absorbance scans fitted using the continuous distribution model. The middle and lower panel shows the bitmap and the residual plot.
Fig. 4
Fig. 4
Small angle X-ray scattering analysis of AtHDA7 HD. (A) The straight-line fitting to the data point in the Guinier plot indicates that the protein sample has no aggregation. (B) The Kratky plot with the partial bell-shaped distribution demonstrates that the AtHDA7 HD has marginal flexibility. (C) The distance distribution profile indicates that the protein is partially extended in nature with a Dmax value of 10.16 nm. (D) The SAXS-derived low-resolution beaded envelope (in grey) fitted with the AtHDA7 HD crystal structure (helix in red, strands in yellow, unstructured region in green) with a C-terminal hexa-histidine tag added. (E) The plot shows the overlapped profile of experimental scattering from SAXS and theoretical scattering from the AtHDA7 HD crystal structure. A χ2 value of 2.48 shows that the experimental and theoretical scattering aligns well. (For interpretation of the references to color in this figure legend, the reader is referred to the Web version of this article.)
Fig. 5
Fig. 5
Crystal structure of AtHDA7 HD and comparison with other Class I Rpd3/Hda1 crystal structures. (A) The crystal structure of AtHDA7 HD (cyan) is shown in the cartoon model. The α/β arginase fold of AtHDA7 HD holds α-helices (α1 to α15), 310 helices (η1 to η 3) and parallel β-strands (β1 to β8). (B) The 2D topology diagram of AtHDA7 HD. The α-helix (α), 310-helix (η), and the β-strands are in cyan. (C) The structural alignment of AtHDA7 HD with human Class I Rpd3/Hda1 HDACs, wherein AtHDA7 HD is in cyan, HsHDAC1 is in yellow (PDB ID: 4BKX), HsHDAC2 is in orange (PDB ID: 7ZZ0), HsHDAC3 is in pink (PDB ID: 4A69) and HsHDAC8 in green (PDB ID: 1W22). The regions within the black-dotted area show major variations among the aligned structures. (For interpretation of the references to color in this figure legend, the reader is referred to the Web version of this article.)
Fig. 6
Fig. 6
Structural comparison of the catalytic pocket residues of AtHDA7 with other Class I Rpd3/Hda1 HDAC crystal structures. The residues responsible for deacetylase activity in the catalytic pocket are illustrated as sticks for (A) AtHDA7 (cyan), (B) HsHDAC1 (PDB ID: 4BKX) (yellow), (C) HsHDAC2 (PDB ID: 7ZZO) (orange), (D) HsHDAC3 (PDB ID: 4A69) (pink) and (E) HsHDAC8 (PDB ID: 1W22) (green). The Zn2+ ion is shown as a grey sphere. The black dotted lines represent the coordination of Zn2+ ion with catalytic residues. The red dotted boxes in (A) highlight the Gly183 and Pro185 residues in the catalytic pocket of AtHDA7. (For interpretation of the references to color in this figure legend, the reader is referred to the Web version of this article.)
Fig. 7
Fig. 7
In vitro histone deacetylase activity assay of AtHDA7 HD. The graph displays the histone deacetylase activity as a relative fluorescence unit (RFU). AtHDA7 HD at three increasing concentrations did not display deacetylase activity, similar to BSA (negative control). AtHDA18 HD at three increasing concentrations served as positive control and demonstrated deacetylase activity. The Error bars (dark red) in the graph demonstrate the standard deviation (SD) of three technical replicates. The black dots represent the RFU values of three replicates for respective samples. (For interpretation of the references to color in this figure legend, the reader is referred to the Web version of this article.)

Similar articles

References

    1. Adams P.D., Grosse-Kunstleve R.W., Hung L.W., Ioerger T.R., McCoy A.J., Moriarty N.W., Read R.J., Sacchettini J.C., Sauter N.K., Terwilliger T.C. PHENIX: building new software for automated crystallographic structure determination. Acta Crystallogr D Biol Crystallogr. 2002;58(Pt 11):1948–1954. doi: 10.1107/s0907444902016657. - DOI - PubMed
    1. Afonine P.V., Grosse-Kunstleve R.W., Echols N., Headd J.J., Moriarty N.W., Mustyakimov M., Terwilliger T.C., Urzhumtsev A., Zwart P.H., Adams P.D. Towards automated crystallographic structure refinement with phenix.refine. Acta Crystallogr D Biol Crystallogr. 2012;68(Pt 4):352–367. doi: 10.1107/S0907444912001308. - DOI - PMC - PubMed
    1. Bobde R.C., Kumar A., Vasudevan D. Plant-specific HDT family histone deacetylases are nucleoplasmins. Plant Cell. 2022;34(12):4760–4777. doi: 10.1093/plcell/koac275. - DOI - PMC - PubMed
    1. Chen C.Y., Tu Y.T., Hsu J.C., Hung H.C., Liu T.C., Lee Y.H., Chou C.C., Cheng Y.S., Wu K. Structure of Arabidopsis HISTONE DEACETYLASE15. Plant Physiol. 2020;184(3):1585–1600. doi: 10.1104/pp.20.00604. - DOI - PMC - PubMed
    1. Chen H.P., Zhao Y.T., Zhao T.C. Histone deacetylases and mechanisms of regulation of gene expression. Crit. Rev. Oncog. 2015;20(1-2):35–47. doi: 10.1615/critrevoncog.2015012997. - DOI - PMC - PubMed

LinkOut - more resources