

This is a preprint.
Thrombopoietin mimetic stimulates bone marrow vascular and stromal niches to mitigate acute radiation syndrome
- PMID: 38463959
- PMCID: PMC10925435
- DOI: 10.21203/rs.3.rs-3946910/v1
Thrombopoietin mimetic stimulates bone marrow vascular and stromal niches to mitigate acute radiation syndrome
Update in
-
Thrombopoietin mimetic stimulates bone marrow vascular and stromal niches to mitigate acute radiation syndrome.Stem Cell Res Ther. 2024 Apr 29;15(1):123. doi: 10.1186/s13287-024-03734-z. Stem Cell Res Ther. 2024. PMID: 38679747 Free PMC article.
Abstract
Background: Acute radiation syndrome (ARS) manifests after exposure to high doses of radiation in the instances of radiologic accidents or incidents. Facilitating the regeneration of the bone marrow (BM), namely the hematopoietic stem and progenitor cells (HSPCs), is a key in mitigating ARS and multi-organ failure. JNJ-26366821, a PEGylated thrombopoietin mimetic (TPOm) peptide, has been shown as an effective medical countermeasure (MCM) to treat hematopoietic-ARS (H-ARS) in mice. However, the activity of TPOm on regulating BM vascular and stromal niches to support HSPC regeneration has not yet been elucidated.
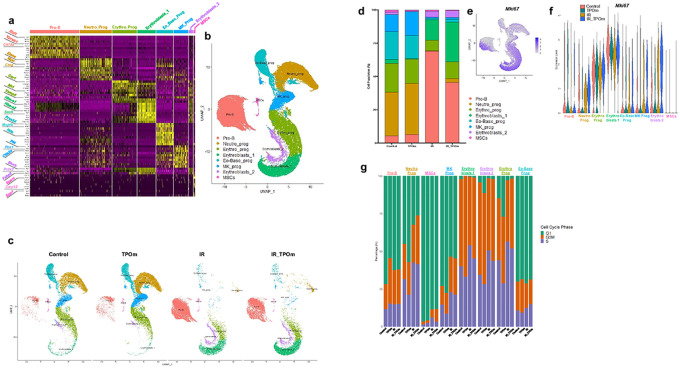
Methods: C57BL/6J mice (9-14 weeks old) received sublethal or lethal total body irradiation (TBI), a model for H-ARS, by 137Cs or X-rays. At 24 hours post-irradiation, mice were subcutaneously injected with a single dose of TPOm (0.3 mg/kg or 1.0 mg/kg) or PBS (vehicle). At homeostasis and on days 4, 7, 10, 14, 18, and 21 post-TBI with and without TPOm treatment, BM was harvested for histology, BM flow cytometry of HSPCs, endothelial (EC) and mesenchymal stromal cells (MSC), and whole-mount confocal microscopy. For survival, irradiated mice were monitored and weighed for 30 days. Lastly, BM triple negative cells (TNC; CD45-, TER-119-, CD31-) were sorted for single-cell RNA-sequencing to examine transcriptomics after TBI with or without TPOm treatment.
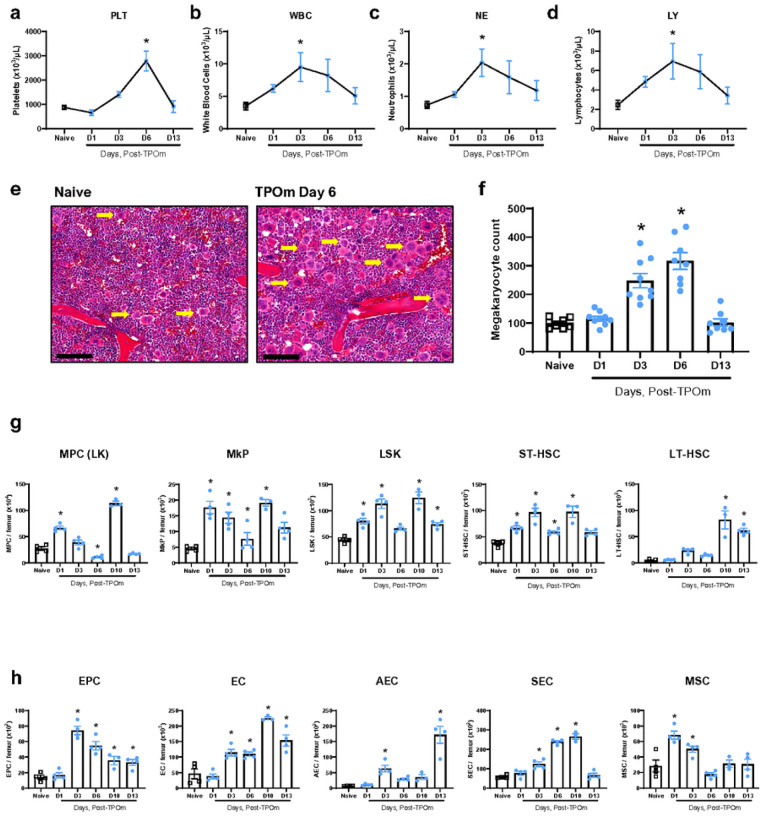
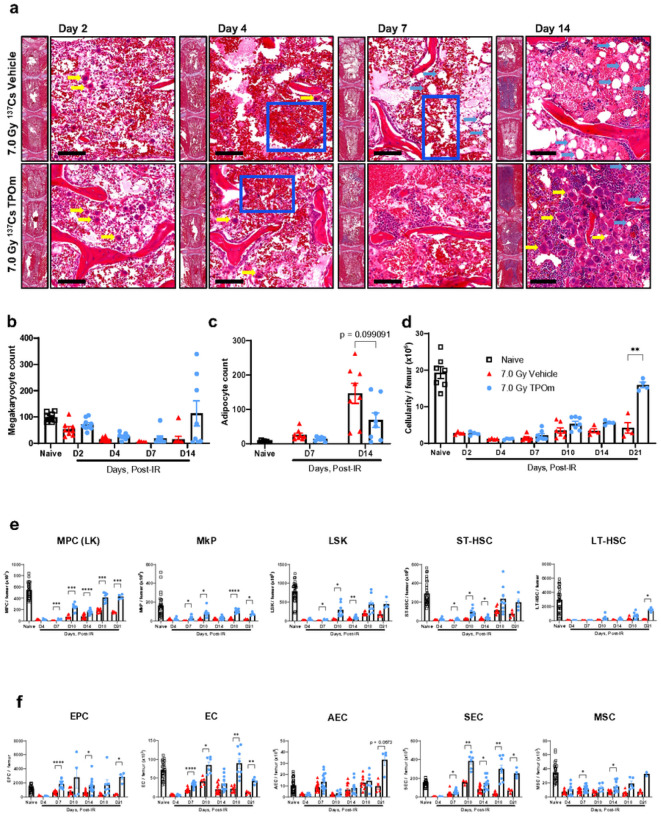
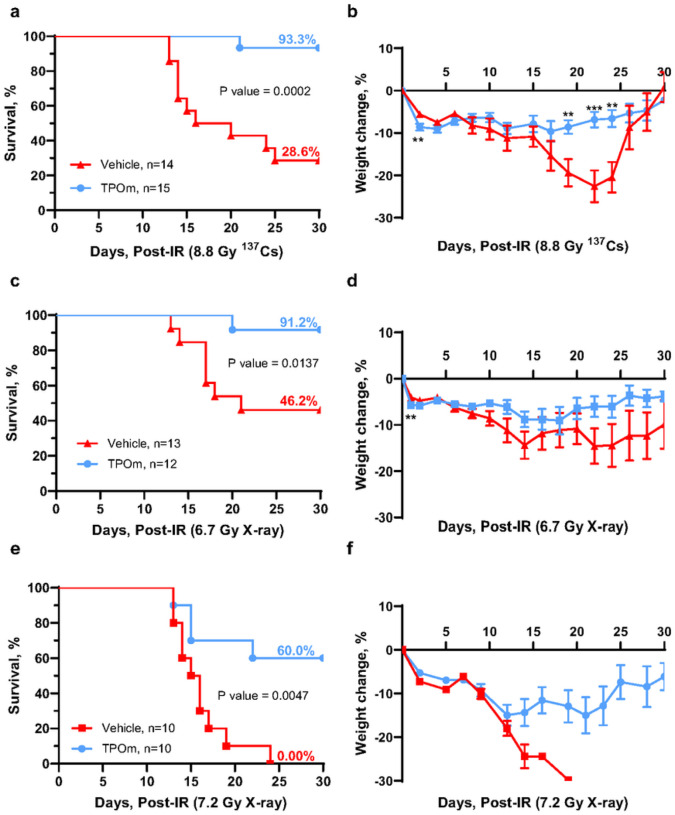
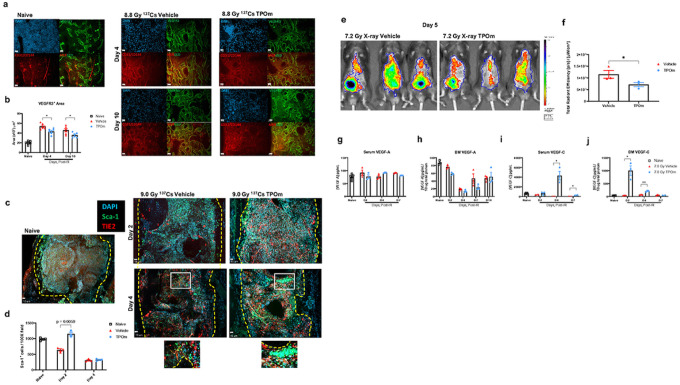
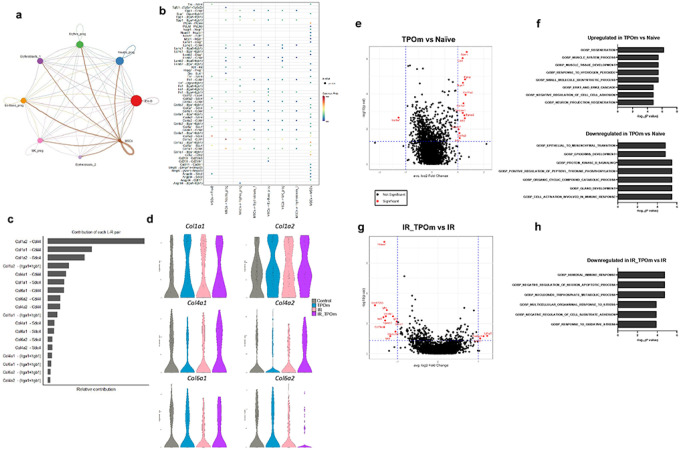
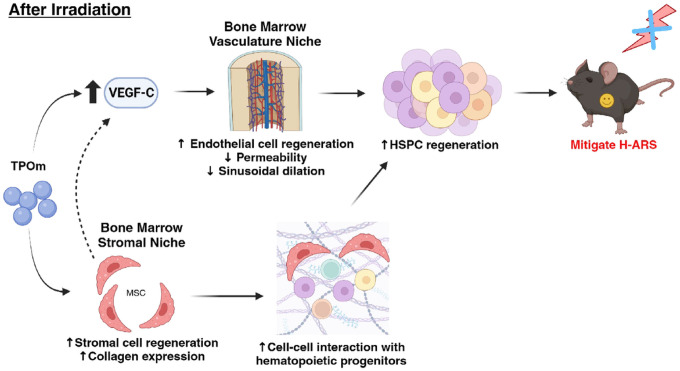
Results: At homeostasis, TPOm expanded the number of circulating platelets and HSPCs, ECs, and MSCs in the BM. Following sublethal TBI, TPOm improved BM architecture and promoted recovery of HSPCs, ECs, and MSCs. Furthermore, TPOm elevated VEGF-C levels in normal and irradiated mice. Following lethal irradiation, mice improved body weight recovery and 30-day survival when treated with TPOm after 137Cs and X-ray exposure. Additionally, TPOm reduced vascular dilation and permeability. Finally, single-cell RNA-seq analysis indicated that TPOm increased the expression of collagens in MSCs to enhance their interaction with other progenitors in BM and upregulated the regeneration pathway in MSCs.
Conclusions: TPOm interacts with BM vascular and stromal niches to locally support hematopoietic reconstitution and systemically improve survival in mice after TBI. Therefore, this work warrants the development of TPOm as a potent radiation MCM for the treatment of ARS.
Keywords: bone marrow; endothelial cells; hematopoietic acute radiation syndrome; mesenchymal stromal cells; thrombopoietin mimetic; total body irradiation.
Conflict of interest statement
Competing Interests G.E. was an employee of Janssen Pharmaceuticals and worked on the development of thrombopoietin mimetic (JNJ-26366821). J.V., W.Y., G.E., and C.G. have patented TPOm under US20230104658A1. G.E. and C.G. are co-founders of Bio Convergent Health. All other authors declare no competing interests.
Figures
Similar articles
-
Thrombopoietin mimetic stimulates bone marrow vascular and stromal niches to mitigate acute radiation syndrome.Stem Cell Res Ther. 2024 Apr 29;15(1):123. doi: 10.1186/s13287-024-03734-z. Stem Cell Res Ther. 2024. PMID: 38679747 Free PMC article.
-
Large-scale bioreactor production of extracellular vesicles from mesenchymal stromal cells for treatment of acute radiation syndrome.Stem Cell Res Ther. 2024 Mar 13;15(1):72. doi: 10.1186/s13287-024-03688-2. Stem Cell Res Ther. 2024. PMID: 38475968 Free PMC article.
-
Mesenchymal stem/stromal cells from human pluripotent stem cell-derived brain organoid enhance the ex vivo expansion and maintenance of hematopoietic stem/progenitor cells.Stem Cell Res Ther. 2024 Mar 5;15(1):68. doi: 10.1186/s13287-023-03624-w. Stem Cell Res Ther. 2024. PMID: 38443990 Free PMC article.
-
Sertindole for schizophrenia.Cochrane Database Syst Rev. 2005 Jul 20;2005(3):CD001715. doi: 10.1002/14651858.CD001715.pub2. Cochrane Database Syst Rev. 2005. PMID: 16034864 Free PMC article.
-
Corticosteroids for the treatment of Duchenne muscular dystrophy.Cochrane Database Syst Rev. 2016 May 5;2016(5):CD003725. doi: 10.1002/14651858.CD003725.pub4. Cochrane Database Syst Rev. 2016. PMID: 27149418 Free PMC article.
References
-
- Dainiak N. Hematologic consequences of exposure to ionizing radiation. Exp Hematol. 2002;30(6):513–28. - PubMed
-
- Seed TM. A review of radiation countermeasures focusing on injury-specific medicinals and regulatory approval status: part I. Radiation sub-syndromes, animal models and FDA-approved countermeasures AU - Singh, Vijay K. Int J Radiat Biol. 2017;93(9):851–69. - PubMed
-
- Hoggatt J, Kfoury Y, Scadden DT. Hematopoietic Stem Cell Niche in Health and Disease. Annu Rev Pathol. 2016;11:555–81. - PubMed
Publication types
Grants and funding
LinkOut - more resources
Full Text Sources
Research Materials
Miscellaneous
