[Preprint]. 2024 Jun 1:2024.02.29.582780.
doi: 10.1101/2024.02.29.582780.

Distinct Escherichia coli transcriptional profiles in the guts of recurrent UTI sufferers revealed by pangenome hybrid selection

Affiliations

Distinct Escherichia coli transcriptional profiles in the guts of recurrent UTI sufferers revealed by pangenome hybrid selection

Mark G Young et al. bioRxiv. .

Update in

Abstract

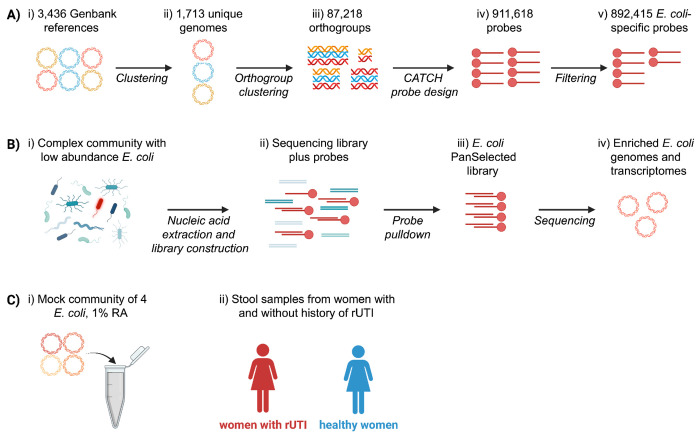
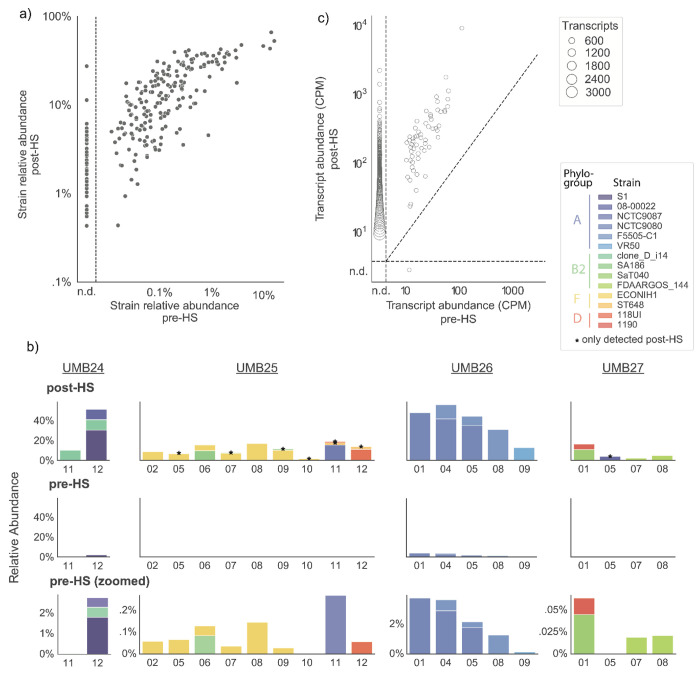
Low-abundance members of microbial communities are difficult to study in their native habitats. This includes Escherichia coli, a minor, but common inhabitant of the gastrointestinal tract and opportunistic pathogen, including of the urinary tract, where it is the primary pathogen. While multi-omic analyses have detailed critical interactions between uropathogenic Escherichia coli (UPEC) and the bladder that mediate UTI outcome, comparatively little is known about UPEC in its pre-infection reservoir, partly due to its low abundance there (<1% relative abundance). To accurately and sensitively explore the genomes and transcriptomes of diverse E. coli in gastrointestinal communities, we developed E. coli PanSelect which uses a set of probes designed to specifically recognize and capture E. coli's broad pangenome from sequencing libraries. We demonstrated the ability of E. coli PanSelect to enrich, by orders of magnitude, sequencing data from diverse E. coli using a mock community and a set of human stool samples collected as part of a cohort study investigating drivers of recurrent urinary tract infections (rUTI). Comparisons of genomes and transcriptomes between E. coli residing in the gastrointestinal tracts of women with and without a history of rUTI suggest that rUTI gut E. coli are responding to increased levels of oxygen and nitrate, suggestive of mucosal inflammation, which may have implications for recurrent disease. E. coli PanSelect is well suited for investigations of native in vivo biology of E. coli in other environments where it is at low relative abundance, and the framework described here has broad applicability to other highly diverse, low abundance organisms.


Figures

Figure 1.
Figure 1.. E. coli PanSelect probe design and applications.
a) Probe design. i) All available, complete E. coli genomes were downloaded from RefSeq (295) and the NCBI Pathogens database (3,141). ii) k-mer similarity was used to identify 1,713 unique genome clusters. iii) Orthologous gene groups were constructed from these genome clusters with SynerClust , filtered based on prevalence, and further clustered at 80% identity with UCLUST . 60-75 bp probes with specificity to the resulting clusters were iv) generated with CATCH and v) filtered based on homology to other common gut microbes (ie Bacteroidetes and Firmicutes). b) E. coli PanSelect workflow. i) Sequencing libraries are constructed from complex communities containing low abundances of E. coli (red). ii) Short, biotinylated oligonucleotide probes are added to the sequencing library, which bind complementary sequences. iii) Streptavidin pulldown is used to isolate bound target sequences from the library before iv) sequencing. c) Applications of E. coli PanSelect. i) Enrichment of a four strain mock community for initial benchmarking. ii) Analysis of E. coli gene content and transcription in stool from a clinical study of recurrent UTIs (rUTI). Created with BioRender.com.
Figure 2.
Figure 2.. E. coli PanSelect enriches E. coli DNA without bias from a 4-strain mock community.
a) The RAs of the four E. coli strains, pre- and post-HS, calculated using StrainGE. b) Average depth of coverage pre- and post-HS for each strain. c) Genome coverage pre-HS (thin lines) and post-HS (thick lines) for each strain. The dashed vertical line represents 5x coverage. d) Average depth of coverage in relation to the closest predicted probe binding site(s), for each of the four strains. “1 probe” and “2+ probes” indicate regions where probes are predicted to bind. Error bars denote standard deviations. Numbers above error bars indicate the number of positions across the genome in each category. Thin lines represent pre-HS data; thick lines post-HS data.
Figure 3.
Figure 3.. E. coli PanSelect enriched E. coli from human stool samples, revealing previously missed strains and transcripts.
a) Pre- and post-enrichment RAs of E. coli strains detected within 188 human stool metagenomes. Points to the left of the dashed vertical line represent strains that were not detected (n.d.) within unenriched metagenomes. Strains were identified with StrainGST (Methods). b) Observed pre- and post-HS expression levels of individual transcripts, for the set 94 pre- and post-HS metatranscriptomes with at least 1 million reads, downsampled to 1 million reads. Transcripts expressed below 10 copies per million (CPM) are classified as not detected (n.d.). Points represent clusters of transcripts expressed at similar levels, formed with hierarchical clustering. c) Strain composition of samples from four randomly chosen participants, after enrichment (top row) and before enrichment (bottom two rows). Pre-HS data is shown using the same y-axis scale as post-HS data, as well as zoomed in to see the strain composition. Strain RAs were estimated with StrainGST. Stars indicate strains that could not be detected before HS.
Figure 4.
Figure 4.. Shift towards aerobic metabolism in the rUTI gut.
a) Log fold change (x-axis) and significance (y-axis) of the differential expression (DE) of 2,182 E. coli genes between stool from healthy and rUTI women. The 4 individual genes that were significantly DE after false discovery rate correction are indicated with black outlines and labeled. dcuA, which was near the significance threshold, is also labeled. Genes are colored by inclusion in the global FNR+ and ArcA- regulons. b) Distribution of fold-changes for genes in each of the 22 gene sets (KEGG pathways/modules or regulons) significantly enriched among under- or over-expressed genes (Supplementary Table 12). Gene sets are colored by enrichment among over- (red) or under-expressed genes (blue) and are grouped by metabolic function. c) Network diagram showing the interconnectedness of the DE gene sets, colored according to up- or down-regulation as in b).
Figure 5.
Figure 5.
Overview of transcriptional responses that typify E. coli in healthy (blue) versus rUTI (red) guts.

References

    1. Foxman B. (2002). Epidemiology of urinary tract infections: incidence, morbidity, and economic costs. Am. J. Med. 113 Suppl 1A, 5S–13S. - PubMed
    1. Lancet The (2018). Balancing treatment with resistance in UTIs. Lancet 391, 1966. - PubMed
    1. Mediavilla J.R., Patrawalla A., Chen L., Chavda K.D., Mathema B., Vinnard C., Dever L.L., and Kreiswirth B.N. (2016). Colistin- and Carbapenem-Resistant Escherichia coli Harboring mcr-1 and blaNDM-5, Causing a Complicated Urinary Tract Infection in a Patient from the United States. MBio 7. 10.1128/mBio.01191-16. - DOI - PMC - PubMed
    1. Ajiboye R.M., Solberg O.D., Lee B.M., Raphael E., Debroy C., and Riley L.W. (2009). Global spread of mobile antimicrobial drug resistance determinants in human and animal Escherichia coli and Salmonella strains causing community-acquired infections. Clin. Infect. Dis. 49, 365–371. - PubMed
    1. Karlowsky J.A., Hoban D.J., Decorby M.R., Laing N.M., and Zhanel G.G. (2006). Fluoroquinolone-resistant urinary isolates of Escherichia coli from outpatients are frequently multidrug resistant: results from the North American Urinary Tract Infection Collaborative Alliance-Quinolone Resistance study. Antimicrob. Agents Chemother. 50, 2251–2254. - PMC - PubMed

Publication types