

This is a preprint.
MVComp toolbox: MultiVariate Comparisons of brain MRI features accounting for common information across metrics
- PMID: 38463982
- PMCID: PMC10925263
- DOI: 10.1101/2024.02.27.582381
MVComp toolbox: MultiVariate Comparisons of brain MRI features accounting for common information across metrics
Abstract
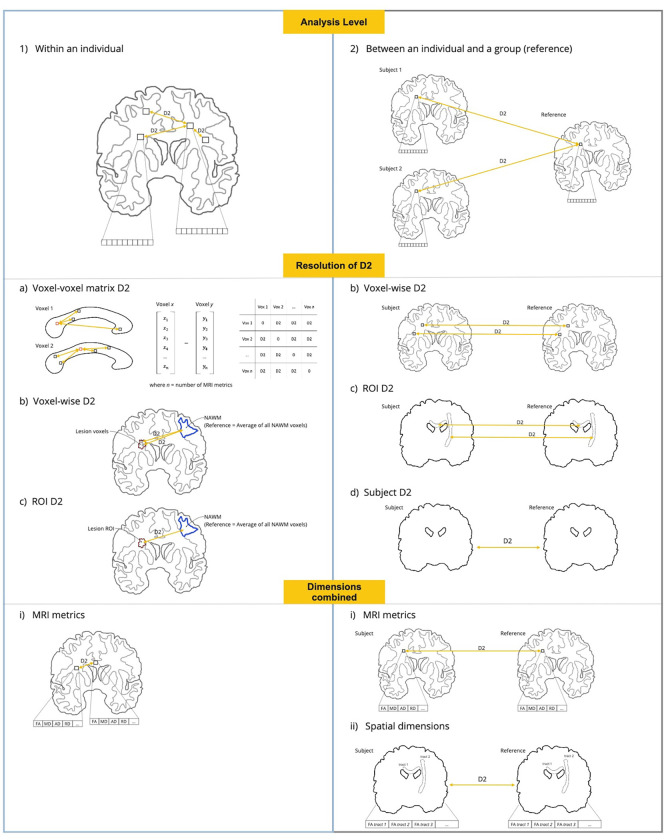
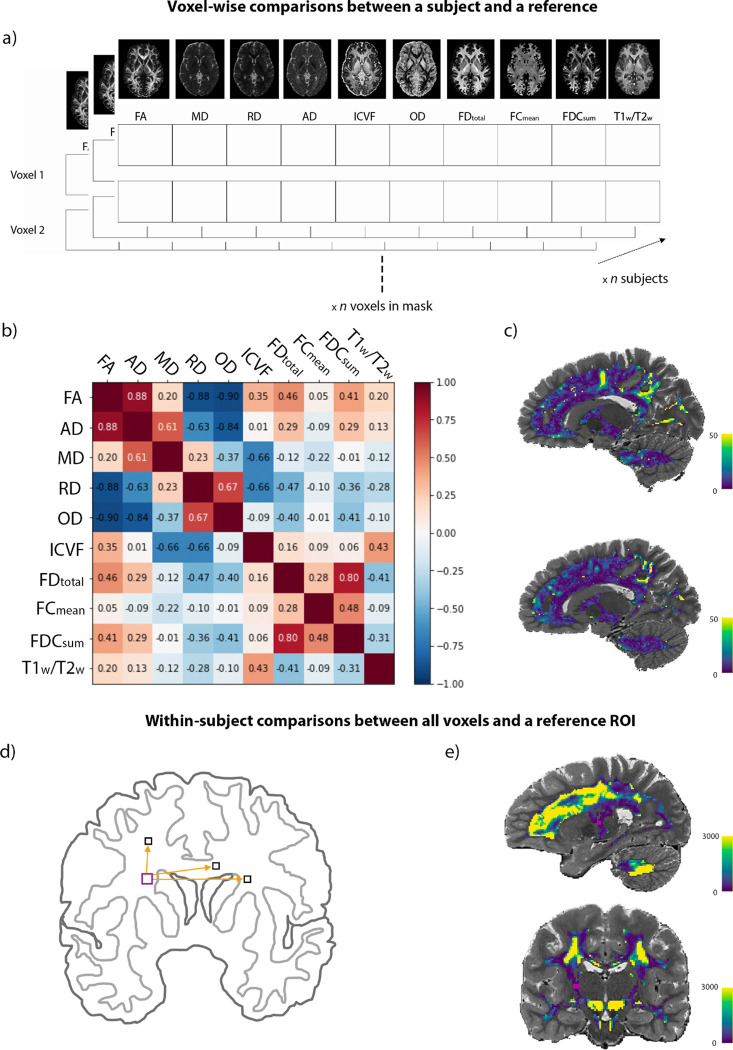
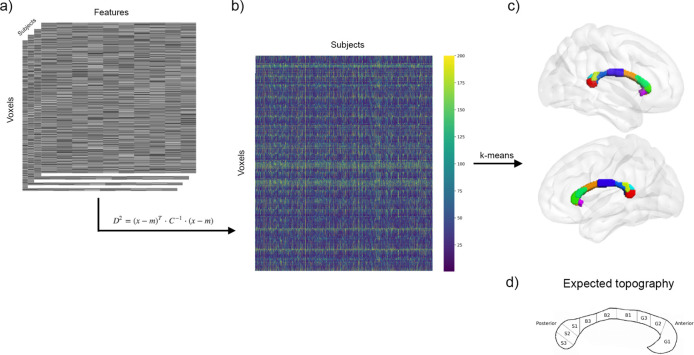
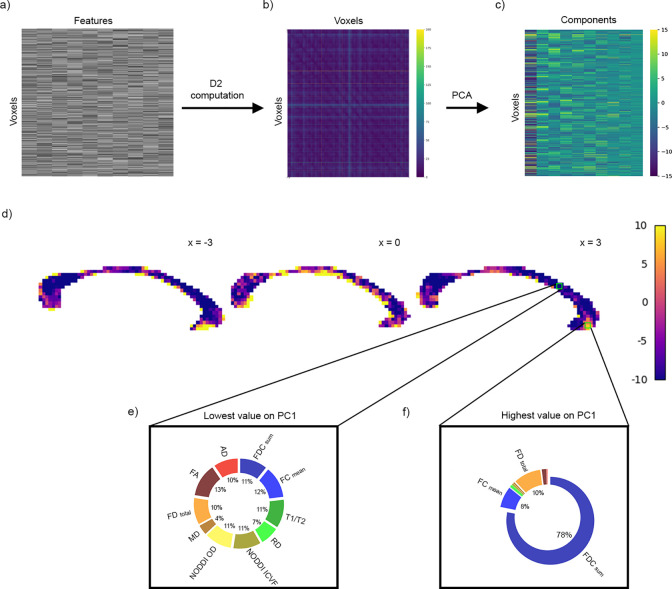
Multivariate approaches have recently gained in popularity to address the physiological unspecificity of neuroimaging metrics and to better characterize the complexity of biological processes underlying behavior. However, commonly used approaches are biased by the intrinsic associations between variables, or they are computationally expensive and may be more complicated to implement than standard univariate approaches. Here, we propose using the Mahalanobis distance (D2), an individual-level measure of deviation relative to a reference distribution that accounts for covariance between metrics. To facilitate its use, we introduce an open-source python-based tool for computing D2 relative to a reference group or within a single individual: the MultiVariate Comparison (MVComp) toolbox. The toolbox allows different levels of analysis (i.e., group- or subject-level), resolutions (e.g., voxel-wise, ROI-wise) and dimensions considered (e.g., combining MRI metrics or WM tracts). Several example cases are presented to showcase the wide range of possible applications of MVComp and to demonstrate the functionality of the toolbox. The D2 framework was applied to the assessment of white matter (WM) microstructure at 1) the group-level, where D2 can be computed between a subject and a reference group to yield an individualized measure of deviation. We observed that clustering applied to D2 in the corpus callosum yields parcellations that highly resemble known topography based on neuroanatomy, suggesting that D2 provides an integrative index that meaningfully reflects the underlying microstructure. 2) At the subject level, D2 was computed between voxels to obtain a measure of (dis)similarity. The loadings of each MRI metric (i.e., its relative contribution to D2) were then extracted in voxels of interest to showcase a useful option of the MVComp toolbox. These relative contributions can provide important insights into the physiological underpinnings of differences observed. Integrative multivariate models are crucial to expand our understanding of the complex brain-behavior relationships and the multiple factors underlying disease development and progression. Our toolbox facilitates the implementation of a useful multivariate method, making it more widely accessible.
Keywords: Multivariate analysis; covariance; personalized assessment; python; toolbox; white matter.
Conflict of interest statement
Declaration of Competing Interests The authors have no competing interests to declare.
Figures
Similar articles
-
MIDAS: Regionally linear multivariate discriminative statistical mapping.Neuroimage. 2018 Jul 1;174:111-126. doi: 10.1016/j.neuroimage.2018.02.060. Epub 2018 Mar 7. Neuroimage. 2018. PMID: 29524624 Free PMC article.
-
NeuroPycon: An open-source python toolbox for fast multi-modal and reproducible brain connectivity pipelines.Neuroimage. 2020 Oct 1;219:117020. doi: 10.1016/j.neuroimage.2020.117020. Epub 2020 Jun 6. Neuroimage. 2020. PMID: 32522662
-
Why diffusion tensor MRI does well only some of the time: variance and covariance of white matter tissue microstructure attributes in the living human brain.Neuroimage. 2014 Apr 1;89(100):35-44. doi: 10.1016/j.neuroimage.2013.12.003. Epub 2013 Dec 14. Neuroimage. 2014. PMID: 24342225 Free PMC article.
-
The Dmipy Toolbox: Diffusion MRI Multi-Compartment Modeling and Microstructure Recovery Made Easy.Front Neuroinform. 2019 Oct 15;13:64. doi: 10.3389/fninf.2019.00064. eCollection 2019. Front Neuroinform. 2019. PMID: 31680924 Free PMC article.
-
Mahalanobis distance tractometry (MaD-Tract) - a framework for personalized white matter anomaly detection applied to TBI.Neuroimage. 2022 Oct 15;260:119475. doi: 10.1016/j.neuroimage.2022.119475. Epub 2022 Jul 14. Neuroimage. 2022. PMID: 35840117 Free PMC article.
References
-
- Azzarito M., Emmenegger T. M., Ziegler G., Huber E., Grabher P., Callaghan M. F., Thompson A., Friston K., Weiskopf N., Killeen T., & Freund P. (2023). Coherent, time-shifted patterns of microstructural plasticity during motor-skill learning. NeuroImage, 274, 120128. 10.1016/j.neuroimage.2023.120128 - DOI - PubMed
Publication types
Grants and funding
LinkOut - more resources
Full Text Sources