[Preprint]. 2024 Feb 29:2024.02.27.582310.
doi: 10.1101/2024.02.27.582310.

Functional overlap between the mammalian Sar1a and Sar1b paralogs in vivo

Affiliations

Functional overlap between the mammalian Sar1a and Sar1b paralogs in vivo

Vi T Tang et al. bioRxiv. .

Update in

  • Functional overlap between the mammalian Sar1a and Sar1b paralogs in vivo.
    Tang VT, Xiang J, Chen Z, McCormick J, Abbineni PS, Chen XW, Hoenerhoff M, Emmer BT, Khoriaty R, Lin JD, Ginsburg D. Tang VT, et al. Proc Natl Acad Sci U S A. 2024 May 7;121(19):e2322164121. doi: 10.1073/pnas.2322164121. Epub 2024 Apr 30. Proc Natl Acad Sci U S A. 2024. PMID: 38687799 Free PMC article.

Abstract

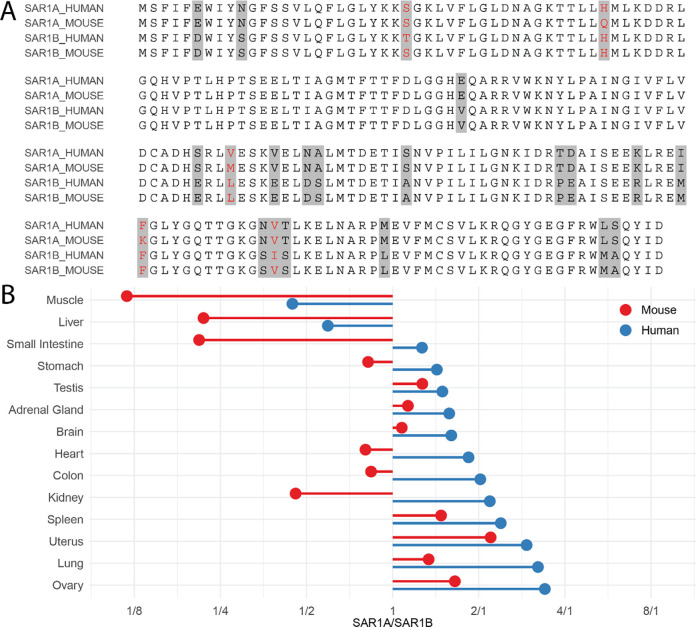
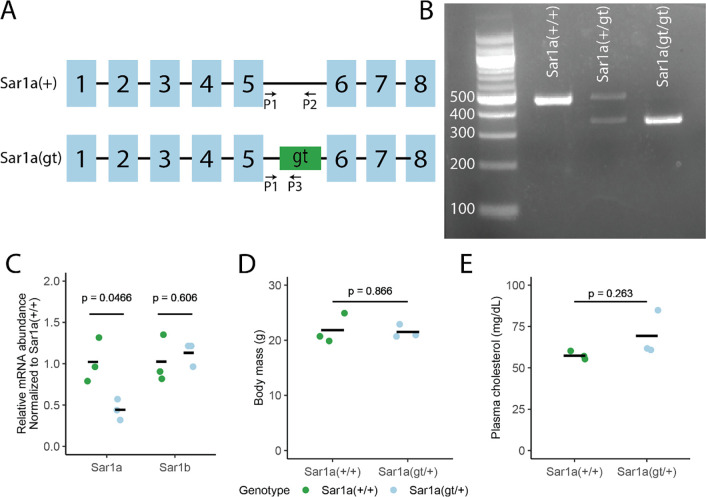
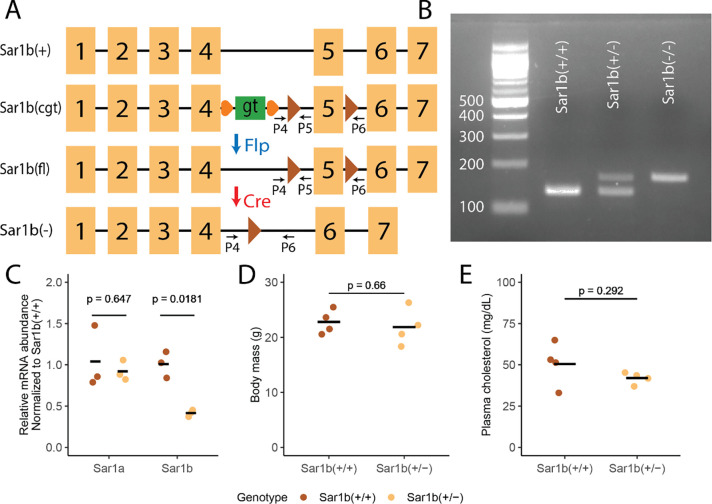
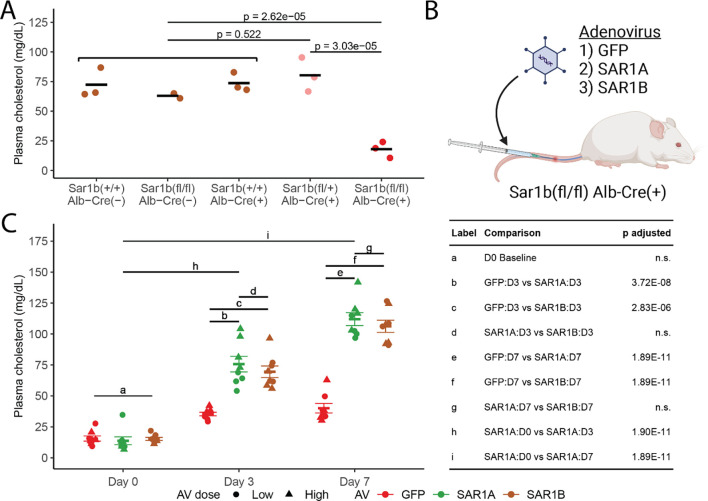
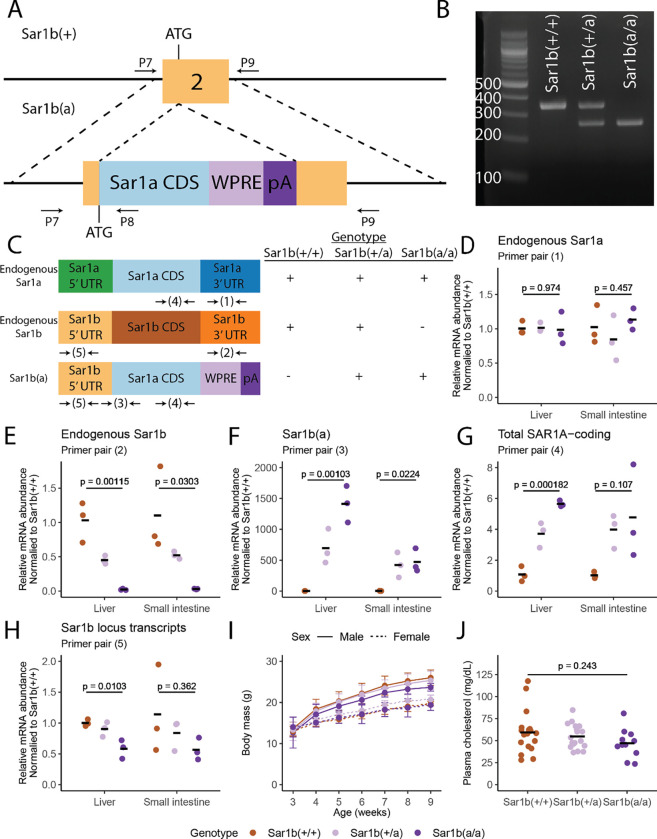
Proteins carrying a signal peptide and/or a transmembrane domain enter the intracellular secretory pathway at the endoplasmic reticulum (ER) and are transported to the Golgi apparatus via COPII vesicles or tubules. SAR1 initiates COPII coat assembly by recruiting other coat proteins to the ER membrane. Mammalian genomes encode two SAR1 paralogs, SAR1A and SAR1B. While these paralogs exhibit ~90% amino acid sequence identity, it is unknown whether they perform distinct or overlapping functions in vivo. We now report that genetic inactivation of Sar1a in mice results in lethality during mid-embryogenesis. We also confirm previous reports that complete deficiency of murine Sar1b results in perinatal lethality. In contrast, we demonstrate that deletion of Sar1b restricted to hepatocytes is compatible with survival, though resulting in hypocholesterolemia that can be rescued by adenovirus-mediated overexpression of either SAR1A or SAR1B. To further examine the in vivo function of these 2 paralogs, we genetically engineered mice with the Sar1a coding sequence replacing that of Sar1b at the endogenous Sar1b locus. Mice homozygous for this allele survive to adulthood and are phenotypically normal, demonstrating complete or near-complete overlap in function between the two SAR1 protein paralogs in mice. These data also suggest upregulation of SAR1A gene expression as a potential approach for the treatment of SAR1B deficiency (chylomicron retention disease) in humans.


Figures

Figure 1.
Figure 1.. SAR1A and SAR1B are highly conserved proteins ubiquitously expressed but at variable levels across mouse and human tissues.
(A) Protein sequence alignment of human and mouse SAR1A (NP_001136120.1 and NP_001345416.1) and SAR1B (NP_001028675.1 and NP_079811.1). Amino acid residues that differ between SAR1A and SAR1B are highlighted in grey and residues that are different between mouse and human are colored in red. (B) Relative SAR1A and SAR1B mRNA expression in multiple human and mouse tissues. The x-axis represents SAR1A/SAR1B mRNA abundance ratio in each tissue. Raw RNA-sequencing data were obtained from (17, 18).
Figure 2.
Figure 2.. Haploinsufficiency of SAR1A is tolerated in mice.
(A) Schematic of the wild type Sar1a(+) and gene trap Sar1a(gt) alleles The gene trap cassette is inserted into intron 5 of the Sar1a gene. P1, P2, P3 denote the binding sites of genotyping primers. Rectangles represent exons and solid line segments represent introns. Exons and introns are not drawn to scale. (B) Genotyping assay using the primers denoted in (A) and genomic DNA isolated from embryonic yolk sacs. The Sar1a(+) allele produces a PCR amplicon of 489 bp whereas the Sar1a(gt) allele produces an amplicon of 352 bp. (C) Liver Sar1a and Sar1b mRNA abundance in Sar1agt/+ and littermate controls determined by qPCR (normalized to the level of Sar1a+/+ samples). (D-E) Body mass and plasma cholesterol levels of wild type and heterozygous Sar1agt/+ mice. For panels (C-E) Statistical significance was determined by two-sided t-test.
Figure 3.
Figure 3.. Mice with heterozygous loss of Sar1b demonstrate normal growth and plasma cholesterol levels.
(A) Schematic of the wild-type Sar1b(+), condition gene trap Sar1b(cgt), conditional Sar1b(fl) and the null Sar1b(−) alleles. The gene trap (gt) cassette is inserted into intron 4 of the Sar1b gene. Orange circles represent the two FRT sites flanking the gene trap cassette. The Flp recombinase excises the gene trap cassette, resulting in the Sar1b(fl) allele. In the Sar1b(fl) allele, exon 5 of the Sar1b gene is flanked by two loxP sites (brown triangles), which undergo recombination in the presence of Cre recombinase, leading to excision of exon 5 in the Sar1b(−) allele. P4, P5, P6 denote the binding sites of genotyping primers. Rectangles represent exons and solid line segments represent introns. Exons and introns are not drawn to scale. (B) Genotyping assay using primers denoted in (A) and genomic DNA isolated from tail clips. The Sar1b(+) allele generates a PCR product of 136 bp whereas the Sar1b(−) allele produces a PCR amplicon of 169 bp. (C) Relative liver Sar1a and Sar1b mRNA abundance in Sar1b+/− mice and littermate controls determined by qPCR (normalized to the mean level of Sar1b+/+ samples). (D-E) Body mass and plasma cholesterol levels of wild type and heterozygous Sar1b+/− mice. For panels (C-E), statistical significance was determined by two-sided t-test.
Figure 4:
Figure 4:. Hypocholesterolemia in hepatic SAR1B deficient mice is rescued by overexpression of either SAR1A or SAR1B.
(A) Plasma cholesterol levels in controls (Sar1b+/+ Alb-Cre, Sar1bfl/fl Alb-Cre, and Sar1b+/+ Alb-Cre+ – brown), hepatic Sar1b haploinsufficient (Sar1bfl/+ Alb-Cre+ – pink), and hepatic Sar1b null (Sar1bfl/fl Alb-Cre+ – red) mice. Statistical significance was determined by pairwise two-sided t-test followed by Bonferroni adjustment for multiple hypothesis testing. (B) Schematic of SAR1B deficiency rescue experiment. Sar1bfl/fl Alb-Cre+ mice were injected with adenovirus (AV) expressing GFP, mouse SAR1A, or mouse SAR1B via the tail vein. Blood was sampled on day 0, 3, and 7 post-injection and assayed for cholesterol levels. (C) Plasma cholesterol levels of mice injected with AV as illustrated in (B). Two different AV doses were used (Low and High—see Methods; n = 4 per dose per AV). Statistical significance was determined by Two-way ANOVA test with interaction between AV type, time, and dose followed by Tukey’s post-hoc test. P-values for the labelled comparisons are listed in the table on the right; n.s., not significant. p-values for all comparisons are listed in Table S1.
Figure 5:
Figure 5:. SAR1A expressed under control of the Sar1b endogenous locus can compensate for complete loss of SAR1B.
(A) Schematic of the Sar1b(a) allele. Dashed lines mark the homology arms for DNA recombination. Exons and introns are not drawn to scale. CDS, coding sequence; WPRE, woodchuck hepatitis virus post-transcriptional regulatory element; pA, polyA sequence. P7, P8, P9 denote binding sites for genotyping primers. (B) Genotyping assay using primers depicted in (A) with genomic DNA isolated from tail clips. The wild type Sar1b(+) allele is expected to produce a PCR product of 358 bp (primer pair P7 and P9) whereas the Sar1b(a) allele generates a PCR amplicon of 268 bp (primer pair P7 and P8). (C) Schematic of the endogenous Sar1a, endogenous Sar1b, and Sar1b(a) transcript. The table on the right shows whether each transcript is present in the indicated genotype. Each number (with arrows on either side) below the transcript represents a particular primer pair used for detecting that transcript by qPCR. Primer pairs (1)-(3) are specific for each of the endogenous Sar1a, endogenous Sar1b, and Sar1b(a) transcript, respectively. Primer pair (4) amplifies both the endogenous Sar1a and Sar1b(a) transcripts (Total SAR1A-coding). Primer pair (5) amplifies both the endogenous Sar1b and Sar1b(a) transcripts (Sar1b locus transcript). (D-H) Relative abundance for transcripts as determined by qPCR using the primers illustrated in (C) (normalized to the mean level of Sar1b+/+ samples) in livers and small intestines collected from Sar1b+/+, Sar1b+/a, and Sar1ba/a littermates. Statistical significance was determined by a one-way ANOVA test. (I) Body mass of male and female offspring from Sar1b+/a X Sar1b+/a intercrosses between 3 and 9 weeks of age (n = 23, 35, and 6 for from Sar1b+/+, Sar1b+/a, and Sar1ba/a, respectively; error bars represent the standard deviation for each group). (J) Plasma cholesterol levels of Sar1b+/+, Sar1b+/a, and Sar1ba/a mice at 3–4 months of age. Statistical significance was determined by a one-way ANOVA test.

Similar articles

References

    1. Zanetti G., Pahuja K. B., Studer S., Shim S., Schekman R., COPII and the regulation of protein sorting in mammals. Nat Cell Biol 14, 20–28 (2011). - PubMed
    1. Barlowe C., Helenius A., Cargo Capture and Bulk Flow in the Early Secretory Pathway. Annu Rev Cell Dev Biol 32, 197–222 (2016). - PubMed
    1. Peotter J., Kasberg W., Pustova I., Audhya A., COPII-mediated trafficking at the ER/ERGIC interface. Traffic 20, 491--503 (2019). - PMC - PubMed
    1. Novick P., Field C., Schekman R., Identification of 23 complementation groups required for post-translational events in the yeast secretory pathway. Cell 21, 205–215 (1980). - PubMed
    1. Barlowe C. et al., COPII: a membrane coat formed by Sec proteins that drive vesicle budding from the endoplasmic reticulum. Cell 77, 895--907 (1994). - PubMed

Publication types