[Preprint]. 2024 Aug 7:2024.02.26.581612.
doi: 10.1101/2024.02.26.581612.

A Curated Compendium of Transcriptomic Data for the Exploration of Neocortical Development

Affiliations

A Curated Compendium of Transcriptomic Data for the Exploration of Neocortical Development

Shreyash Sonthalia et al. bioRxiv. .

Abstract

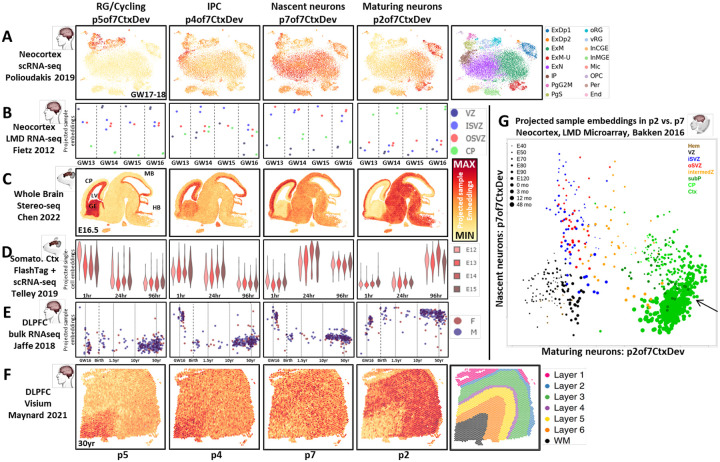
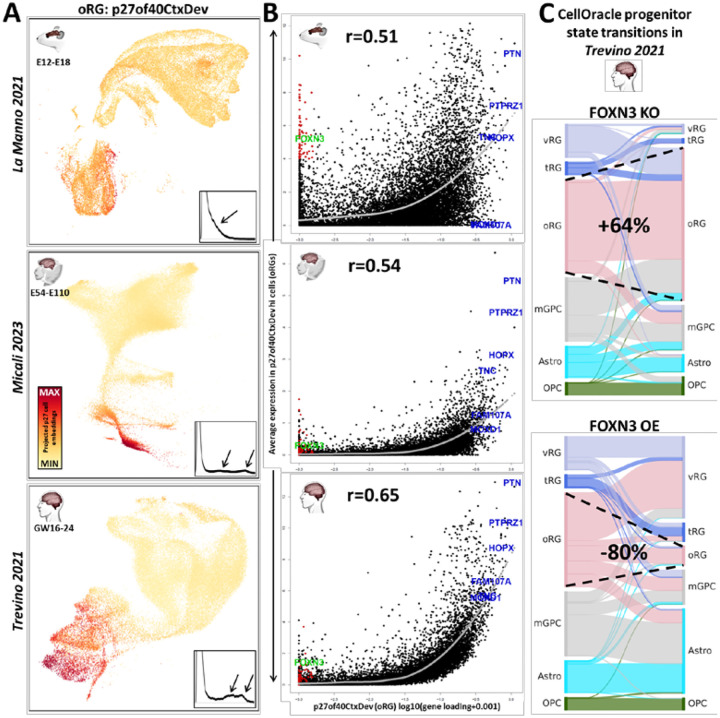
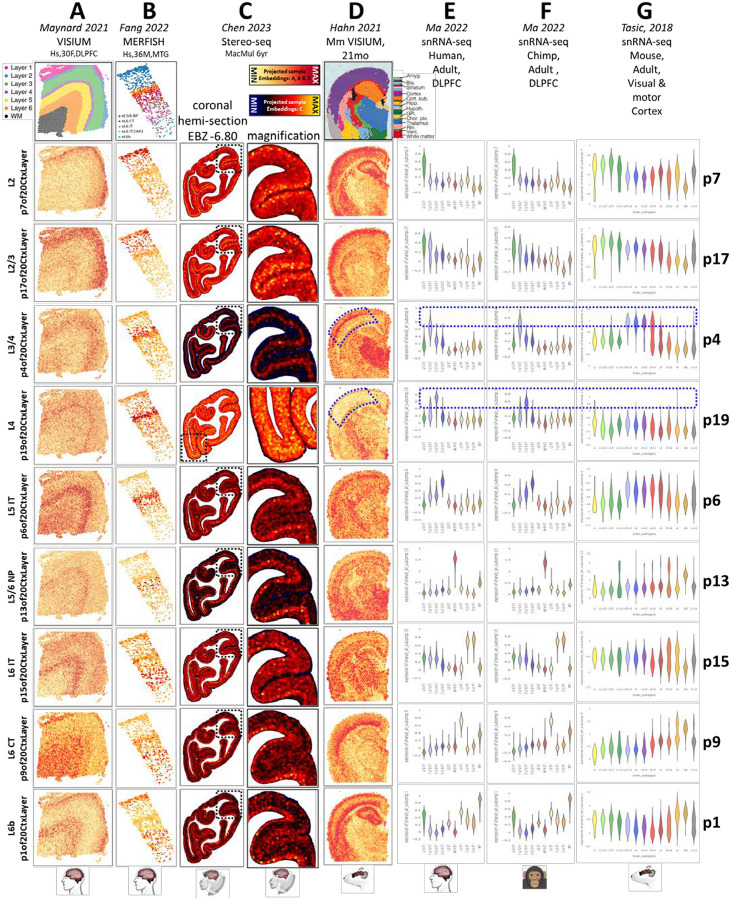
Vast quantities of multi-omic data have been produced to characterize the development and diversity of cell types in the cerebral cortex of humans and other mammals. To more fully harness the collective discovery potential of these data, we have assembled gene-level transcriptomic data from 188 published studies of neocortical development, including the transcriptomes of ~30 million single-cells, extensive spatial transcriptomic experiments and RNA sequencing of sorted cells and bulk tissues: nemoanalytics.org/landing/neocortex. Applying joint matrix decomposition (SJD) to mouse, macaque and human data in this collection, we defined transcriptome dynamics that are conserved across mammalian neurogenesis and which elucidate the evolution of outer, or basal, radial glial cells. Decomposition of adult human neocortical data identified layer-specific signatures in mature neurons and, in combination with transfer learning methods in NeMO Analytics, enabled the charting of their early developmental emergence and protracted maturation across years of postnatal life. Interrogation of data from cerebral organoids demonstrated that while broad molecular elements of in vivo development are recapitulated in vitro, many layer-specific transcriptomic programs in neuronal maturation are absent. We invite computational biologists and cell biologists without coding expertise to use NeMO Analytics in their research and to fuel it with emerging data (carlocolantuoni.org).


Figures

Figure 1:
Figure 1:. Joint decomposition of scRNA-seq data in mouse, macaque and human neocortical neurogenesis.
A] Schematic of NeMO Analytics data resources employed in conjunction with joint decomposition and transfer learning approaches. This is an outline of specific analyses in this report as well as a description of a general approach we invite others to take on. Analysis-ready datasets and detailed sample metadata can be downloaded from NeMO Analytics and analyzed offline. Elements learned from joint decomposition can then be uploaded to NeMO Analytics to explore their dynamics across the broad data collection. In this flow, the offline analysis could be any exploratory technique applied to mutli-omics data matrices that produces gene signatures in the form of simple lists or quantitative loadings, e.g. PCA, clustering, or differential expression analysis. B] Assembled screen captures from the online NeMO Analytics multi-omic data exploration environment, displaying UMAP representations of scRNA-seq datasets spanning mid-gestational excitatory neocortical neurogenesis in mouse (PMID: 34321664), macaque (PMID: 37824652) and human (PMID: 34390642) development colored by consensus MetaMarker analysis (legend in left-most column). Single-cell embeddings for each of 4 jointNMF patterns selected from a set of 7 (p7CtxDev, Figure S1 and NeMOlink03), displayed as color gradients across UMAP plots (columns to right of cell type legend). The jointNMF decomposition produces a single gene loading matrix which underlies these 3 sets of sample embeddings. These gene loadings are used in enrichment analyses in panel C to explore these patterns. Dashed arrows indicate approximate neurogenic trajectory in each species. Individual genes can also be explored in these datasets at NeMOlink04. C] Selected genes from the top 0.2% of the gene loadings for each pattern (Table S1 contains all loadings). Genes with highest loadings in p7of7CtxDev include pro-neural genes, while genes encoding proteins that make up physical elements of a neuron are highest in p2of7CtxDev, suggesting that p7 is a transcriptomic program dedicated to becoming a neuron, while p2 represents the neuronal state itself. Selected Gene Ontology (GO) and genetic enrichments in each pattern’s gene loadings are also listed (BOLD indicates where hits of greatest significance occur for the different phenotypes). Table S1 contains the full list of enrichments across all 7 patterns. ASD=autism spectrum disorder, SCHZ=schizophrenia, BD=bipolar disorder. D] Boxplots of cell embeddings from each of the 4 patterns separated by species, across time and further by MetaMarker-defined cell type labels.
Figure 2:
Figure 2:. Projection of datasets from the NeMO Analytics collection into transcriptomic dimensions of neocortical neurogenesis yields evolutionary and developmental insights.
Each row of panels depicts the projection of a dataset into the p7CtxDev patterns defined in Figure 1; each column is 1 of the 4 highlighted patterns. A] tSNE representation of scRNA-seq in fetal human neocortical tissue (PMID: 31303374) colored by the strength of conserved transcriptomic patterns. Original author cell type calls: Ex=exictatory, Dp=deep, N=new/migrating, M=maturing, Ip=intermediate progenitor, Pg=cycling progenitor in S or G2M phase, RG=ventricular (v) or outer (o) radial glia, In=inhibitory neurons of the medial (MGE) or caudal (CGE) ganglionic eminence, Mic=microglia, OPC=oligodendrocyte precursor cell, Per=perictye, End=endothelial cell. B] Bulk RNA-seq in laser microdissected (LMD) samples from human fetal neocortex (PMID: 22753484). Y-axis values indicate each sample’s level of the transcriptomic patterns. C] Spatial transcriptomics in the fetal mouse brain (PMID: 35512705) colored by levels of each pattern. See Figure S2C for higher resolution comparison of p2 and p7 and Figure S2F for projection across the developmental time course in this dataset. CP=cortical plate, LV=lateral ventricle, GE=ganglionic eminence, MB=midbrain, HB=hindbrain. D] scRNA-seq of RGCs labeled at E12-E15 during their terminal division on the ventricular surface at 0hr, then harvested for sequencing at 1hr, 24hr, and 96hr (PMID: 31073041). E] Bulk RNA-seq of dorsolateral prefrontal cortical (DLPFC) tissue across the human lifespan (PMID: 30050107). Age is on a transformed log scale to allow better visualization of early development where change is greatest. F] Spatial transcriptomics in the adult human dorsolateral prefrontal cortex (PMID: 33558695). G] Scatter plot of individually laser microdissected regions of the developing macaque cortex comparing levels of p2 and p7 (PMID: 27409810). Hem=cortical hem, VZ=ventricular zone, ISVZ=inner subventricular zone, OSVZ=outer subventricular zone, intermedZ=intermediate zone, subP=subplate, Ctx=Cortex. Arrow indicates mature neurons of the cortex, where p7 has descended and p2 is highest. See Figure S2A-D for this p2 vs. p7 analysis in additional datasets. With the exception additional labels and panel G, this entire figure was created from NeMO Analytics screen captures. Units resulting from projection analyses are comparable only within, not across, projected datasets. For this reason, in this report we display all data projections on a minimum to maximum scale bounded by each individual dataset projected (Methods). Expression of individual genes can be explored in these specific datasets at NeMOlink05 and the 7 jointNMF transcriptomic patterns (p7CtxDev) at NeMOlink06.
Figure 3:
Figure 3:. Higher resolution decomposition of the developing neocortical transcriptome yields insight into oRG evolution.
A] One of 40 patterns (p40CtxDev) defined in a higher resolution jointNMF decomposition of neocortical development across mouse, macaque and human: pattern p27of40CtxDev is a partially conserved transcriptomic elements of the oRG cell type across mammalian species. Single-cell embeddings for p27 are shown in a color gradient across the low-dimensional representation of cells in all 3 species. Inset plots show the distribution of p27 embeddings in each species. Arrows indicate largest deviations between mouse and NHP & human distributions. Table S2 contains gene loadings for the entire set of 40 transcriptomic patterns along with their enrichments in disease and cell biological gene lists. B] Scatter plots of p27 gene loadings against average expression in oRG cells (defined by levels of p27) in each species. oRG marker genes are shown in blue. Genes in red have low loadings in p27, but have high expression in putative mouse oRG cells - among these, FOXN3 is shown in green. The gray curve is a loess fit of the average expression of genes across the magnitude of gene loadings in this pattern. Correlations of these 2 measures are noted in each species (p<2.2e-16 in each case). C] Cell type transitions predicted by in silico FOXN3 knock-out (KO) and over-expression (OE) simulations in a CellOracle analysis which integrated scRNA-seq and scATAC-seq data from neural progenitors in Trevino 2021 (PMID: 36755098) to construct regulatory networks in the developing neocortex. Dashed lines show the expansion of the oRG cell type in FOXN3 KO and its reduction in FOXN3 OE. Images in panel A were created from NeMO Analytics screen captures. All 40 patterns can be explored across mammalian neocortical developmental data at NeMOlink08. vRG=ventricular radial glia, oRG=outer radial glia, tRG=truncated radial glia, mGPC=multipotent glial precursor cells, Astro=astrocytes, OPC=oligodendrocyte progenitor cells.
Figure 4:
Figure 4:. Mature human neocortical layer-specific neuronal transcriptome signatures across mammalian species.
Each column shows the projection of one dataset into 9 of the 20 layer-specific signatures (p20CtxLayer). Each row thus depicts the expression level of a signature across spatial A-D and single-cell E-G transcriptomic datasets from adult human, primate and mouse (PMID: 33558695, PMID: 35771910 PMID: 37442136, PMID: 37591239, PMID: 36007006, PMID: 30382198). Original author cell type calls were used. CT=corticothalamic, IT=intratelencephalic, NP=near projecting. Blue dashed annotations indicate layer 4 patterns which are conserved across all three mammals (p4) or which are primate-specific (p19). Due to heterogeneity in the p19 signal, we have magnified a different region to show this pattern in panel C. It is unclear if this heterogeneity is due to regional specificity or signal to noise variation. With the exception of additional labels, this entire figure was created from NeMO Analytics screen captures. An expansive collection of adult neocortical data at NeMO Analytics can be explored using individual genes (NeMOlink09) or these jointNMF patterns (NeMOlink10). Table S3 contains gene loadings and the full gene set enrichments across all 20 patterns.
Figure 5:
Figure 5:. Projection of fetal and postnatal neuronal snRNA-seq data into adult layer-specific neuronal transcriptome patterns (p20CtxLayer from Figure 4).
A] Projection of neuronal data from Herring 2022 (PMID: 36318921) into the p20CtxLayer patterns, displayed as color scales in UMAP dimensions and B] as strip charts with individual cell embeddings across cell types (defined by original authors) and ages. See Figure S5A for laminar specificity and maturation timing in the macaque. C] Many conventional neuronal TF marker genes for specific cortical layers peak at the earliest fetal time points observed here. With the exception of additional labels, this entire figure was created from NeMO Analytics screen captures. These and additional detailed visualizations of the p20CtxLayer jointNMF patterns across neocortical datasets can be explored in Figure S5, and specifically in the Herring 2022 data in Figure S5 and at NeMOlink11.
Figure 6:
Figure 6:. Mapping neuronal maturation and the emergence of specific laminar identities across development of the human neocortex.
Plots represent projection of snRNA-seq data from pre- and post-natal human neocortex (Ramos 2021, PMID: 36509746, including only cells in the neocortical excitatory neurogenic lineage) into transcriptomic dimensions that define neuronal birth and maturation. Each column shows data from a single donor. The X-axis in each plot maps the individual cells onto p2of7CtxDev (neuron maturation). The Y-axis maps cells onto p7of7CtxDev (proneural/nascent neurons). The color of points in each row shows the strength of one of the 9 transcriptomic programs defined in adult layer-specific neuronal data (p20CtxLayer, see Figure 4 & 5). Green arrows indicate the earliest age at which cells surpass 65% of the maximal level for each signature (Figure S6 for details). The L3/4 p4of20CtxLayer pattern emerges earlier than other upper layer neocortical neuronal identities (green box). Original author cell type calls are used. RG/AC=radial glia / astrocytes, TAC=transit amplifying cells, nIPC=neuronal intermediate progenitor cells, CPN=cortical projection neurons of different layers, SPN=subplate neurons. Additional in vivo data spanning early postnatal ages are explored in this manner in Figure S6.
Figure 7:
Figure 7:. Broad elements of in vivo development are recapitulated in vitro:
Projection of data from in vitro neural differentiation models into the p7CtxDev patterns from Figure 1 and p27of40CtxDev from Figures 2&3. Projection of the oRG transcriptomic signature, p27of40CtxDev, is shown in a different color scale, indicating that it was derived from a distinct joint decomposition than the other patterns. A] Bulk RNA-seq data from 2D in vitro differentiation of 14 hPSC lines from 5 donors. SRd=days in pluripotent self-renewal, days of neural induction in red, neuronal differentiation in blue/purple, onA=astrocyte co-culture, noA=no astrocytes in culture (PMID: 31974374). B] scRNA-seq data from pluripotency through 4 month cerebral organoids (PMID: 31619793) in a force-directed graph layout. C&D] scRNA-seq at single time points in cerebral organoid differentiation (PMID: 36179669) in UMAP plots. E] Spatial transcriptomics in a 2 month cerebral organoid (PMID: 36179669). F] scRNA-seq across 3–10 weeks of cerebral organoid differentiation in a single hPSC line using the “more directed” Xiang 2017 (PMID: 28757360) protocol from (PMID: 31996853) in a UMAP plot. Dashed lines indicate approximate neurogenic trajectories in each experiment. This in vitro transfer learning experiment examining broad elements of neurogenesis (p7CtxDev) parallels that performed in Figure 2 where in vivo data was used. Original author cell type calls were used: EB=embroid body, Cfu=corticofugal, PN=projection neurons, DL=deep layer, IN=inhibitory neuron, aRG=apical radial glia, oRG=outer radial glia, IP=intermediate progenitor. With the exception additional labels, this entire figure was created from NeMO Analytics screen captures. These transcriptomic patterns can be explored across these data and a larger collection of in vitro differentiation data at NeMOlink12 and NeMOlink13 and individual genes at NeMOlink14. Arrows indicate time points at which the expression of p5of7CtxDev and p27of40CtxDev differ - this is explored in more depth in Figure S7.
Figure 8:
Figure 8:. Mapping neuronal maturation and the emergence of specific laminar identities in hPSC-derived models of neocortical neurogenesis.
A] Projection of scRNA-seq data from an in vitro cerebral organoid time course (PMID: 31619793, including only cells in the neocortical excitatory neurogenic lineage) into transcriptomic dimensions that define neuronal birth and maturation. Each column shows data from a single time point. The X-axis in each plot maps the individual cells onto p2of7CtxDev (neuron maturation). The Y-axis maps cells onto p7or7CtxDev (proneural/nascent neurons). The color of points in each row shows the strength of one of the 9 transcriptomic programs defined in adult layer-specific neuronal data (p20CtxLayer). Green boxes indicate where specific laminar identities (p1:L6b and p13:L5/6 NP) follow trajectories similar to in vivo development, i.e. absent from early progenitors at low p7 + low p2 levels and appearing systematically in neurons at high p2 levels following a rise and fall of p7. While only data from 1 hPSC line is shown here (409b2), the 2nd line used in the Kanton 2019 (PMID: 31619793) time course study (H9) showed the specific maturation of these same 2 neuronal identities, as do additional studies (Figure S8). B] Transplantation of human cerebral organoids into the cortex of newborn rat pups elicited significant additional neuronal maturation along specific laminar trajectories over conventionally grown organoids (PMID: 36224417). Green boxes indicate where specific laminar identities follow trajectories similar to in vivo development. Transplantation appears to increase emergence of all but 2 of the layer specific maturational signatures. Paradoxically, while neurons in transplanted organoids showed much elevated levels of specific neuronal identities and p2 over their in vitro counterparts, they did not show more reduction of p7. This in vitro transfer learning experiment parallels that performed in Figure 6 that used in vivo data. Original author cell type calls were used: NeuroEctoEpi=neurectodermal and neuroepithelial states, RGC=radial glial cells, CyclingPrg=cycling neural progenitors, nIPC=neuronal intermediate progenitor cell, CtxNrn=cortical neuron.

Publication types