[Preprint]. 2024 Feb 27:2024.02.23.581761.
doi: 10.1101/2024.02.23.581761.

The Mayo Clinic Salivary Tissue-Organoid Biobanking: A Resource for Salivary Regeneration Research

Affiliations

The Mayo Clinic Salivary Tissue-Organoid Biobanking: A Resource for Salivary Regeneration Research

Syed Mohammed Musheer Aalam et al. bioRxiv. .

Abstract

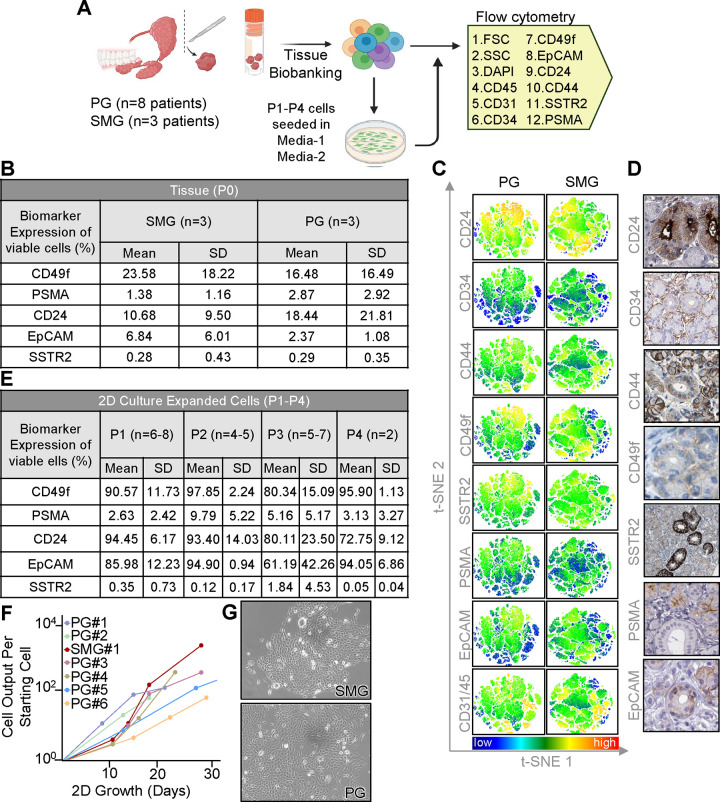
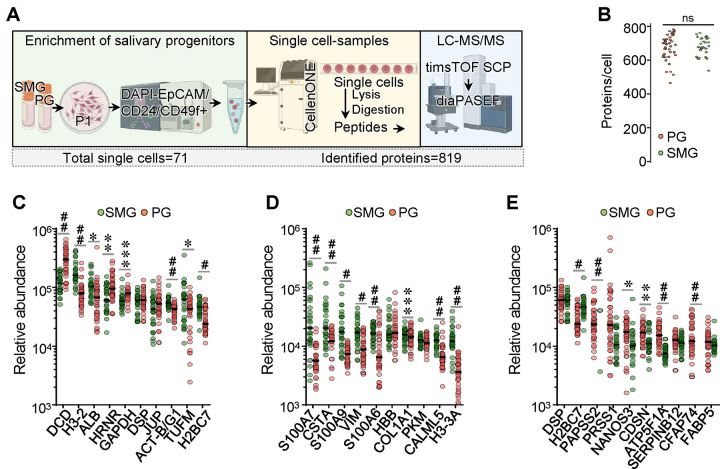
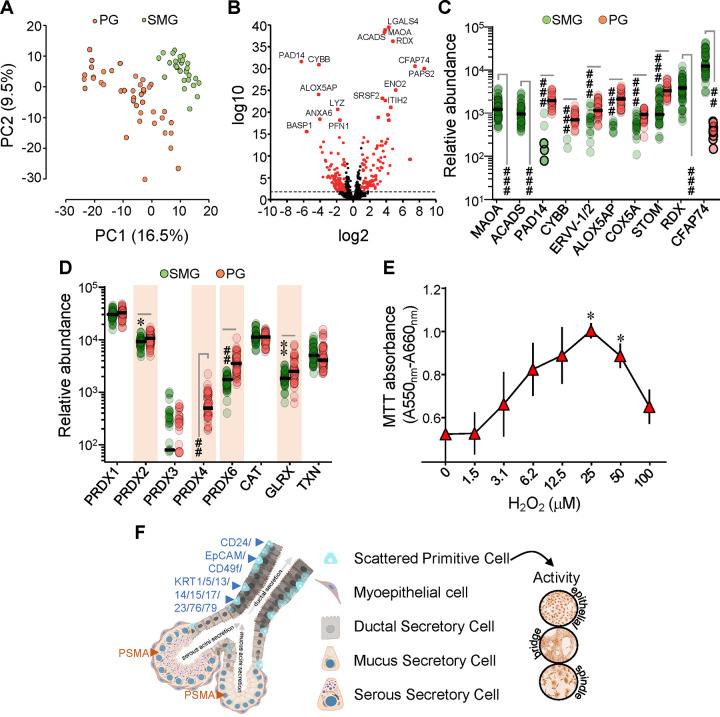
The salivary gland (SG) is an essential organ that secretes saliva, which supports versatile oral function throughout life, and is maintained by elusive epithelial stem and progenitor cells (SGSPC). Unfortunately, aging, drugs, autoimmune disorders, and cancer treatments can lead to salivary dysfunction and associated health consequences. Despite many ongoing therapeutic efforts to mediate those conditions, investigating human SGSPC is challenging due to lack of standardized tissue collection, limited tissue access, and inadequate purification methods. Herein, we established a diverse and clinically annotated salivary regenerative biobanking at the Mayo Clinic, optimizing viable salivary cell isolation and clonal assays in both 2D and 3D-matrigel growth environments. Our analysis identified ductal epithelial cells in vitro enriched with SGSPC expressing the CD24/EpCAM/CD49f+ and PSMA- phenotype. We identified PSMA expression as a reliable SGSPC differentiation marker. Moreover, we identified progenitor cell types with shared phenotypes exhibiting three distinct clonal patterns of salivary differentiation in a 2D environment. Leveraging innovative label-free unbiased LC-MS/MS-based single-cell proteomics, we identified 819 proteins across 71 single cell proteome datasets from purified progenitor-enriched parotid gland (PG) and sub-mandibular gland (SMG) cultures. We identified distinctive co-expression of proteins, such as KRT1/5/13/14/15/17/23/76 and 79, exclusively observed in rare, scattered salivary ductal basal cells, indicating the potential de novo source of SGSPC. We also identified an entire class of peroxiredoxin peroxidases, enriched in PG than SMG, and attendant H2O2-dependent cell proliferation in vitro suggesting a potential role for PRDX-dependent floodgate oxidative signaling in salivary homeostasis. The distinctive clinical resources and research insights presented here offer a foundation for exploring personalized regenerative medicine.

Keywords: 3D-Matrigel Organoid; Biobanking; Cancer Treatment Side Effects; Oral Toxicities; Parotid Gland; Patient-Derived Tissue-Organoid Technology; Salivary Gland; Salivary Progenitors; Submandibular Gland.


Conflict of interest statement

Conflict of Interest statement: All the co-authors declare that there is no conflict of interest in relation to the work described.

Figures

Figure 1.
Figure 1.. Salivary Tissue-Organoid Biobanking Preserves Primitive Salivary Cells.
A) Schematic workflow outlining the steps involved in the processing of PG and SMG tissues to generate tissue organoids, as well as their cryopreservation and biobanking from living or deceased male and female donors. B) H&E staining of SMG and PG tissues and their corresponding tissue organoids show characteristic ductal and acinar structures (100x magnification). C) Plot showing the age distribution among PG and SMG donors, considering both living and deceased individuals of both genders in the biobank. D) Plot depicting the weight distribution of PG and SMG tissues received at the laboratory, considering both living and deceased donors of both genders E) Plot illustrating the quantity of patient-derived tissue-organoid cryovials obtained from PG and SMG tissue masses received at the laboratory, considering both living and deceased donors of both genders. F) Bar plot illustrating the distribution of PG and SMG tissue organoids in the biobank, considering donors from both living and deceased individuals of both genders. G) Representative brightfield images of cultured SMG and PG cells isolated from respective cryopreserved tissue-organoids (100x magnification). H) Representative brightfield images of SMG and PG organoids cultured in 3D-matrigel (40x and 100x magnification) derived in culture following dissociation of respective tissue organoids. I) Representative immunofluorescence staining of 3D-matrigel-derived PG organoids with DAPI, Aquaporin 5, NKCC1, SMA, KRT5, KRT7, KRT8 and KRT14 antibodies. J) Plot showing 3D OIC frequency from cryopreserved salivary gland tissue organoids.
Figure 2.
Figure 2.. Immunophenotypic Analysis of Salivary Tissue-Organoids.
A) Experimental design of FACS-based characterization of cryopreserved salivary gland tissue and culture-expanded salivary cells derived from previously cryopreserved tissue. B) FACS-based biomarker characterization of unmanipulated salivary gland tissue. C) T-distributed stochastic neighbor embedding (t-SNE) plots and histology of PG and SMG tissue by biomarker of interest. Coloring correlates with expression intensity. Red indicates high expression, while blue signifies the absence of the cell marker expression. D) Representative immunohistochemical staining showing expression of various biomarkers in salivary glands (Source: Human Protein Atlas). E) FACS-based biomarker characterization of 2D-culture expanded cells derived from cryopreserved tissue. F) Salivary cells in culture system can be expanded through four passages. G) Brightfield image of salivary cell morphology in culture system.
Figure 3.
Figure 3.. Characterization of Salivary Progenitor Activity in 2D and 3D Assays.
A) Giemsa staining of salivary colonies obtained in 2D colony-forming cell (CFC) assay showing three distinct morphologies under the microscope. B) Plot showing the proportions of each of the three distinct colony types in 2D CFC assays when cells are plated, based on salivary gland type, immunophenotype, or in successive passages. C) Plot showing the frequency of CFC and 3D-matrigel OIC when plated based on salivary gland type, immunophenotype, or in successive passages in the 2D CFC and 3D-matrigel organoid assays. D) Brightfield microscopy images showing 3D-matrigel organoids obtained from FACS-purified CD24+ and EpCAM+ salivary cells, but not from CD24− and EpCAM− salivary cells. E) Immunophenotypic characterization of single cells obtained from 3D-matrigel organoids and 2D culture expanded cells from human patient salivary gland tissue organoids. F) Plot showing progenitor yield per starting single PG and SMG cell in culture over time. (*, **, and *** indicate p-values < 0.05, 0.005, and 0.0005, respectively. #, ##, and ### represent p-values < 5 × 10⁻⁷, 5 × 10⁻¹⁰, and 5 × 10⁻¹³, respectively).
Figure 4.
Figure 4.. PSMA is a SGSPC Differentiation Marker.
A) Design of 2D CFC and 3D-matrigel organoid Matrigel experiments to assess clonogenicity of PSMA− and PSMA+ cells. B) PSMA− cells demonstrate clonogenic capacity in 2D CFC and 3D-matrigel organoid assays, while PSMA+ cells do not. C) PSMA− cells purified from 15 salivary gland patient samples, unlike PSMA+ purified cells, generate organoids in 3D culture. D) Proposed hierarchical lineage model by which PSMA+ cells differentiate from the more primitive, stem/progenitor-like, self-renewing PSMA− cells. E) Experimental design of 2D and 3D FACS-based characterization of growing PSMA− salivary cells to gauge PSMA+ cell generation. F) PSMA− cells plated in 2D culture generate PSMA+ cells at confluence. G) 3D-matrigel organoids derived from PSMA− cells give rise to PSMA+ cells through multiple passages. H) Illustration of CpG islands in human PSMA promoter region. I) Schematic workflow of bisulfite conversion of 35 of 38 CpG, PCR and sanger sequencing of DNA obtained from SMG. J) Hypermethylation (~70%) of CpG in PSMA promoter in SMG tissue. Each circle indicates individual CpG dinucleotides. White and dark circles represent unmethylated and methylated CpG, respectively.
Figure 5.
Figure 5.. Unbiased LC-MS/MS-Based Single-Cell Proteomic Profiling of Purified Primitive Salivary Cells.
A) Overall workflow for single cell proteomics. Single cells (P1) from PG and SMG cells were isolated by FACS using DAPI-CD45-CD31-EpCAM+ immunophenotype, lysed and digested in 384-well plate using cellenONE platform. Mass spectrometry data of each single cell were acquired in diaPASEF mode using the timsTOF SCP mass spectrometer. A total of 819 proteins across 71 single cells were identified. B) Number of identified proteins per cell from SMG and PG P1 cultures. On average, 674 proteins and 678 proteins per single cell were identified from PG and SMG, respectively. C) A plot showing protein counts per cell, highlighting the 10 highly expressed and shared proteins within the progenitor-rich single cells of both SMG and PG. D) A plot showing protein counts per cell of 10 most abundantly detected proteins in progenitor rich cells of SMG relative to PG. E) Plot showing protein counts per cell of 10 most abundantly detected proteins in progenitor rich cells of PG relative to SMG (*, ** and *** indicate p-values < 0.05, 0.005 and 0.0005, respectively. #, ## and ### represent p-values < 5 × 10⁻⁷, 5 × 10⁻¹⁰ and 5 × 10⁻¹³, respectively).
Figure 6.
Figure 6.. Unbiased LC-MS/MS Identifies Salivary Stem/Progenitor-specific Cytokeratin Profile.
A) A plot showing the spectral counts of keratin proteins detected per individual cells (P1) from PG and SMG cells were isolated by FACS using DAPI-CD45-CD31-EpCAM+ immunophenotype enriching for SGSPC activity. B) The relationship between the keratin expression profile identified through single-cell proteomics in SGSPC and the salivary epithelial cell-type specific expression patterns in the immunohistochemistry-based map of human protein expression profiles explored through the Human Protein Atlas (https://www.proteinatlas.org/). C) SGSPC-expressed keratins map to scattered ductal basal cells in salivary glands (https://www.proteinatlas.org/). D) UMAP-based cluster analysis of mouse SMG scRNA-seq data showing salivary cell clusters. E) Dot plot showing the expression of murine analogs of human SGSPC-expressed cytokeratins (and EpCAM) across mouse salivary cell types (*, ** and *** indicate p-values < 0.05, 0.005 and 0.0005, respectively. #, ## and ### represent p-values < 5 × 10⁻⁷, 5 × 10⁻¹⁰ and 5 × 10⁻¹³, respectively).
Figure 7.
Figure 7.. Single-Cell Proteomic Profiling Reveals Floodgate Oxidative Signaling in Salivary Cells.
A) Principal component analysis of 819 proteins from SMG and PG cells. Each circle represents data from an individual single cell. B) A volcano plot showing fold-changes and adjusted p-value of proteins. Differentially expressed proteins (fold-change >2 and adjusted p-value <0.01) are marked in red. C) A plot showing top 10 differential proteins between SMG and PG salivary progenitor-rich cells. D) Antioxidant enzyme counts per individual cell, illustrating predominantly glutathione-independent peroxiredoxin system in salivary cells. E) Cellular metabolic activity in proliferative PG (P1) cells was assessed using the MTT assay, measuring absorbance changes to evaluate cell viability after treatment with varying concentrations of H2O2 over a 72-hour duration.

References

    1. Chibly A.M., Aure M.H., Patel V.N. & Hoffman M.P. Salivary gland function, development, and regeneration. Physiol Rev 102, 1495–1552 (2022). - PMC - PubMed
    1. Pedersen A.M.L., Sorensen C.E., Proctor G.B., Carpenter G.H. & Ekstrom J. Salivary secretion in health and disease. J Oral Rehabil 45, 730–746 (2018). - PubMed
    1. Mercadante V., Al Hamad A., Lodi G., Porter S. & Fedele S. Interventions for the management of radiotherapy-induced xerostomia and hyposalivation: A systematic review and meta-analysis. Oral Oncol 66, 64–74 (2017). - PubMed
    1. Taïeb D. et al. PSMA-Targeted Radionuclide Therapy and Salivary Gland Toxicity: Why Does It Matter? Journal of Nuclear Medicine 59, 747–748 (2018). - PubMed
    1. Emperumal C.P. et al. Oral Toxicities of PSMA-Targeted Immunotherapies for The Management of Prostate Cancer. Clin Genitourin Cancer (2023). - PubMed

Publication types