

This is a preprint.
Non-Coding RNAs Potentially Involved in Pyrethroid Resistance of Anopheles funestus Population in Western Kenya
- PMID: 38464038
- PMCID: PMC10925441
- DOI: 10.21203/rs.3.rs-3979432/v1
Non-Coding RNAs Potentially Involved in Pyrethroid Resistance of Anopheles funestus Population in Western Kenya
Update in
-
Metabolic resistance to pyrethroids with possible involvement of non-coding ribonucleic acids in Anopheles funestus, the major malaria vector in western Kenya.BMC Genomics. 2025 Jan 23;26(1):64. doi: 10.1186/s12864-025-11260-2. BMC Genomics. 2025. PMID: 39849377 Free PMC article.
Abstract
Backgrounds: The resurgence of Anopheles funestus, a dominant vector of human malaria in western Kenya was partly attributed to insecticide resistance. However, evidence on the molecular basis of pyrethroid resistance in western Kenya is limited. Noncoding RNAs (ncRNAs) form a vast class of RNAs that do not code for proteins and are ubiquitous in the insect genome. Here, we demonstrated that multiple ncRNAs could play a potential role in An. funestusresistance to pyrethroid in western Kenya.
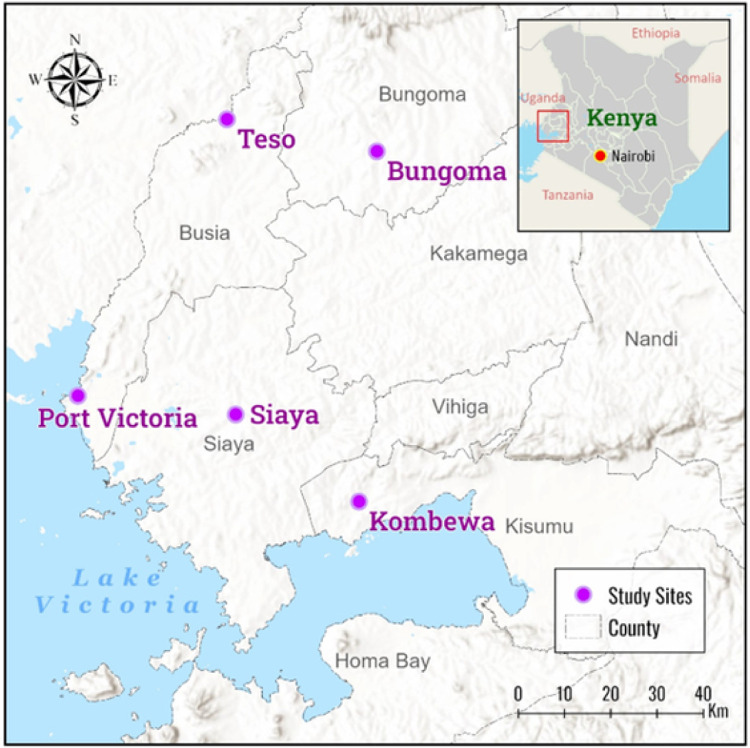
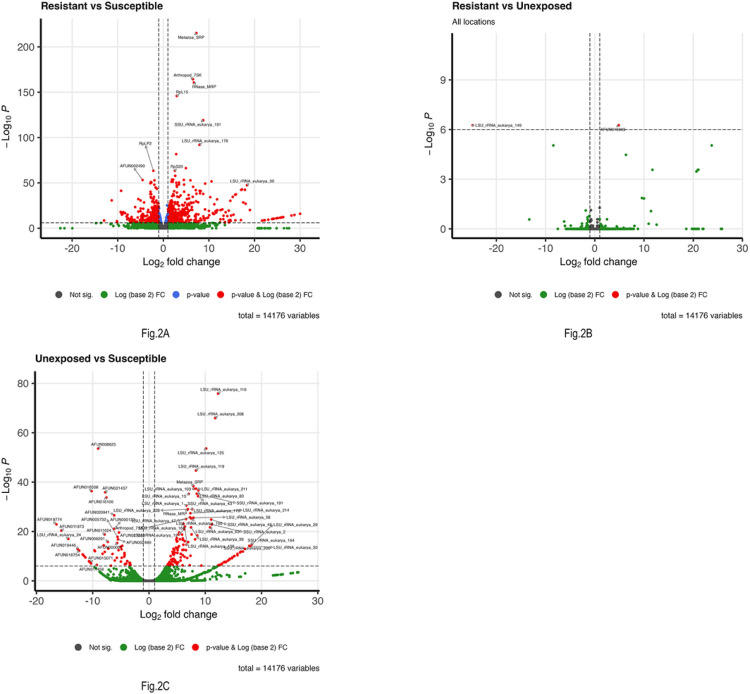
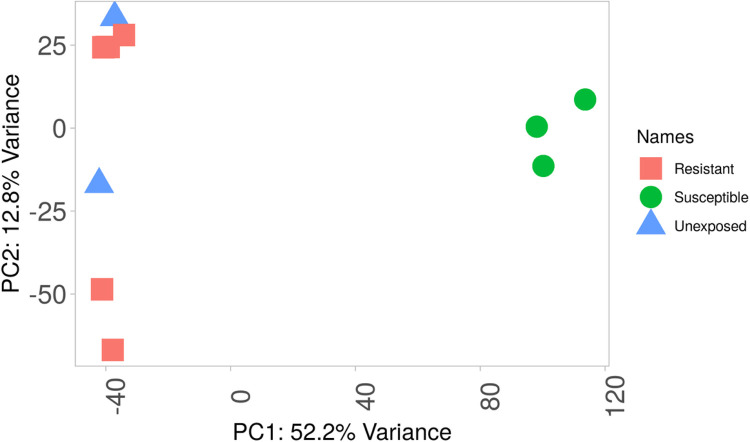
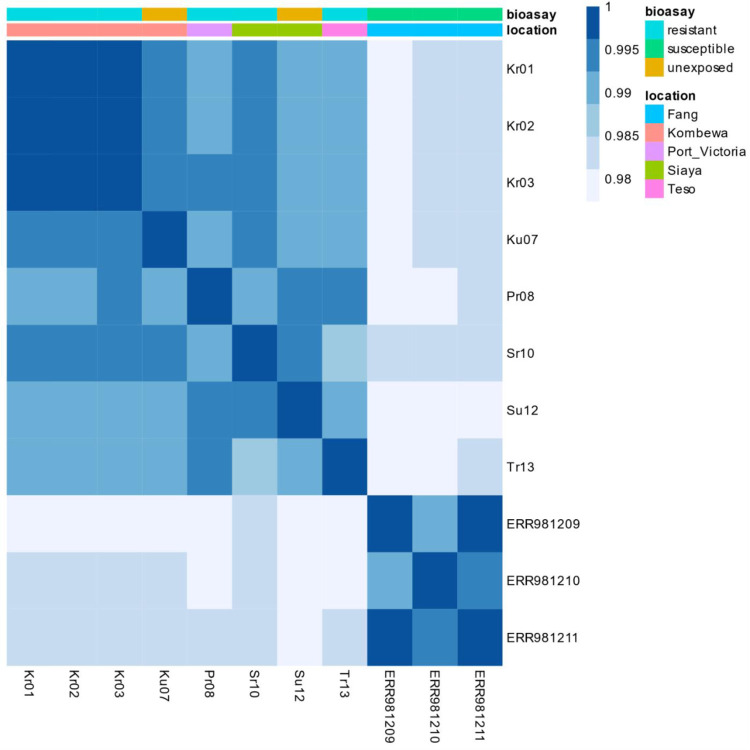
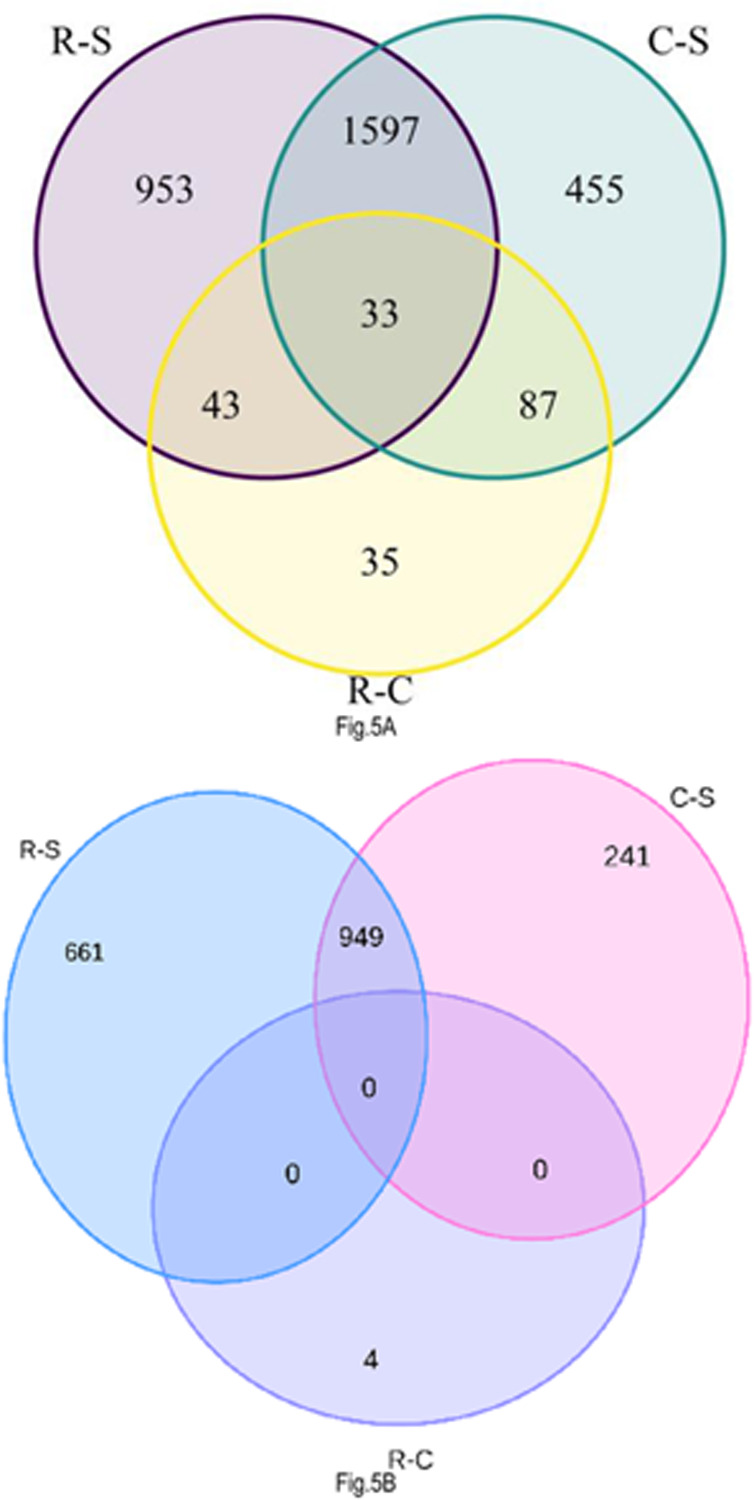
Materials and methods: Anopheles funestus mosquitoes were sampled by aspiration methods in Bungoma, Teso, Siaya, Port Victoria and Kombewa in western Kenya. The F1 progenies were exposed to deltamethrin (0.05%), permethrin (0.75%), DDT (4%) and pirimiphos-methyl (0.25%) following WHO test guidelines. A synergist assay using piperonyl butoxide (PBO) (4%) was conducted to determine cytochrome P450s' role in pyrethroid resistance. RNA-seq was conducted on a combined pool of specimens that were resistant and unexposed, and the results were compared with those of the FANG susceptible strain. This approach aimed to uncover the molecular mechanisms underlying pyrethroid resistance.
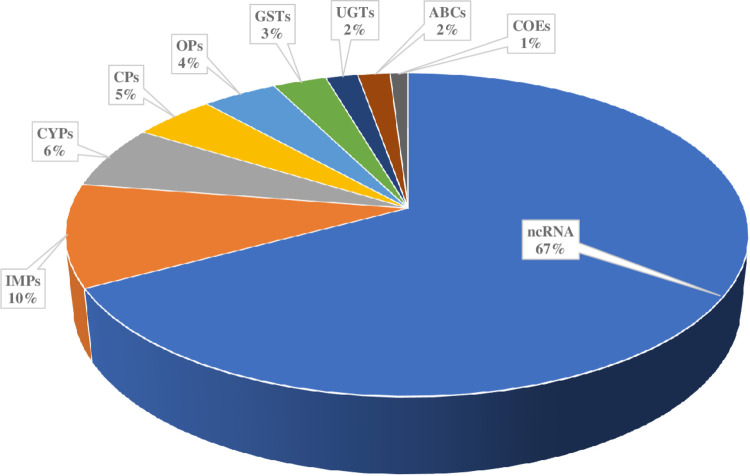
Results: Pyrethroid resistance was observed in all the sites with an average mortality rate of 57.6%. Port Victoria had the highest level of resistance to permethrin (MR=53%) and deltamethrin (MR=11%) pyrethroids. Teso had the lowest level of resistance to permethrin (MR=70%) and deltamethrin (MR=87%). Resistance to DDT was observed only in Kombewa (MR=89%) and Port Victoria (MR=85%). A full susceptibility to P-methyl (0.25%) was observed in all the sites. PBO synergist assay revealed high susceptibility (>98%) to the pyrethroids in all the sites except for Port Victoria (MR=96%, n=100). Whole transcriptomic analysis showed that most of the gene families associated with pyrethroid resistance comprised non-coding RNAs (67%), followed by imipenemase (10%), cytochrome P450s (6%), cuticular proteins (5%), olfactory proteins (4%), glutathione S-transferases (3%), UDP-glycosyltransferases (2%), ATP-binding cassettes (2%) and carboxylesterases(1%).
Conclusions: This study unveils the molecular basis of insecticide resistance in An. funestus in western Kenya, highlighting for the first time the potential role of non-coding RNAs in pyrethroid resistance. Targeting non-coding RNAs for intervention development could help in insecticide resistance management.
Keywords: Anopheles funestus; DDT; PBO; RNA-seq; insecticide resistance; non-coding RNAs; pyrethroid; western Kenya.
Conflict of interest statement
Competing interests: The authors declare no conflict of interest.
Figures
References
-
- Trape J-F, Tall A, Sokhna C, Ly AB, Diagne N, Ndiath O, et al. The rise and fall of malaria in a west African rural community, Dielmo, Senegal, from 1990 to 2012: a 22 year longitudinal study. Lancet Infect Dis. 2014;14:476–88. - PubMed
-
- O’Meara WP, Mangeni JN, Steketee R, Greenwood B. Changes in the burden of malaria in sub-Saharan Africa. Lancet Infect Dis. 2010;10:545–55. - PubMed
Publication types
Grants and funding
LinkOut - more resources
Full Text Sources
Miscellaneous
