[Preprint]. 2024 Mar 1:2024.02.26.582108.
doi: 10.1101/2024.02.26.582108.

CAR-engineered lymphocyte persistence is governed by a FAS ligand/FAS auto-regulatory circuit

Affiliations

CAR-engineered lymphocyte persistence is governed by a FAS ligand/FAS auto-regulatory circuit

Fei Yi et al. bioRxiv. .

Update in

Abstract

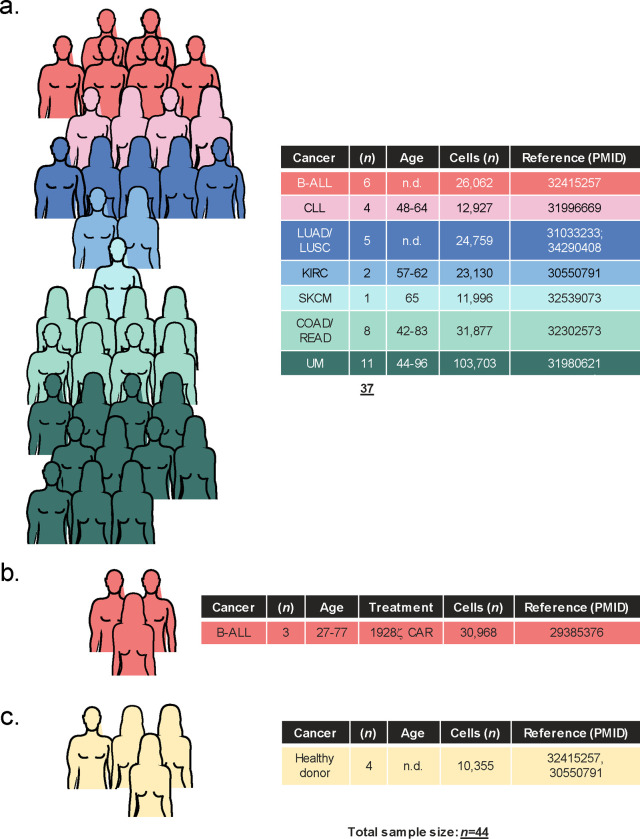
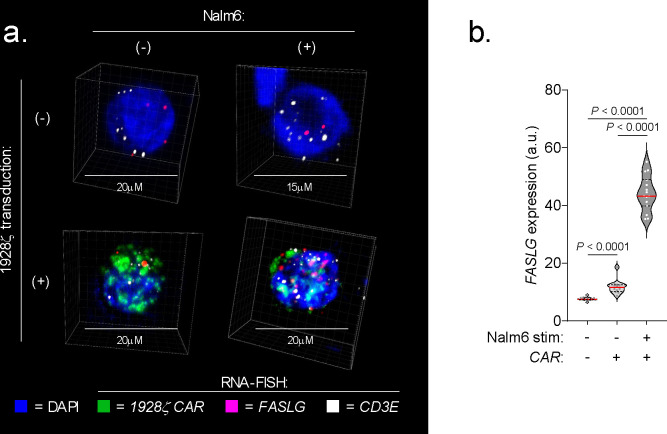
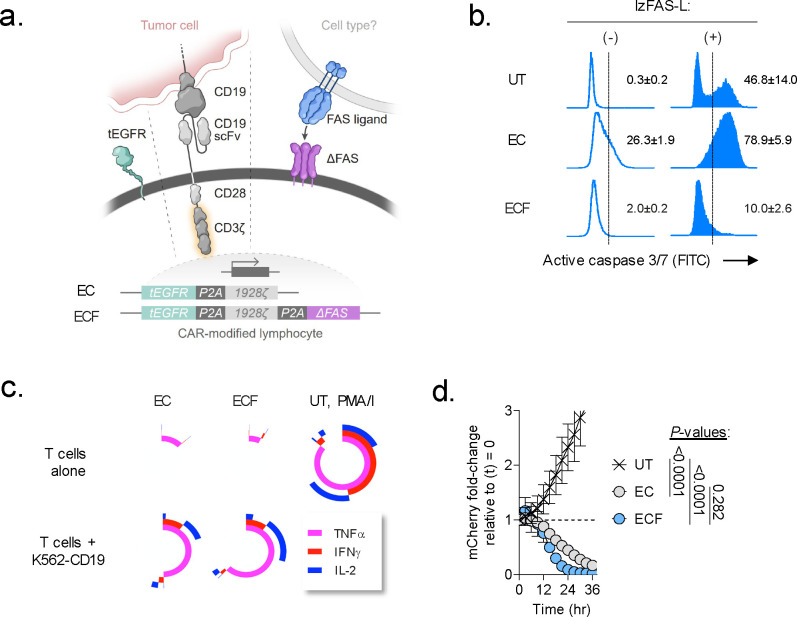
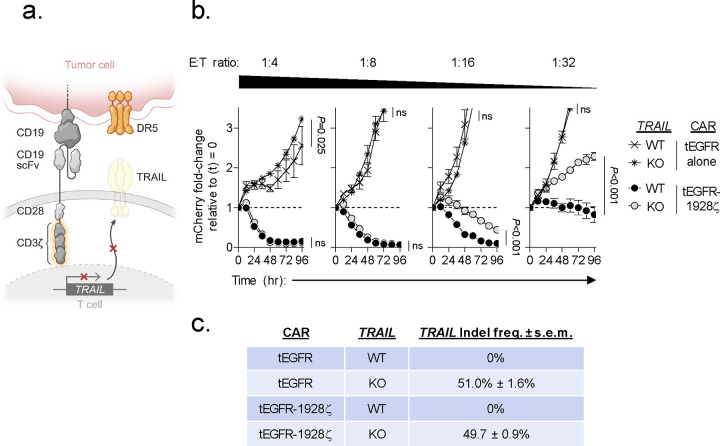
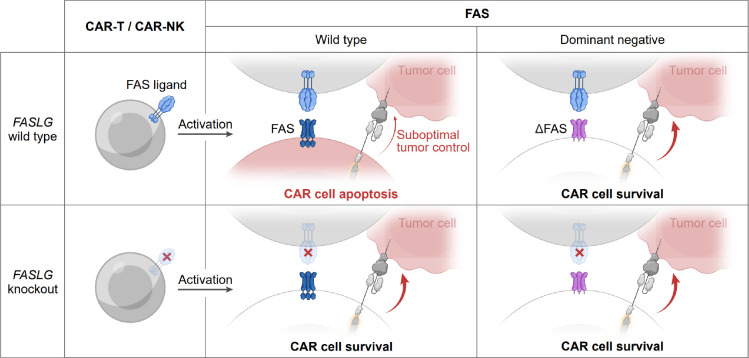
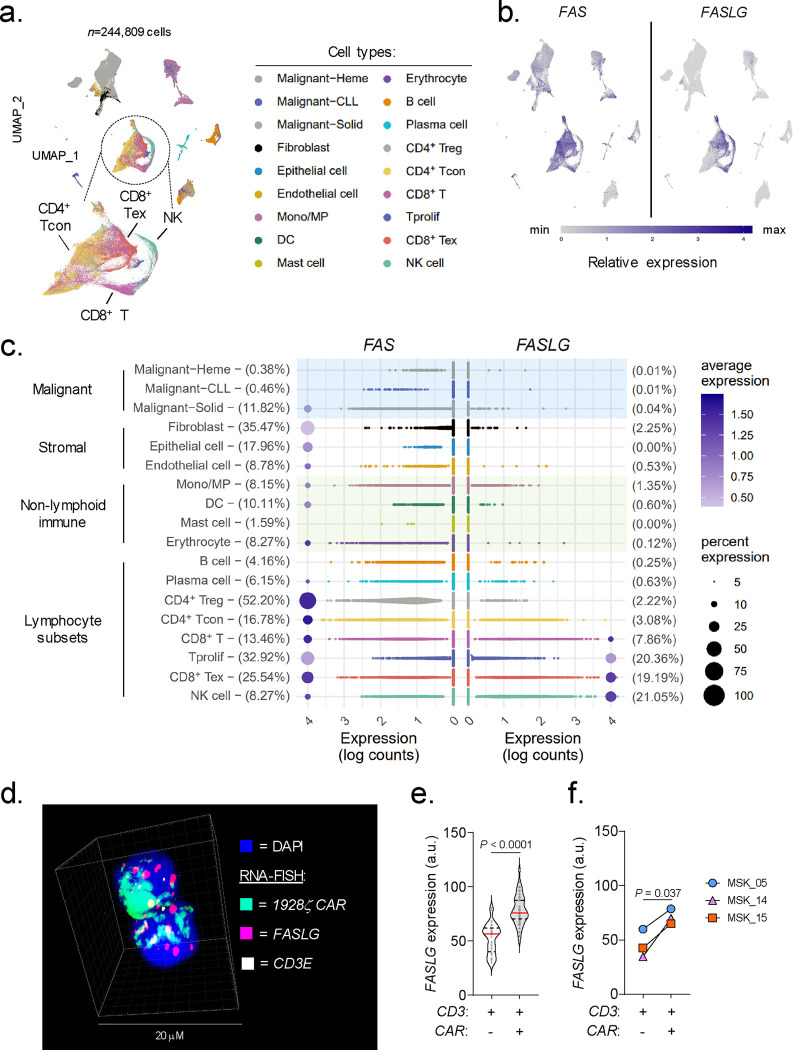
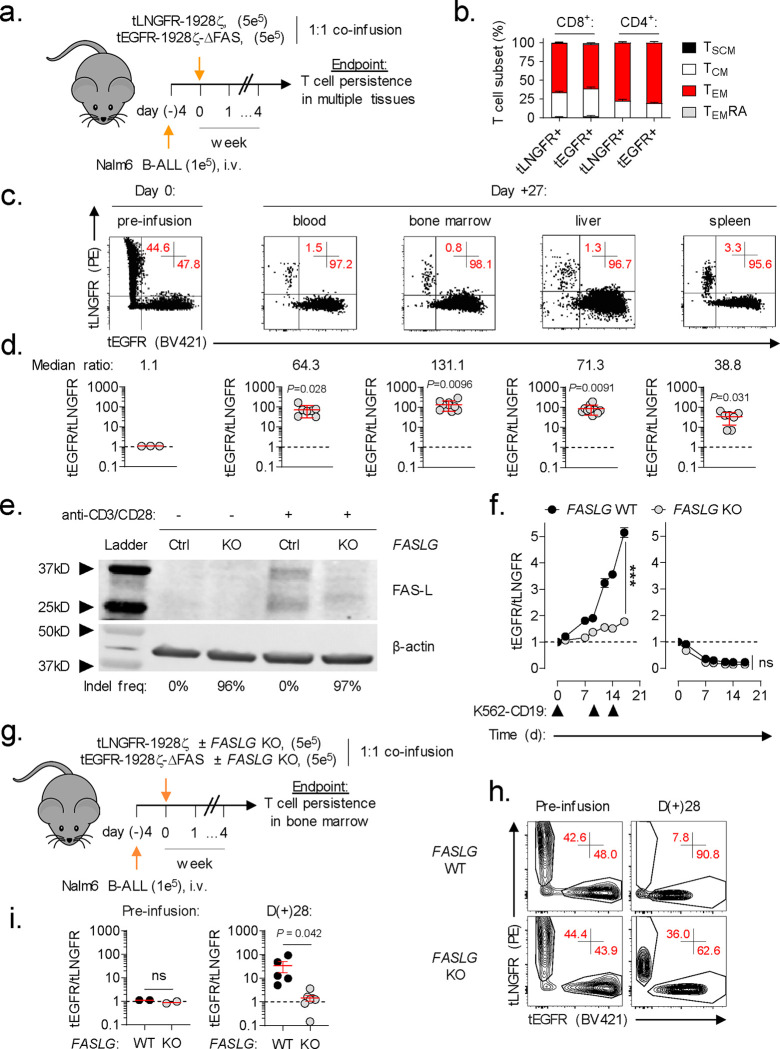
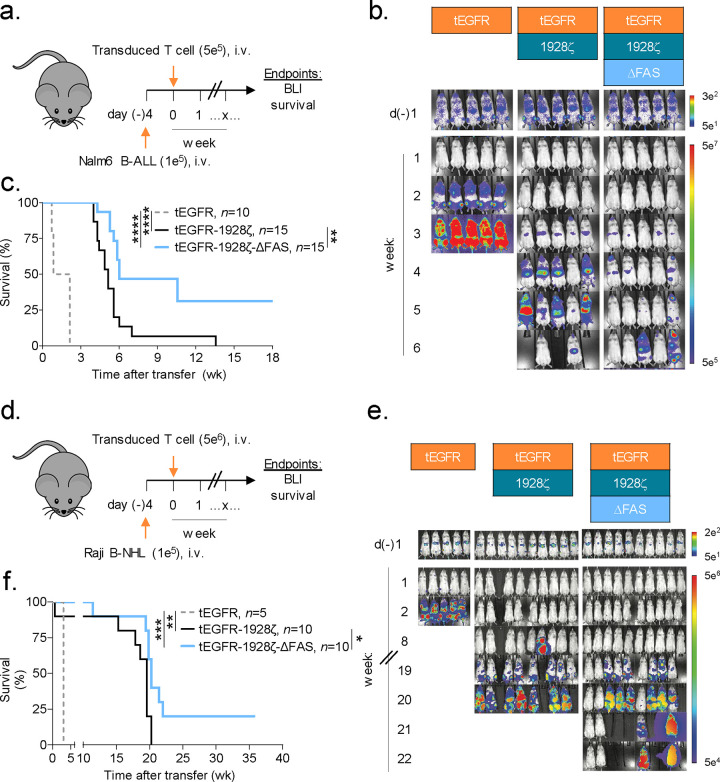
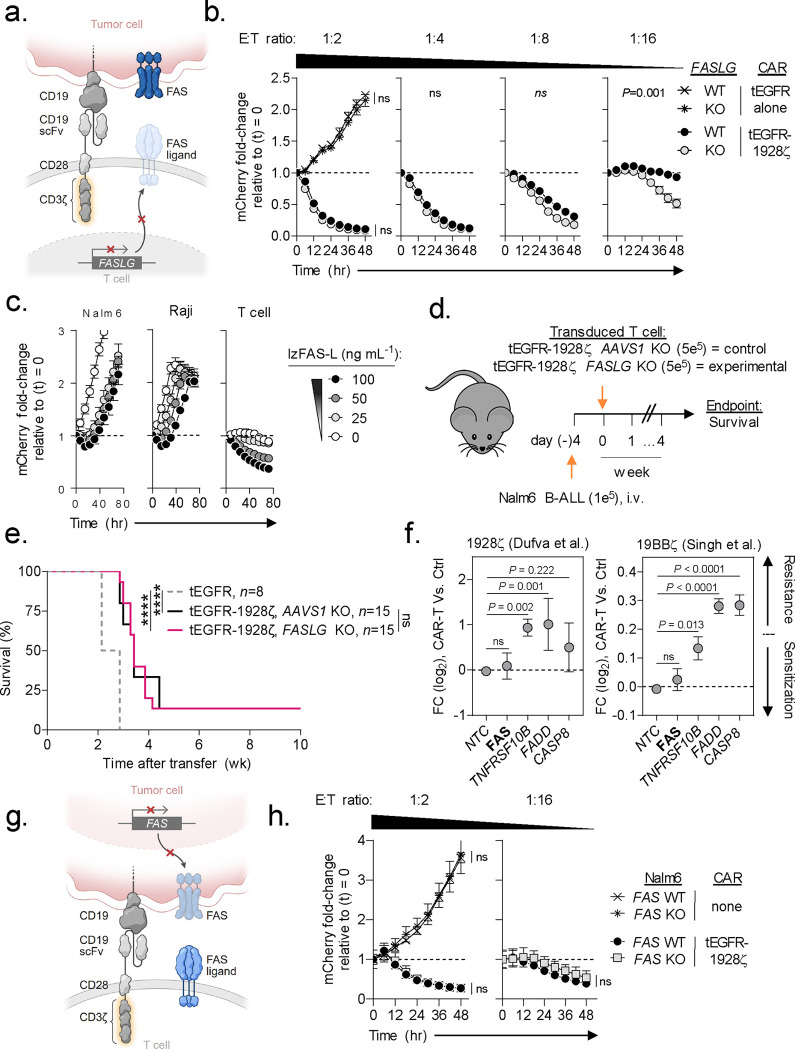
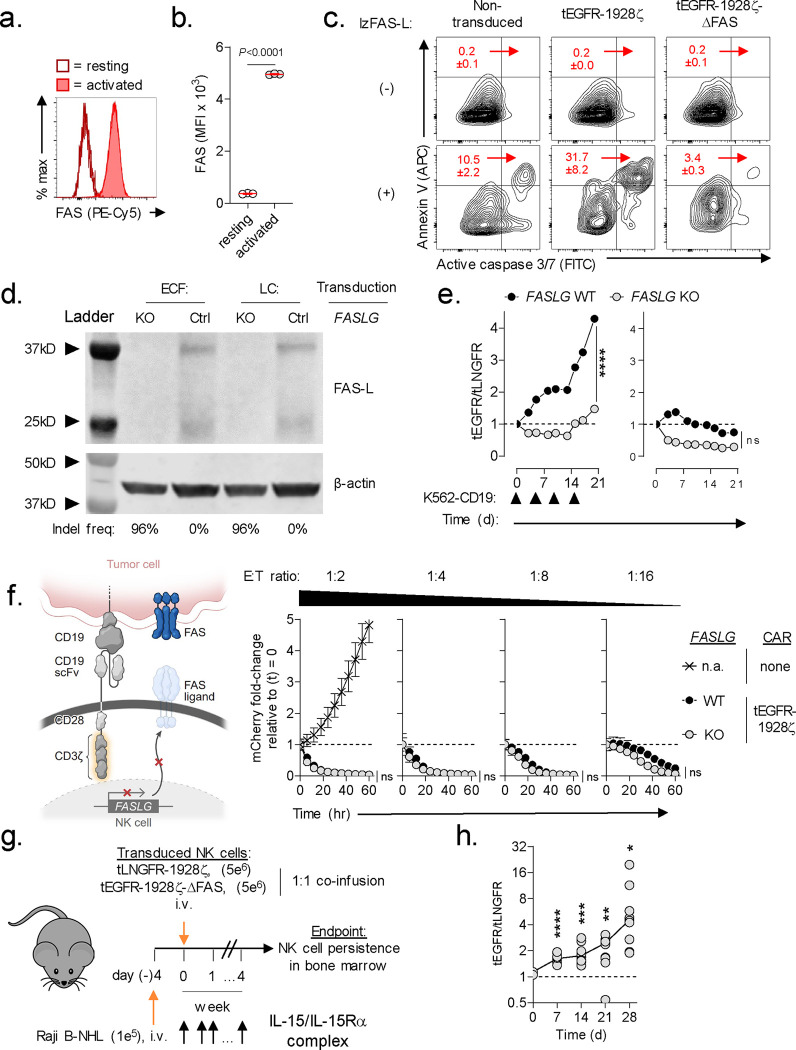
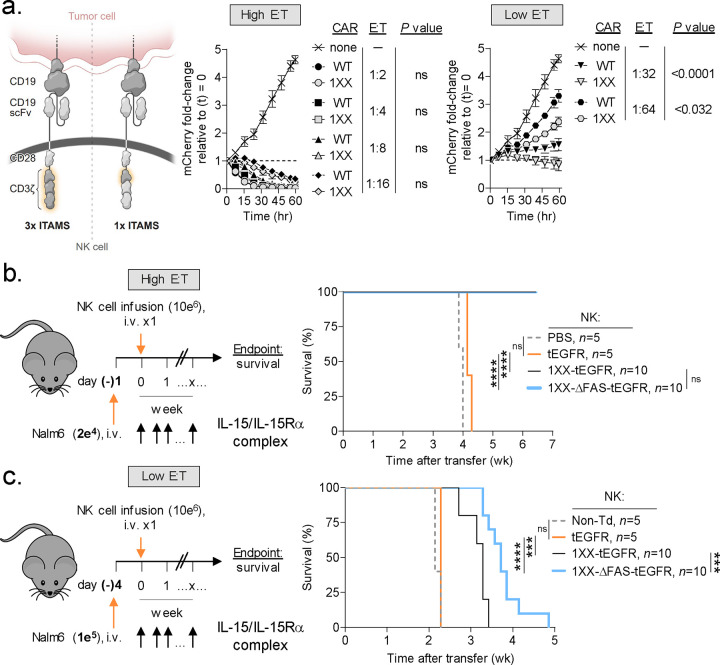
Chimeric antigen receptor (CAR)-engineered T and NK cells can cause durable remission of B-cell malignancies; however, limited persistence restrains the full potential of these therapies in many patients. The FAS ligand (FAS-L)/FAS pathway governs naturally-occurring lymphocyte homeostasis, yet knowledge of which cells express FAS-L in patients and whether these sources compromise CAR persistence remains incomplete. Here, we constructed a single-cell atlas of diverse cancer types to identify cellular subsets expressing FASLG, the gene encoding FAS-L. We discovered that FASLG is limited primarily to endogenous T cells, NK cells, and CAR-T cells while tumor and stromal cells express minimal FASLG. To establish whether CAR-T/NK cell survival is regulated through FAS-L, we performed competitive fitness assays using lymphocytes modified with or without a FAS dominant negative receptor (ΔFAS). Following adoptive transfer, ΔFAS-expressing CAR-T and CAR-NK cells became enriched across multiple tissues, a phenomenon that mechanistically was reverted through FASLG knockout. By contrast, FASLG was dispensable for CAR-mediated tumor killing. In multiple models, ΔFAS co-expression by CAR-T and CAR-NK enhanced antitumor efficacy compared with CAR cells alone. Together, these findings reveal that CAR-engineered lymphocyte persistence is governed by a FAS-L/FAS auto-regulatory circuit.


Figures

Extended Data Fig. 1:
Extended Data Fig. 1:. Overview of patient samples used to generate a single-cell atlas of FASLG expression by endogenous and CAR-engineered cells.
Summary of (a) cell-therapy naïve cancer patients, (b) patients treated with a 1928ζ CAR, and (c) healthy donors analyzed using single-cell techniques to generate a FASLG expression atlas. Pictographs and tables display the sample size for each cancer cohort, gender distribution, age range, total number of single-cells analyzed, and reference to the primary data sets. B-ALL = B-cell acute lymphoblastic leukemia; CLL = chronic lymphocytic leukemia; COAD = colon adenocarcinoma; KIRC = kidney renal clear cell carcinoma; LUAD = lung adenocarcinoma; LUSC = lung squamous cell carcinoma; READ = rectal adenocarcinoma; SKCM = skin cutaneous melanoma; UM = uveal melanoma. n.d. = no data.
Extended Data Fig. 2:
Extended Data Fig. 2:. Quantification of FASLG expression by 1928ζ CAR-expressing T cells following in vitro co-culture with CD19+ leukemia cells using RNA in situ hybridization.
(a) Representative immunofluorescent confocal images and (b) summary violin plots quantifying FASLG mRNA expression by non-transduced or 1928ζ CAR-expressing T cells at rest or 24h following in vitro co-culture with CD19+ Nalm6 B-ALL. Samples were co-hybridized with DAPI (blue) and multiplexed RNA-FISH probes specific for the mRNA sequence of the CAR’s single-chain variable fragment (scFv) (green), CD3E mRNA (white), and FASLG mRNA (red). Data shown is representative of results using T cells derived from n=2 healthy donors. Violin distributions are centered around the median (red horizontal line) with quartiles ranges displayed above and below (dashed horizontal lines). The maxima and minima are represented by the top and bottom of each plot. Each dot represents mean FASLG mRNA expression within a particular cell type from a region of interest. P-values calculated using a two-sided Student’s t-test. a.u. = arbitrary fluorescence units.
Extended Data Fig. 3:
Extended Data Fig. 3:. Cell-intrinsic disruption of FAS-signaling blocks CAR-T cell apoptosis but not effector function in vitro.
(a) Schematic representation of two multi-cistronic vectors encoding tEGFR and a 1928ζ CAR alone (EC) or together with a FAS dominant negative receptor (ΔFAS) (ECF). To facilitate stoichiometric expression, each transgene was separated by a picornavirus self-cleaving 2A peptide sequence (P2A). To avoid vector recombination, each P2A in a single construct was encoded using degenerate codon sequence. (b) Representative FACS plots for activated caspase 3/7 in human T cells left untransduced (UT) as a control or transduced with an indicated multi-cistronic vector. Caspase activity was measured at rest and 4h following stimulation with 100ng mL−1 of a recombinant human FAS-L molecule oligomerized through a leucine zipper domain (lzFAS-L). Median of n=3 biologic replicates is shown together with mean ± s.e.m. of gated activate caspase 3/7+ lymphocytes. (c) Simplified Presentation of Incredibly Complex Evaluations (SPICE) analysis representing cytokine polyfunctionality of T cells transduced with indicated CAR constructs and co-cultured with or without K562-CD19 leukemia cells. T cells exposed to phorbol 12-myristate 13-acetate/ionomycin (PMA/I) was used as a positive control. Concentric plots indicate the median expression of three measured cytokines (TNFα, IFNγ, and IL-2) from n=3 biologic replicates. (d) In vitro cytolytic activity of UT, EC, or ECF-expressing T cells against Nalm6/mCherry. Data shown as mean ± s.e.m. using n=3 biological replicates per condition. P-values calculated using a one-way ANOVA.
Extended Data Fig. 4:
Extended Data Fig. 4:. Knockout of TRAIL in 1928ζ CAR-T cells significantly impairs antitumor cytolytic activity.
(a) Schematic for the CRISPR/Cas9-mediated knockout (KO) of TRAIL in human CD8+ T cells expressing a 1928ζ CAR. (b) Cytolytic activity of TRAIL-KO versus wild type (WT)-TRAIL 1928ζ CAR-T cells or T cells transduced with tEGFR alone against Nalm6/mCherry at indicated effector to target (E:T) ratios. Data shown as mean ± s.e.m. using n=3 biological replicates per condition. Statistical comparisons performed using a one-way ANOVA. ns = not significant, P>0.05. (c) Table displaying the measured frameshift insertion-deletion (Indel) frequency in TRAIL for each T cell group used in the cytolytic assay. Data shown as mean ± s.e.m. from n=3 technical replicates.
Extended Data Fig. 5:
Extended Data Fig. 5:. Model for the dichotomous functions of CAR-derived FAS-L on cellular persistence and antitumor efficacy.
Cells colored in red indicate FAS-L induced apoptosis.
Fig. 1:
Fig. 1:. FASLG is expressed by endogenous and CAR-expressing lymphocytes.
(a) UMAP visualization of scRNA-seq from n=244,809 immune and non-immune cells obtained from the tumor and peripheral blood of patients with n=10 hematologic cancers, n=27 solid cancers, and peripheral blood from n=4 healthy donors. Each dot represents an individual cell assigned to one of 18 inferred cell types. (b) Log-transformed normalized gene expression values for FAS and FASLG overlaid on the UMAP coordinates defined in panel (a). (c) Comparison of the frequency and magnitude of FAS and FASLG expression by individual cells assigned to each inferred cell type identified in the UMAP visualization. Bubble size represents the frequency of each cell type that expresses the indicated gene and color indicates the relative intensity of expression. (d) Representative immunofluorescent confocal image, (e) summary violin plots, and (f) patient-level analyses quantifying FASLG mRNA expression by endogenous and CAR-expressing T cells in the bone marrow of patients with B-ALL treated with a 1928ζ CAR. Samples were co-hybridized with DAPI (blue) and multiplexed RNA-FISH probes specific for the mRNA sequence of the CAR’s single-chain variable fragment (scFv) (green), CD3E mRNA (white), and FASLG mRNA (red). Data shown is derived from n=3 patients. Violin distributions are centered around the median (red horizontal line) with quartiles ranges displayed above and below (dashed horizontal lines). The maxima and minima are represented by the top and bottom of each plot. Each dot represents mean FASLG mRNA expression within a particular cell type from an annotated region of interest. P-values calculated using a two-sided Student’s t-test. a.u. = arbitrary fluorescence units.
Fig. 2:
Fig. 2:. CAR-T derived FASLG auto-regulates cellular persistence in vivo.
(a) Schematic overview of the experimental design to test the in vivo persistence of human T cells that express a 1928ζ CAR ± a FAS dominant negative receptor (ΔFAS) in tumor-bearing mice. T cells were co-transferred at a ~1:1 ratio into NSG mice bearing established Nalm6 B-cell acute lymphoblastic leukemia (B-ALL) and tracked based on expression of tLNGFR or tEGFR. (b) Percentage of CD8+ and CD4+ T cells with a given memory phenotype at the time of adoptive transfer following transduction with tLNGFR-1928ζ or tEGFR-1928ζ- ΔFAS. Bar graphs displayed as mean ± s.e.m. using n=3 biological replicates. (c) Representative FACS and (d) summary scatter plots measuring the ratio of tEGFR+ to tLNGFR+ T cells at the time of infusion and four weeks following adoptive transfer. P-values calculated based on comparison to the infusion product using a two-sided Student’s t-test. (e) Western blot for FAS-L protein expression in lysates from control or FASLG-KO 1928ζ CAR-transduced T cells. Cells were analyzed at rest and 48h after anti-CD3/CD28 restimulation. The frequency of frameshift Indels in FASLG for each cell type are shown beneath each lane. (f) Relative antigen-driven in vitro expansion of control and FASLG-KO 1928ζ CAR-T cells with or without ΔFAS co-expression. CAR-T cells were combined in ~1:1 ratio on day 0 and serially restimulated at indicated time points (▲) with K562-CD19 FASLG-KO leukemia cells (left panel) or left unstimulated as controls (right panel). Data is displayed as the mean ratio of tEGFR/tLNGFR T cells ± s.e.m. using n=3 biological replicates. Groups were compared using a paired two-tailed Student’s T test for accumulated differences between each time point. (g) Schematic overview of the experimental design to test the influence of CAR-T derived FASLG on in vivo persistence in mice bearing established Nalm6 B-ALL. Control or FASLG-KO tLNGFR-1928ζ CAR-T cells were co-transferred at a ~1:1 ratio with control or FASLG-KO tEGFR-1928ζ- ΔFAS CAR-T cells into Nalm6 B-ALL bearing NSG mice. (h) Representative FACS and (i) summary scatter plot comparing the ratio of tEGFR to tLNGFR cells at the time of infusion and four weeks following adoptive transfer. Symbols displayed as mean ± s.e.m. Groups compared using a two-sided Student’s T test. ns, not significant (P>0.05).
Fig. 3:
Fig. 3:. Disabling FAS-signaling enhances CAR-T antitumor efficacy in vivo.
(a) Experimental design to compare the in vivo antitumor efficacy of human T cells that express a 1928ζ CAR ± a FAS dominant negative receptor (ΔFAS) against established Nalm6-luciferase (Luc) B-cell acute lymphoblastic leukemia (B-ALL). (b) Bioluminescence imaging (BLI) and (c) survival curves for Nalm6 B-ALL bearing NSG mice treated by i.v. injection with 5 × 10⁵ tEGFR+ T cells transduced with the indicated vectors. Pooled survival data from two identically performed experiments is shown in (c) plotted as a Kaplan–Meier survival curve (tEGFR alone, n = 10; tEGFR-1928ζ, n = 15; tEGFR-1928ζ-ΔFAS, n = 15). ****P<0.0001 and **P=0.0023 using a log-rank test. (d) Experimental design to compare the in vivo antitumor efficacy of human T cells that express a 1928ζ CAR ± ΔFAS against established Raji-Luc B-cell non-Hodgkin’s lymphoma (B-NHL). (e) Bioluminescence imaging and (f) survival curves for mice bearing Raji B-NHL and treated by i.v. injection with 5 × 10⁶ tEGFR+ T cells transduced with the indicated vectors. Survival data is plotted as a Kaplan–Meier survival curve (tEGFR alone, n = 5; tEGFR-1928ζ, n = 10; tEGFR-1928ζ-ΔFAS, n = 10). ***P=0.0002, **P=0.0043, and *P=0.0169 using log-rank test. wk, week.
Fig. 4:
Fig. 4:. FAS-L/FAS-signaling is dispensable for CAR-T antitumor efficacy.
(a) Schematic for the CRISPR/Cas9-mediated knockout (KO) of FASLG (experimental) or AAVS1 (control) in human CD8+ T cells expressing a 1928ζ CAR. (b) Cytolytic activity of FASLG-KO versus AAVS1-KO 1928ζ CAR-T cells against Nalm6/mCherry at indicated effector to target (E:T) ratios. Data shown as mean ± s.e.m. using n=3 biological replicates per condition. Statistical comparisons performed using a one-way ANOVA. ns = not significant (P>0.05). (c) Growth kinetics of Nalm-6 B-ALL, Raji B-NHL, or activated T cells in the presence or absence of lzFAS-L. Each cell type was transduced with mCherry. Data shown as mean ± s.e.m. using n=3 biological replicates per condition following incubation with an indicated concentration of lzFAS-L. hr, hour. (d) Experimental design and (e) Kaplan–Meier survival curve comparing the in vivo antitumor efficacy of human CD8+ T cells that express a 1928ζ CAR with FASLG-KO or AAVS1-KO against established Nalm-6 B-ALL. tEGFR alone, n=8; tEGFR-1928ζ AAVS1-KO, n=15; tEGFR-1928ζ FASLG-KO, n=15. ****P< 0.0001 and ns (not significant, P>0.05) using log-rank test. wk, week. (f) Scatter plots displaying the enrichment or depletion of synthetic guide RNAs (sgRNAs) targeting indicated genes in the death receptor pathway by Cas9-expressing Nalm-6 B-ALL cells. Tumor cells were placed under selection by T cells transduced with a 1928ζ CAR (left), a 41BBζ CAR (right), or left non-transduced as specificity controls (Ctrl). Data re-analyzed from two published genome-scale CRISPR/Cas9 screens, and is shown as mean log2 fold-change (FC) ± s.e.m of sgRNAs targeting indicated genes. NTC = non-targeted control sgRNAs. Gene level significance was determined using a one-way ANOVA corrected for multiple comparisons by Dunnett’s test. (g) Schematic for the CRISPR/Cas9-mediated knockout (KO) of FAS using an individual sgRNA in Nalm6 B-ALL. (h) Time-dependent cytolytic activity of 1928ζ CAR-T cells against FAS-KO versus FAS-wild type (WT) Nalm6/mCherry cells at a high (left) or low (right) E:T ratio. Data shown as mean ± s.e.m. using n=3 biological replicates per condition and time point. Statistical comparisons were performed using a one-way ANOVA.
Fig. 5:
Fig. 5:. CAR-NK survival is regulated by a FAS/FAS ligand auto-regulatory circuit.
(a) Representative FACS and (b) summary scatter plot quantifying FAS expression on cord blood-derived human NK cells at rest and 5d following activation with irradiated K562 Clone 9 cells. Data shown as mean ± s.e.m. using n=3 biological replicates per condition. Statistical analysis performed by two-sided Student’s T test. (c) Representative FACS plots quantifying lzFAS-L induced apoptosis in activated non-transduced NK cells or NK cells transduced with tEGFR-1928ζ or tEGFR-1928ζ-ΔFAS. Numbers indicate the mean ± s.e.m. of activated caspase 3/7+/annexin V+ cells for each condition. (d) Western blot for FAS-L protein expression in lysates from FASLG-KO or control (Ctrl) NK cells transduced with tEGFR-1928ζ-ΔFAS (ECF) or tLNGFR-1928ζ (LC). The frequency of frameshift Indels in FASLG are shown beneath each lane. (e) Relative antigen-driven in vitro expansion of control and FASLG-KO 1928ζ CAR-NK cells with or without ΔFAS co-expression. CAR-T cells were combined in ~1:1 ratio on day 0 and serially restimulated at indicated time points (▲) with K562-CD19 FASLG-KO cells (left panel) or left unstimulated as controls (right panel). Data displayed as the mean ratio of tEGFR+ to tLNGFR+ NK cells ± s.e.m. using n=3 biological replicates. Groups compared using a paired two-tailed Student’s T test for accumulated differences between each time point. ****P<0.0001, ns = not significant (P>0.05). (f) Cytolytic activity of FASLG-KO versus FASLG-wild type (WT) tEGFR-1928ζ CAR-NK cells against Raji/mCherry at indicated effector to target (E:T) ratios. Data shown as mean ± s.e.m. using n=3 biological replicates per condition. Statistical comparisons performed using a one-way ANOVA. ns = not significant (P>0.05), n.a. = not applicable. (g) Schematic overview of the experimental design to test the in vivo persistence of NK cells that express a 1928ζ CAR ± a FAS dominant negative receptor (ΔFAS) in Raji B-NHL bearing mice. (h) Scatter plot comparing the ratio of tEGFR+ to tLNGFR+ CAR-NK cells at the time of infusion and at indicated time points following adoptive transfer in the bone marrow of Raji B-NHL bearing mice. P-values calculated based on comparison to the infusion product using an unpaired, two-sided, Welch’s t-test. ****P<0.0001, ***P=0.0006, **P=0.0026, *P=0.0173.
Fig. 6:
Fig. 6:. Disabling FAS-signaling enhances CAR-NK antitumor efficacy in vivo.
(a) Comparison of the in vitro cytolytic efficiencies of NK cells transduced with a wild type (WT) or 1XX version of the 1928ζ CAR against Nalm6/mCherry at high versus low effector to target (E:T) ratios. Data shown as mean ± s.e.m. using n=3 biological replicates per condition. Statistical comparisons performed using a one-way ANOVA. ns = not significant, P>0.05. (b) Experimental design to compare the in vivo antitumor efficacy of human NK cells expressing the 1XX 1928ζ CAR ± a FAS dominant negative receptor (ΔFAS) against established Nalm6 B-ALL at a high versus low E:T ratio. All mice received a twice-weekly intraperitoneal injection of 1 μg of IL-15 pre-complexed with IL-15Rα-Fc (1:1 M). (c) Data plotted as a Kaplan–Meier survival curve (PBS, n=5; non-transduced NK cells, n=5; tEGFR alone, n = 5; 1XX 1928ζ-tEGFR, n = 10; 1XX 1928ζ-ΔFAS-tEGFR, n = 10). ****P<0.0001, ***P=0.001, and ns = not significant (P>0.05) using log-rank test. wk, week.

References

    1. Neelapu S.S., et al. Axicabtagene Ciloleucel CAR T-Cell Therapy in Refractory Large B-Cell Lymphoma. N Engl J Med 377, 2531–2544 (2017). - PMC - PubMed
    1. Wang M., et al. KTE-X19 CAR T-Cell Therapy in Relapsed or Refractory Mantle-Cell Lymphoma. N Engl J Med 382, 1331–1342 (2020). - PMC - PubMed
    1. Shah B.D., et al. KTE-X19 for relapsed or refractory adult B-cell acute lymphoblastic leukaemia: phase 2 results of the single-arm, open-label, multicentre ZUMA-3 study. Lancet 398, 491–502 (2021). - PMC - PubMed
    1. Abramson J.S., et al. Lisocabtagene maraleucel for patients with relapsed or refractory large B-cell lymphomas (TRANSCEND NHL 001): a multicentre seamless design study. Lancet 396, 839–852 (2020). - PubMed
    1. Maude S.L., et al. Tisagenlecleucel in Children and Young Adults with B-Cell Lymphoblastic Leukemia. N Engl J Med 378, 439–448 (2018). - PMC - PubMed

Publication types