[Preprint]. 2025 Mar 22:2024.02.28.582569.
doi: 10.1101/2024.02.28.582569.

Tunable metastability of condensates reconciles their dual roles in amyloid fibril formation

Affiliations

Tunable metastability of condensates reconciles their dual roles in amyloid fibril formation

Tapojyoti Das et al. bioRxiv. .

Update in

Abstract

Stress granules form via co-condensation of RNA-binding proteins containing prion-like low complexity domains (PLCDs) with RNA molecules. Homotypic interactions among PLCDs can drive amyloid fibril formation that is enhanced by ALS-associated mutations. We report that condensation- versus fibril-driving homotypic interactions are separable for A1-LCD, the PLCD of hnRNPA1. Separable interactions lead to thermodynamically metastable condensates and globally stable fibrils. Interiors of condensates suppress fibril formation whereas interfaces have the opposite effect. ALS-associated mutations enhance the stability of fibrils and weaken condensate metastability, thus enhancing the rate of fibril formation. We designed mutations to enhance A1-LCD condensate metastability and discovered that stress granule disassembly in cells can be restored even when the designed variants carry ALS-causing mutations. Therefore, fibril formation can be suppressed by condensate interiors that function as sinks. Condensate sink potentials are influenced by their metastability, which is tunable through separable interactions even among minority components of stress granules.

Keywords: Phase separation; RNP granule; amyotrophic lateral sclerosis; fibril formation; frontotemporal dementia; prion-like domain; stress granule; supersaturation.


Conflict of interest statement

DECLARATION OF INTERESTS RVP is a member of the Scientific Advisory Board and a shareholder of Dewpoint Therapeutics. TM is a member of the advisory board of Molecular Cell. PRB is a member of the Biophysics Reviews (AIP Publishing) editorial board. The work reported here was not influenced by these affiliations. The remaining authors declare no competing interests.

Figures
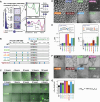
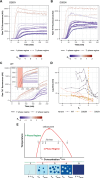
Figure 1:
Figure 1:. Pathogenic mutations reduce the metastability of A1-LCD condensates.
(A) Schematic of the implications of measurable threshold concentrations csf and csc for the thermodynamic driving forces that govern condensate versus fibril formation. We depict expectations for the scenario where csf < csc. If the total concentration, designated as ctotal, is lower than csf and csc, then dispersed monomers are thermodynamically favored. If csf < ctotal < csc, then the thermodynamic driving forces favor separation of the system into two phases namely, dispersed monomers that coexist with fibrils. Kinetically, the barrier to nucleating fibrils will be governed by ∆∆GPN, the barrier to primary nucleation. For ctotal > csc, the metastable condensates serve as an off-pathway sink, and the barrier to nucleating condensates is set by ∆∆Gc. The sink potential of condensates is quantified by ∆∆Ggap = −RTln(csf/csc) which is the difference in standard state free energies of the fibril versus condensate phases. Here, R is the ideal gas constant, and T is the temperature of the system. (B) Schematic of the sequence architectures showing a steric zipper motif (S259YNDFG264, denoted as grey rectangle) within A1-LCD WT, pathogenic mutants, and designed variants that encompass the pathogenic mutations (−4D+4V/N and −3D+3V/N) or the WT sequence (−3G1S+4V). Vertical bars indicate the positions of substitutions to Val (light blue) or Asn (green). (C) Time course of superimposed differential interference contrast (DIC) and thioflavin T (ThT) fluorescence microscopy images of solutions of A1-LCD variants showing condensates and the appearance of fibrils. These panels were extracted from Supplementary Videos 1-3. (D) DIC micrographs of condensates of A1-LCD variants formed under conditions where ctotal > csc, which refers to the systems being supersaturated with respect to the condensate threshold. Data are shown for WT (ctotal = 120 μM, Sc = 0.52), D262V (ctotal = 200 μM, Sc = 0.55), D262N (ctotal = 200 μM, Sc = 0.50), −4D+4V (ctotal = 950 μM, Sc = 0.51), −4D+4N (ctotal = 950 μM, Sc = 0.50), −3D+3V (ctotal = 500 μM, Sc = 0.27), −3D+3N (ctotal = 500 μM, Sc = 0.27), and −3G1S+4V (ctotal = 180 μM, Sc = 0.54). (E) (Top left) Schematic depicting the method used to measure csc, and (bottom left) plot of csc of A1-LCD variants at 20°C, (top right) schematic depicting the method used to obtain csf, and (bottom right) plot showing csf of A1-LCD variants obtained after 14 days of incubation of samples of 10 μM concentration at 20°C. Individual data points from replicate experiments are shown along with mean ± standard error in the estimate of the mean (SEM). (F) Negative-stain TEM images showing fibrils formed by A1-LCD variants in the pellets obtained after ultracentrifugation in the assay in (D, right). (G) Plot of ∆∆Ggap for all A1-LCD variants. Individual values of ∆∆Ggap from all possible pairs of csc and csf are shown along with the mean ± SEM. All experiments were performed in 40 mM HEPES buffer, pH 7.0 and 150 mM NaCl. Also see Figure S1.
Figure 2:
Figure 2:. Metastable condensates decelerate conversion to globally stable fibrils.
(A, B, C) Kinetics of fibril formation for A1-LCD variants (A) D262V, (B) D262N and (C) WT monitored by ThT fluorescence across a range of total protein concentrations (ctotal) that are subsaturated (Sc < 0, solid blue lines) or supersaturated (Sc > 0, dashed red lines) with respect to condensates. (C) Inset shows the complete time course. Data from a single representative experiment are shown; for replicate experiments see Figure S2. (D) Lag time of fibril formation (time at which ThT fluorescence reaches 10% of plateau value) for A1-LCD variants. The total protein concentrations are quantified as the degree of supersaturation relative to condensate formation (Sc) and fibril formation (Sf). Data from independent experiments using similarly prepared samples are represented by separate line plots. The dashed vertical line corresponds to Sc = 0. (E) Schematic of phase diagram of a UCST-type phase transition as observed for A1-LCD. The region below the coexistence curve (red) corresponds to the two-phase regime, where the sample contains condensates. The bottom panel is a visual representation of the sample under each condition. Notably, csc and cdense are constant at increasing total protein concentration. Also see Figures S3 and S4.
Figure 3:
Figure 3:. Slow protein efflux from condensates slows fibril formation.
(A) Schematic of the chemical kinetics model used to fit ThT fluorescence curves (see Methods). (B) Examples of fits to ThT fluorescence traces for WT (ctotal = 41 µM, Sc = −0.53), D262V (ctotal = 65 µM, Sc = −0.57), and D262N (ctotal = 65 µM, Sc = −0.61) in the absence of condensates (solid fit lines), and for WT (ctotal = 128 µM, Sc = +0.59), D262V (ctotal = 200 µM, Sc = +0.55), and D262N (ctotal = 200 µM, Sc = +0.50) in the 2-phase regime (dashed fit lines). Concentrations were chosen to ensure similar degrees of subsaturation and supersaturation with respect to csc for each of the three constructs. (C-F) Parameters extracted from fitting ThT fluorescence traces to the chemical kinetics model for all reactions at total concentrations ≥17 µM and three replicas performed at sample ages of 0 days. Data were analyzed by fixing the supersaturation with respect to the condensation threshold. Thus, Sf will be system-specific. (G-I) The effect of titrating kdil→den and kden→dil on the time to reach (G) 5, (H) 50, and (I) 95 percent fibrils. Here, all other parameters are set to be constant with k1 = 1e-8, k2 = 5e-9, klong = 500, and the total protein concentration, ctotal = 200 µM. The total simulation time was 500 minutes. White values indicate that the target for percent of monomers incorporated into fibrils was not reached within this time. (J) Before-and-after plots comparing the input protein concentration and the concentration of soluble protein left in the supernatant after 14 days of incubation, when using different input concentrations above and below csc. Data from individual measurements are shown. Red lines denote the csc values for each variant. When csf < ctotal < csc, the concentration in the supernatant consistently reaches the same value, which we interpret as csf. (Data reproduced from Figures 1E and S1D.) However, when ctotal > csc, the amount of protein remaining in the supernatant increases, depending on the extent of supersaturation, pointing to the residual sequestration of soluble proteins in condensates even after 14 days of incubation and ultracentrifugation. Also see Figure S5.
Figure 4:
Figure 4:. Enhancing the metastability of mutant condensates suppresses fibril formation.
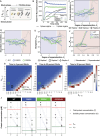
(A) Schematic of sequence architectures of A1-LCD wild-type, pathogenic mutants, and the Trp variants depicting the sites of mutations. Vertical bars indicate the position of Phe (green), Tyr (blue) or Trp (yellow) residues in the sequence. The motif surrounding the pathogenic mutation site (S259YNDFG264) is shown as a grey rectangle. (B) DIC images of condensates formed by the Trp variants at 0 hour and 24 hours of incubation. The structures formed by variants 11W D262V and 5W D262V after 24 hours are bundles of fibrils . (C) Measured csc values for WT A1-LCD, pathogenic mutants and Trp variants. (D) Measured csf values for these variants at 20°C. Individual measurements are shown along with mean ± SEM. Values for WT A1-LCD, D262V and D262N are taken from Figure 1E. (E) Negative-stain TEM images showing fibrils (and some oligomers) formed by Trp variants in the pellets obtained after ultracentrifugation in the assay in panel (C). (F) ∆∆Ggap values for A1-LCD variants. Individual data points calculated from all possible pairs of replicate experiments in (C, D) are shown along with the mean ± SEM. (G) ThT fluorescence-monitored fibrillization kinetics of A1-LCD variants D262V, allW D262V, 11W D262V and 5W D262V at equal concentrations of 40 µM showing raw ThT fluorescence as a function of time. For additional concentrations see Figure S6E. (H) Suppression of fibril formation of the D262V disease mutant in the presence of increasing concentration of the allW D262V and 11W D262V variants, and of the D262N disease mutant in the presence of increasing concentration of the allW D262N variant. All experiments were carried out in 40 mM HEPES buffer, pH 7.0 and 150 mM NaCl. Also see Figure S6.
Figure 5:
Figure 5:. Trp mutants slow the nucleation and growth of fibrils.
(A) Effect of Trp variants (allW D262V, 11W D262V, 5W D262V) on the fibril formation kinetics of the pathogenic mutant of A1-LCD in the absence of condensates. (B) Effect of Trp variants on the kinetics of seeded aggregation (in presence of 10% w/w fibril seeds of A1-LCD D262V). To compare lag time and growth rates, the ThT fluorescence data are shown normalized to the plateau value.
Figure 6:
Figure 6:. Condensate metastability governs the kinetics of protein efflux.
(A) Schematic of the experimental setup for condensate dissolution measurements using an optical tweezer and a laminar flow microfluidic cell. (B) Representative decay traces of condensate size as a function of time for different A1-LCD variants, fitted using a stretched exponential function. See also Videos S4-S6. (C) Dissolution time constants of A1-LCD variants extracted from decay traces of individual condensates. Data from individual measurements are shown along with mean ± SEM. The mean dissolution time constant (in sec) of each variant is indicated. All experiments were performed in 40 mM HEPES buffer, pH 7.0, and 150 mM NaCl and the concentration of each A1-LCD variant was as follows: WT, 300 μM; AllW, 100 μM; AllW D262V, 200 μM.
Figure 7:
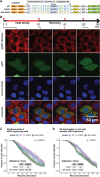
Figure 7:. Mutations that increase the metastability of A1-LCD condensates rescue a SG disassembly phenotype in cells.
(A) Schematic of the architecture of full-length hnRNPA1 variants with C-terminal FLAG tag and proportionately expressing eGFP via an interim IRES sequence, showing the location and identity of the aromatic residues in the LCD. (B) Representative micrographs of U2OS cells expressing the SG marker G3BP1-tdTomato (red) from its endogenous locus, that were transiently transfected with the WT hnRNPA1-FLAG-IRES-eGFP construct and subjected to 1 hour of heat stress at 43 ºC, during which SGs become visible as punctate G3BP1 foci in the cytoplasm. In the recovery phase at 37 °C, the SGs dissolve over time. eGFP (green) identifies the cells expressing protein from the transfected construct. The cell nuclei are stained with Hoechst 33342 (blue). (C) Quantification of SG disassembly kinetics in cells expressing eGFP. The mean of three independent replicate experiments is shown. (D) Quantification of SG disassembly kinetics from the same experiments as in (C) but of cells without eGFP signal. (C,D) The mean of three independent replicate experiments is shown. The shaded regions represent the 95% confidence interval. The three variants were compared using a log rank test, and the overall p-value that tests for differences between variants is shown in the top right corner. For pairwise comparisons of variants, adjusted p-values (using the Benjamini-Hochberg correction) are shown in the table inset. Also see Figure S7.

Similar articles

References

    1. Yang P., Mathieu C., Kolaitis R.M., Zhang P., Messing J., Yurtsever U., Yang Z., Wu J., Li Y., Pan Q., et al. (2020). G3BP1 Is a Tunable Switch that Triggers Phase Separation to Assemble Stress Granules. Cell 181, 325–345 e328. 10.1016/j.cell.2020.03.046. - DOI - PMC - PubMed
    1. Sanders D.W., Kedersha N., Lee D.S.W., Strom A.R., Drake V., Riback J.A., Bracha D., Eeftens J.M., Iwanicki A., Wang A., et al. (2020). Competing Protein-RNA Interaction Networks Control Multiphase Intracellular Organization. Cell 181, 306–324 e328. 10.1016/j.cell.2020.03.050. - DOI - PMC - PubMed
    1. Guillen-Boixet J., Kopach A., Holehouse A.S., Wittmann S., Jahnel M., Schlussler R., Kim K., Trussina I., Wang J., Mateju D., et al. (2020). RNA-Induced Conformational Switching and Clustering of G3BP Drive Stress Granule Assembly by Condensation. Cell 181, 346–361 e317. 10.1016/j.cell.2020.03.049. - DOI - PMC - PubMed
    1. Van Treeck B., Protter D.S.W., Matheny T., Khong A., Link C.D., and Parker R. (2018). RNA self-assembly contributes to stress granule formation and defining the stress granule transcriptome. Proceedings of the National Academy of Sciences 115, 2734–2739. 10.1073/pnas.1800038115. - DOI - PMC - PubMed
    1. Wang J., Choi J.-M., Holehouse A.S., Lee H.O., Zhang X., Jahnel M., Maharana S., Lemaitre R., Pozniakovsky A., Drechsel D., et al. (2018). A Molecular Grammar Governing the Driving Forces for Phase Separation of Prion-like RNA Binding Proteins. Cell 174, 688–699.e616. 10.1016/j.cell.2018.06.006. - DOI - PMC - PubMed

Publication types