[Preprint]. 2024 Feb 19:2024.02.15.580166.
doi: 10.1101/2024.02.15.580166.

Metformin Enhances Antibody-Mediated Recognition of HIV-Infected CD4+ T-Cells by Decreasing Viral Release

Affiliations

Metformin Enhances Antibody-Mediated Recognition of HIV-Infected CD4+ T-Cells by Decreasing Viral Release

Augustine Fert et al. bioRxiv. .

Abstract

The mechanistic target of rapamycin (mTOR) positively regulates multiple steps of the HIV-1 replication cycle. We previously reported that a 12-weeks supplementation of antiretroviral therapy (ART) with metformin, an indirect mTOR inhibitor used in type-2 diabetes treatment, reduced mTOR activation and HIV transcription in colon-infiltrating CD4+ T-cells, together with systemic inflammation in nondiabetic people with HIV-1 (PWH). Herein, we investigated the antiviral mechanisms of metformin. In a viral outgrowth assay performed with CD4+ T-cells from ART-treated PWH, and upon infection in vitro with replication-competent and VSV-G-pseudotyped HIV-1, metformin decreased virion release, but increased the frequency of productively infected CD4lowHIV-p24+ T-cells. These observations coincided with increased BST2/Tetherin (HIV release inhibitor) and Bcl-2 (pro-survival factor) expression, and improved recognition of productively infected T-cells by HIV-1 Envelope antibodies. Thus, metformin exerts pleiotropic effects on post-transcription/translation steps of the HIV-1 replication cycle and may be used to accelerate viral reservoir decay in ART-treated PWH.


Conflict of interest statement

CONFLICT OF INTEREST The authors declare no competing interests.

Figures

Figure 1:
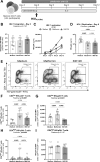
Figure 1:. Effects of metformin on viral outgrowth in memory CD4+ T-cells from ART-treated PWH.
(A) Shown is the flow chart for the viral outgrowth assay (VOA). Briefly, memory CD4+ T-cells from ART-treated PWH were stimulated with CD3/CD28 Abs, in the presence (n=11) or the absence (n=6) of ARVs and in the presence/absence of metformin (1 mM) or INK128 (50 nM) for 3 days. Supernatants were collected, cells were split in two news wells, and media containing IL-2 and metformin or INK128 was refreshed every 3 days. Experiments were performed in 4–8 original replicates per condition. One original replicate at day 0 generated 8 final replicates at day 12. At the end of the experiment, T-cells derived from the same original replicate were merged for PCR and flow cytometry analysis. Shown are (B) integrated HIV-DNA levels quantified by real-time nested PCR and (C) levels of HIV-p24 in cell-culture supernatants quantified by ELISA. Shown are (D) representative flow cytometry dot plot of intracellular HIV-p24 and surface CD4 expression; (E) statistical analysis of the frequency of CD4lowHIV-p24+, (F) the frequency of CD4highHIV-p24+ cells; and (G) the geometric MFI (GeoMFI) of HIV-p24 expression in CD4low HIV-p24+ and CD4high HIV-p24+ T-cell subsets. Each symbol represents one donor; bars indicate the median ± interquartile range. Kruskal-Wallis test and uncorrected Dunn’s multiple comparison p-values are indicated on the graphs.
Figure 2:
Figure 2:. Effects of metformin on HIV-1 transcription in memory CD4+ T-cells of ART-treated PWH.
(A) Shown is the experimental flow chart. Briefly, memory CD4+ T-cells from ART-treated PWH were stimulated by CD3/CD28 Abs in presence of ARVs (Saquinavir 5 μM, Raltegravir 200 nM) and in the presence or the absence of metformin (1 mM) or INK128 (50 nM) for 3 days. Cells were collected for dual extraction of cell-associated (CA) RNA and DNA. (B) Levels of integrated HIV-DNA Alu/LTR primers were quantified by nested real-time PCR and normalized per number of CD3 copies. (C) Levels of CA unspliced (US) HIV-RNA (Gag primers) were quantified by nested real-time RT-PCR and normalized to the number of HIV-DNA copies per 106 cells. (D) The HIV RNA/DNA ratio was used as a surrogate marker of HIV-1 transcription. Each symbol represents one donor (n=7; median ± interquartile range). Friedman p-values are indicated on the graphs. Uncorrected Dunn’s multiple comparison p-values did not reach statistical significance and are not shown.
Figure 3:
Figure 3:. Effects of metformin on HIV-1 replication in vitro in memory CD4+ T-cells.
(A) Shown is the flow chart for the HIV-1 infection in vitro. Briefly, memory CD4+ T-cells from HIV-uninfected donors were stimulated with anti-CD3/CD28 Abs in the absence/presence of metformin (1 mM) or INK128 (50 nM) for 3 days. Then, cells were exposed to the replication-competent NL4.3BaL HIV strain (50 ng HIV-p24/106 cells). Cell-culture supernatants were collected and media containing IL-2 and/or metformin or INK128 was refreshed every 3 days until day 12 post-infection. (B) Integrated HIV-DNA levels were quantified by real-time nested PCR at day 3 post infection. Shown are (C) levels of HIV-p24 in cell-culture supernatants quantified by ELISA in one representative donor, and (D) statistical analysis of HIV-1 replication at day 9 post-infection in cells from n=8 different donors. Shown is (E) the dot plot analysis of the intracellular HIV-p24 and surface CD4 expression allowing the identification of CD4lowHIV-p24+ cells (productively infected) and CD4highHIV-p24+ cells (recently infected); as well as (F) the statistical analysis of CD4lowHIV-p24+ T-cells frequency and (G) the geometric MFI of HIV-p24 expression. Shown are the statistical analysis (H) of CD4highHIV-p24+ T-cells frequency and (I) the geometric MFI of HIV-p24 expression. Each symbol represents 1 donor (n=8; median ± interquartile range). Friedman and uncorrected Dunn’s multiple comparison p-values are indicated on the graphs
Figure 4:
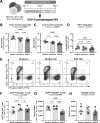
Figure 4:. Effects on metformin on single-round HIV-1 infection in vitro.
(A) Shown is the flow chart for the single-round HIV-1 infection in vitro. Briefly, memory CD4+ T-cells from HIV-uninfected donors were stimulated by anti-CD3/CD28 Abs in the absence/presence of metformin (1 mM) or INK128 (50 nM) for 3 days. Then, cells were exposed to a replication-incompetent single-round VSV-G-pseudotyped HIV-1 construct (100 ng HIV-p24/106 cells). Cell-culture supernatants and cells were collected at day 3 post-infection. Shown are levels of early (RU5) (B) and late HIV reverse transcripts (Gag) (C), as well as integrated HIV-DNA (D) quantified by real-time nested PCR. Shown are representative flow cytometry dot plots of intracellular HIV-p24 and surface CD4 expression from one donor (E) and statistical analysis of the productively infected CD4lowHIV-p24+ T-cells in terms of frequencies (F) and the geometric MFI of HIV-p24 expression (G). Shown are absolute HIV-p24 levels in cell culture supernatants quantified by ELISA (H). Each symbol represents one donor (n=7; median ± interquartile range). Friedman and uncorrected Dunn’s multiple comparison p-values are indicated on the graphs
Figure 5:
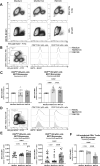
Figure 5:. Metformin and INK128 increases BST2 expression on productively infected CD4lowHIV-p24+ T-cells.
(A) Shown are representative flow cytometry dot plots of BST2 and HIV-p24 co-expression on T-cells at day12 post-infection with HIV-1NL4.3 Bal in vitro (upper panel) and at day 12 post TCR-mediated viral reservoir reactivation in VOA (bottom panel). (B-C) The HIV-1NL4.3Bal infection in vitro was performed as described in Figure 3 on cells from n=8 HIV-uninfected participants. Cells collected at day 12 post-infection were stained on the surface with CD4 and BST2 antibodies and intracellularly with HIV-p24 antibodies and analyzed by flow cytometry for n=8. Shown are (B) levels of BST2 expression on uninfected (CD4highHIV-p24) and productively infected (CD4lowHIV-p24+) T-cells in one representative donor and (C) statistical analysis of BST2 expression (GeoMFI) relative to the medium condition (considered 1). (D-E) The VOA was performed as described in Figure 1 with cells from n=6 ART-treated PWH. Cells collected at day 12 post-stimulation were stained on the surface with CD4 and BST2 Abs and intracellularly with HIV-p24 Abs and analyzed by flow cytometry. (D-E) Shown are levels of BST2 expression on CD4highHIV-p24 and CD4lowHIV-p24+ T-cells in (D) one representative donor and (E) statistical analysis of BST2 expression (absolute GeoMFI). (F) Shown is the BST2 expression relative to the medium condition of HIV-uninfected memory CD4+ T-cells at day 3 post-TCR stimulation. Each symbol represents one donor (median ± interquartile range). Friedman (C and F), Kuskal-Wallis (E) and uncorrected Dunn’s multiple comparison p-values are indicated on the graphs
Figure 6:
Figure 6:. Metformin increases Bcl-2 expression on HIV-infected and uninfected T-cells.
The HIV-1NL4.3Bal infection in vitro was performed as described in Figure 3 on cells from HIV-uninfected participants. Cells collected at day 12 post-infection were stained on the surface with CD4 antibodies and intracellularly with HIV-p24 and Bcl-2 antibodies and analyzed by flow cytometry. Shown are (A) levels of Bcl-2 expression on uninfected (CD4highHIV-p24) and productively infected (CD4lowHIV-p24+) T-cells in one representative donor and (B) statistical analysis of Bcl-2 expression (GeoMFI) relative to the medium condition (considered 1). Each symbol represents one donor (n=4; median ± interquartile range). Friedman and uncorrected Dunn’s multiple comparison p-values are indicated on the graphs.
Figure 7:
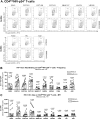
Figure 7:. Metformin facilitates the recognition of reactivated HIV reservoirs by anti-HIV Env antibodies.
The VOA was performed on memory CD4+ T-cells from ART-treated PWH, as described in Figure 1A. Cells harvested at day 12 post-TCR triggering and cultured in the presence/absence of metformin were stained on the surface with a set of unconjugated human anti-HIV-1 Env bNAbs (2G12, PGT121, PGT126, PGT151, 3BNC117, 101074, VRC03) and nnAbs (F240, 17b, A32), followed by incubation with anti-human Alexa Fluor 647-conjugated secondary Abs. Further, cells were stained on the surface with CD4 Abs, as well as intracellularly with HIV-p24 Abs. (A) Show are dot plot representations of HIV-p24 and HIV-Env co-expression in one representative donor. (B-C) Shown are statistical analysis of the frequency of anti-HIV-Env Abs binding on CD4lowHIV-p24+ T-cells (B), as well as the geometric MFI of anti-HIV-Env Abs binding on CD4lowHIV-p24+ T-cells (C). Wilcoxon test p-values are indicated on the graphs. Each symbol represents one donor (n=8; median ± interquartile range).

Similar articles

References

    1. Bai R.J., Dai L.L., and Wu H. (2020). Advances and challenges in antiretroviral therapy for acquired immunodeficiency syndrome. Chin Med J (Engl) 133, 2775–2777. 10.1097/CM9.0000000000001226. - DOI - PMC - PubMed
    1. Hsue P.Y., and Waters D.D. (2018). Time to Recognize HIV Infection as a Major Cardiovascular Risk Factor. Circulation 138, 1113–1115. 10.1161/CIRCULATIONAHA.118.036211. - DOI - PMC - PubMed
    1. So-Armah K., Benjamin L.A., Bloomfield G.S., Feinstein M.J., Hsue P., Njuguna B., and Freiberg M.S. (2020). HIV and cardiovascular disease. Lancet HIV 7, e279–e293. 10.1016/S2352-3018(20)30036-9. - DOI - PMC - PubMed
    1. Wang C.C., Silverberg M.J., and Abrams D.I. (2014). Non-AIDS-Defining Malignancies in the HIV-Infected Population. Curr Infect Dis Rep 16, 406. 10.1007/s11908-014-0406-0. - DOI - PMC - PubMed
    1. Samaras K., Wand H., Law M., Emery S., Cooper D., and Carr A. (2007). Prevalence of metabolic syndrome in HIV-infected patients receiving highly active antiretroviral therapy using International Diabetes Foundation and Adult Treatment Panel III criteria: associations with insulin resistance, disturbed body fat compartmentalization, elevated C-reactive protein, and [corrected] hypoadiponectinemia. Diabetes Care 30, 113–119. 10.2337/dc06-1075. - DOI - PubMed

Publication types