[Preprint]. 2024 May 10:2024.02.28.582664.
doi: 10.1101/2024.02.28.582664.

Suppressing APOE4-induced mortality and cellular damage by targeting VHL

Affiliations

Suppressing APOE4-induced mortality and cellular damage by targeting VHL

Wei I Jiang et al. bioRxiv. .

Abstract

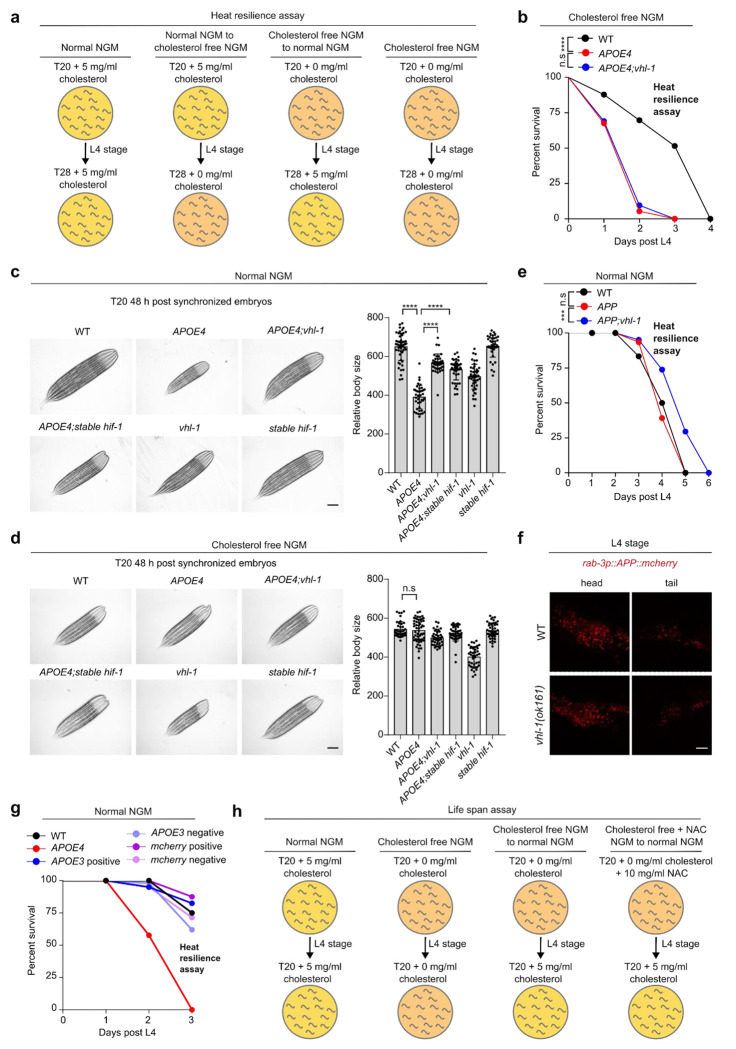
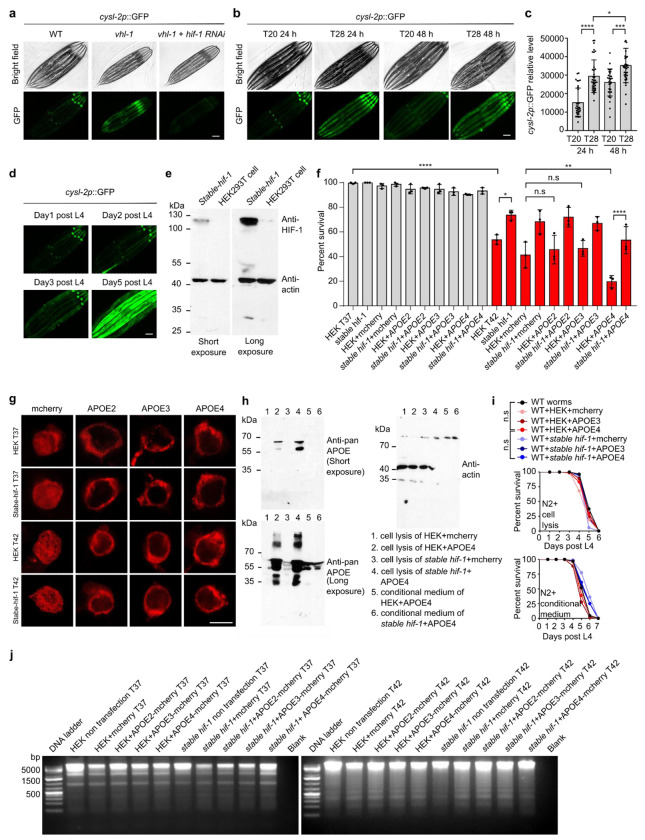
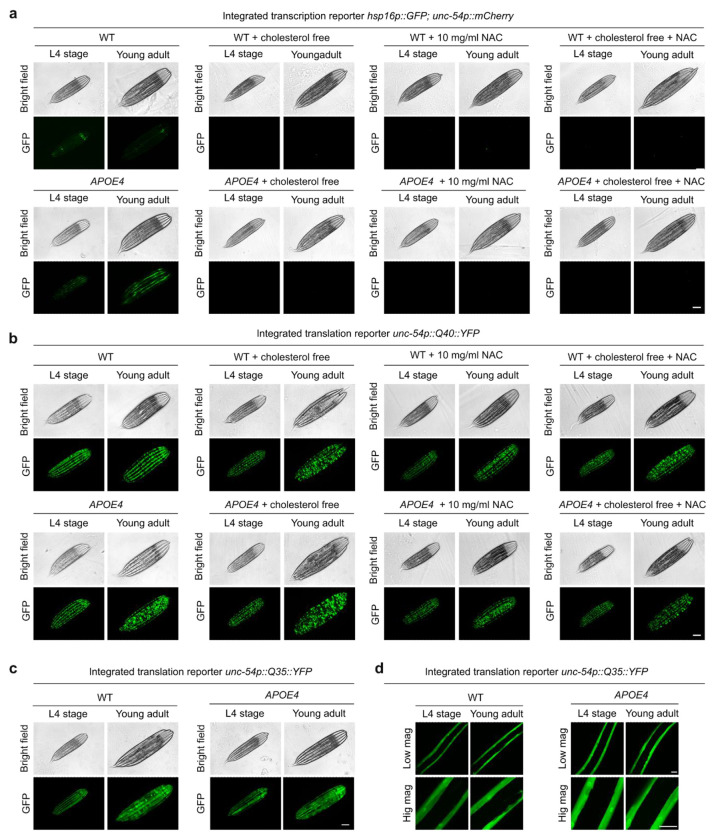
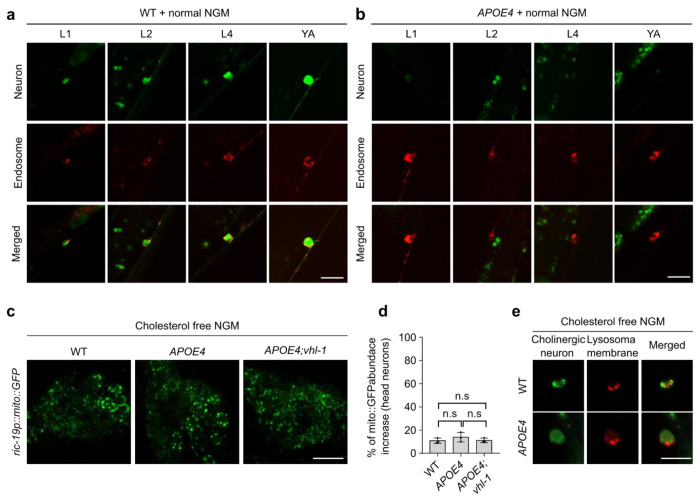
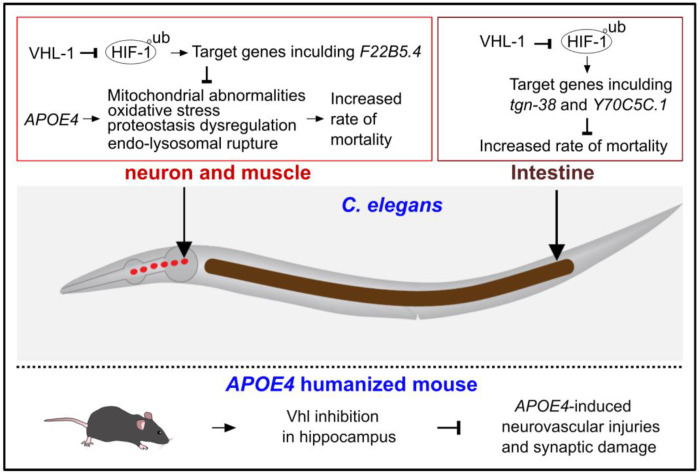
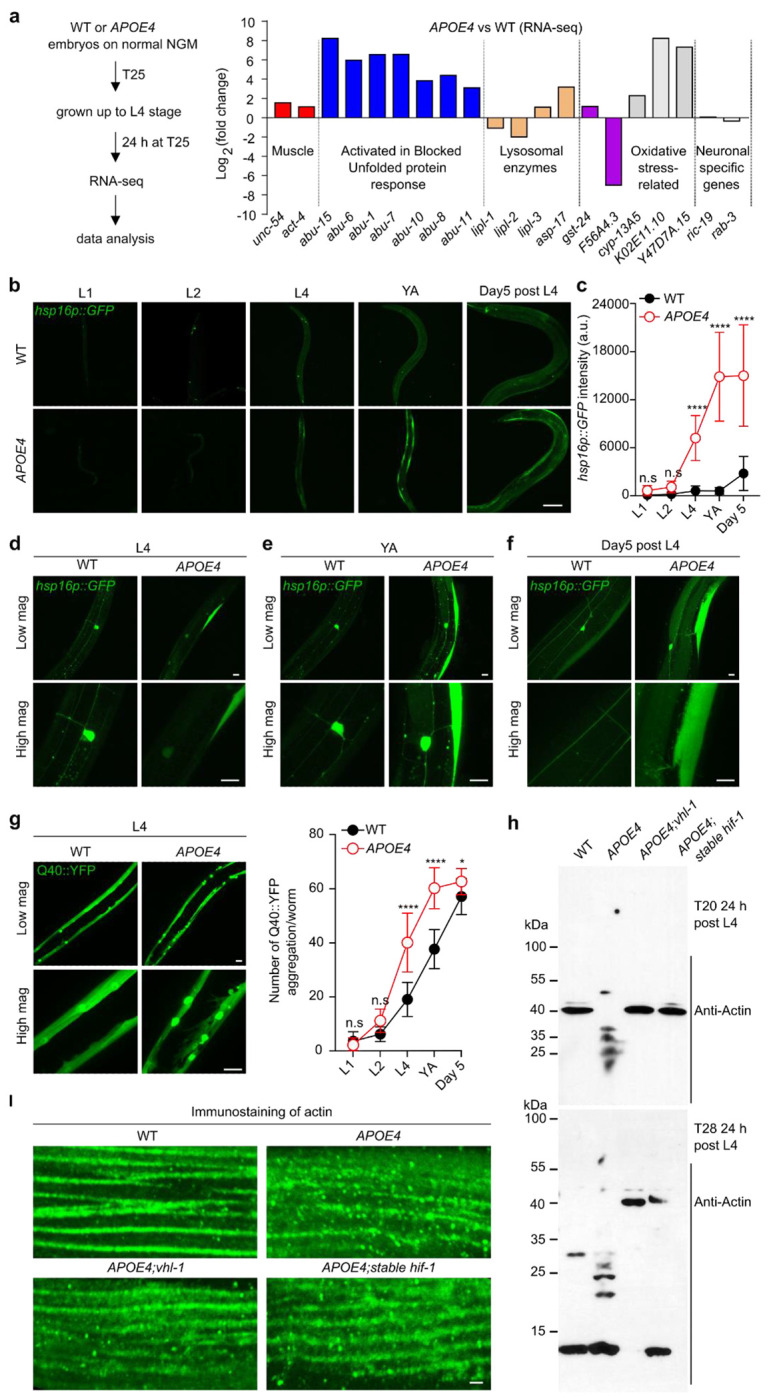
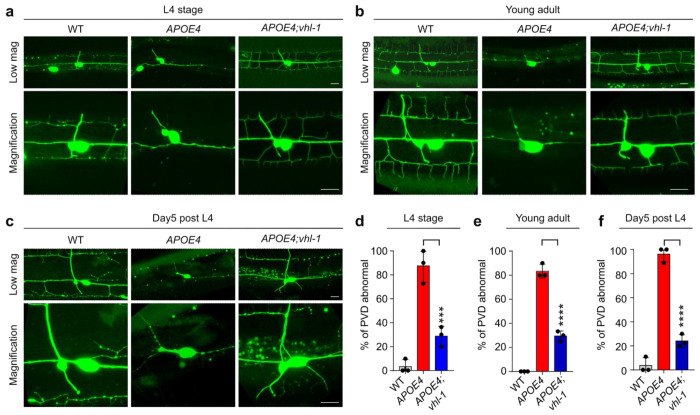
Mortality rate increases with age and can accelerate upon extrinsic or intrinsic damage to individuals. Identifying factors and mechanisms that curb population mortality rate has wide-ranging implications. Here, we show that targeting the VHL-1 (Von Hippel-Lindau) protein suppresses C. elegans mortality caused by distinct factors, including elevated reactive oxygen species, temperature, and APOE4, the genetic variant that confers high risks of neurodegeneration in Alzheimer's diseases and all-cause mortality in humans. These mortality factors are of different physical-chemical nature, yet result in similar cellular dysfunction and damage that are suppressed by deleting VHL-1. Stabilized HIF-1 (hypoxia inducible factor), a transcription factor normally targeted for degradation by VHL-1, recapitulates the protective effects of deleting VHL-1. HIF-1 orchestrates a genetic program that defends against mitochondrial abnormalities, excess oxidative stress, cellular proteostasis dysregulation, and endo-lysosomal rupture, key events that lead to mortality. Genetic Vhl inhibition also alleviates cerebral vascular injury and synaptic lesions in APOE4 mice, supporting an evolutionarily conserved mechanism. Collectively, we identify the VHL-HIF axis as a potent modifier of APOE4 and mortality and propose that targeting VHL-HIF in non-proliferative animal tissues may suppress tissue injuries and mortality by broadly curbing cellular damage.


Conflict of interest statement

Competing interests The authors declare no competing interests.

Figures

Extended Data Fig. 1.
Extended Data Fig. 1.. Characterization of pan-neuronal expression APOE4 and the modification by vhl-1 LOF or HIF-1 stabilization in C. elegans.
(a) Schematic of experimental flow of animals grown to L4 stage on normal NGM followed by transfer to normal NGM for survival (at 28 °C ) assay; schematic of experimental flow of animals grown to L4 on normal NGM followed by transfer to cholesterol free NGM for survival (at 28 °C ) assay; schematic of experimental flow of animals grown to L4 on cholesterol free NGM followed by transfer to normal NGM for survival (at 28 °C ) assay; schematic of experimental flow of animals grown to L4 on cholesterol free NGM followed by transfer to cholesterol free NGM for survival (at 28 °C ) assay. (b) Lifespan curves of indicated animals at 28 °C starting at L4 on cholesterol free NGM. *** indicates P < 0.001, n.s indicates non-significant (n > 40 animals per condition). (c) Representative bright-field images and quantification of body size of animals with indicated genotype on normal NGM. Scale bar: 100 μm. **** indicates P < 0.001 (n > 30 animals per condition). (d) Representative bright-field images and quantification body size of animals with indicated genotype on cholesterol free NGM starting at eggs. Scale bar: 100 μm. n.s indicates non-significant(n > 30 animals per condition). (e) Lifespan curves of wild type, pan neuronal expression APP (vxIs823 [rab-3p::APP::mCherry::unc-54 3’UTR] II.), vhl-1;vxIs823 at 28 °C starting at L4 on normal NGM. *** indicates P < 0.001, n.s. indicates non-significant (n > 40 animals per condition). (f) Representative confocal images of protein APP::mcherry in head and tail neuron in vxIs823 and vhl-1; vxIs823 at L4 stage on normal NGM. Scale bar: 10 μm. (g) Lifespan curves of wild type, pan neuronal expression APOE4 (vxIs824) , pan neuronal extra chromosome expression of APOE3, Ex[rab-3p::APOE3,myo3p::mcherry] positive, Ex[rab-3p::APOE3,myo3p::mcherry] negative, Ex[myo-3::mcherry] positive and Ex[myo-3::mcherry] negative animals at 28 °C starting at L4 on normal NGM, (n > 40 animals per condition). (h) Schematic of experimental flow of animals grown to L4 stage on normal NGM followed by transfer to normal NGM for life span (at 20 °C) assay; schematic of experimental flow animals grown to L4 on cholesterol free NGM followed by transfer to cholesterol free NGM for life span (at 20 °C) assay; schematic of experimental flow of animals grown to L4 on cholesterol free NGM followed by transfer to normal NGM for life span (at 20 °C) assay, schematic of experimental flow of animals grown to L4 on cholesterol free and supplementation with 10mg/ml NAC NGM followed by transfer to normal NGM for life span (at 20 °C) assay.
Extended Data Fig. 2.
Extended Data Fig. 2.. Further characterization of VHL-1, HIF-1 and APOE4
(a) Representative epifluorescence images of young adults animals showing cysl-2p::GFP constitutive upregulation in vhl-1 mutants that can be suppressed by hif-1 RNAi. Scale bar: 100 μm (b) Representative epifluorescence images showing cysl-2p::GFP upregulation after exposure for 24 hours or 48 hours at 28°C starting at L4 on normal NGM. Scale bar: 100 μm (c) Quantification of fluorescence intensities of cysl-2p::GFP under conditions indicated. * indicates P < 0.05, *** indicates P < 0.001, **** indicates P < 0.0001, n.s indicates non-significant (n > 30 animals per condition). (d) Representative epifluorescence images showing cysl-2p::GFP upregulation during aging on normal NGM. Scale bar: 100 μm (e) Representative SDS-PAGE western blots for lysates of HEK293T cells and stable-HIF-1 HEK293T cell lines with primary antibodies against HIF-1 and actin. (f) Quantification of survival rates after heat shock in HEK293T cells showing enhanced thermal resilience conferred by gain-of-function stable-HIF-1. (g) Representative confocal images of APOE2::mCherry, APOE3::mCherry, APOE4::mCherry localization in HEK293T and stable-HIF-1 HEK293T cell line upon sustained treatment at 42 °C for 8 hrs. (h) Representative SDS-PAGE western blots for lysates of HEK293T cells and stable-HIF-1 HEK293T cell lines and conditional medium under indicated conditions with primary antibodies against pan-APOE and actin. (i) Lifespan curves of wild-type animals grown to L4 (starting at embryos) on normal NGM with indicated cell supernatant followed by transfer to 28 °C (top) and lifespan curves of wild type animals grown to L4 (starting at embryos) on normal NGM with conditional medium followed by transfer to 28 °C (bottom). (j) Representative agarose gel images of genomic DNA with indicated conditions.
Extended Data Fig. 3.
Extended Data Fig. 3.. AP0E4 causes proteostasis dysregulation in body wall muscles.
(a) Representative bright-field and epifluorescence images of hsp16p::GFP in body wall muscles in WT and pan neuronal expression APOE4(vxIs824) on normal NGM, on cholesterol free NGM on cholesterol free NGM (starting at embryos) , on normal NGM supplemented with 10 mg/ml NAC (starting at embryos), on cholesterol free NGM on cholesterol free NGM and supplemented with 10 mg/ml NAC (starting at embryos) to L4 and young adult stages. Scale bar: 100 μm. (b) Representative bright-field and epifluorescence images of unc54p::Q40::YFP in body wall muscles in WT and pan neuronal expression APOE4(vxIs824) on normal NGM, on cholesterol free NGM on cholesterol free NGM (starting at embryos), on normal NGM supplemented with 10 mg/ml NAC (starting at embryos), on cholesterol free NGM on cholesterol free NGM and supplemented with 10 mg/ml NAC (starting at embryos) to L4 and young adult stages. Scale bar: 100 μm. (c-d) Representative bright-field, epifluorescence images (c) and confocal images (d) of unc54p::Q35::YFP in body wall muscles in WT and pan neuronal expression APOE4(vxIs824) on normal NGM to L4 and young adult stages. Scale bar: 100 μm(c) and 10 μm(d).
Extended Data Fig.4.
Extended Data Fig.4.. Characterization of APOE4-induced PVD defects.
(a) Representative confocal images of PVD neuron in WT and pan neuronal expression APOE4(vxIs824) at L4 stages on normal NGM. Scale bar: 10 μm. (b) Representative confocal images of PVD neuron in WT and pan neuronal expression APOE4(vxIs824) at young adult stages (24 hrs post L4) on normal NGM. Scale bar: 10 μm. (c) Representative confocal images of PVD neuron in WT and pan neuronal expression APOE4(vxIs824) at day 5 post L4 stages on normal NGM. Scale bar: 10 μm. (d) Quantification of the percentage of PVD neuron abnormal (defined as the third and fourth branches of PVD neuron missing) in WT and pan neuronal expression APOE4(vxIs824) under conditions indicated on normal NGM. *** indicates P < 0.001, **** indicates P < 0.0001 (n > 30 animals per condition). (e) Representative confocal images and quantification of abnormal PVD neuron in WT and pan neuronal expression APOE4(vxIs824), APOE4; vhl-1 at young adult stages on cholesterol free NGM starting at embryos. Scale bar: 10 μm. (f) Representative confocal images and quantification of abnormal PVD neurons with pan neuronal expression APOE4(vxIs824) at young adult stages on NGM supplementation without or with 10 mg/ml NAC starting at embryos. Scale bar: 10 μm. (g) Representative confocal images of miniSOG [unc-25p::tomm20::miniSOG::SL2::RFP];PVD grown to L4 on normal NGM, followed by room light and blue light treatments for 45 mins. Scale bar: 10 μm.
Extended Data Fig. 5.
Extended Data Fig. 5.. APOE4 causes abnormal neuronal mitochondria and endo-lysosomes that can be rescued by cholesterol reduction.
(a-b) Representative confocal high-magnification images of neuronal endosomes in WT, pan neuronal expression APOE4(vxIs824) at different stages of L1, L2, L4 and YA (Day 1 post L4) on normal NGM. Scale bar: 10 μm. (c) Representative confocal high magnification images of ric19p::mito::GFP in WT, APOE4(vxIs824) and APOE4(vxIs824);vhl-1(ok161) at young adults head neuron positions (day 1 post L4 stages) on cholesterol free NGM starting at embryos. Scale bar: 10 μm. (d) Quantification of the percentage of ric19p::mito::GFP abundance abnormal animals based on head neurons in WT, APOE4(vxIs824) and APOE4(vxIs824);vhl-1(ok161) at young adults (day 1 post L4 stages) on cholesterol free NGM starting at embryos. n.s indicates non-significant (n > 30 animals per condition). (e) Representative confocal high-magnification images of neuronal lysosomal membrane reporter in WT and APOE4(vxIs824) at young adults (day 1 post L4 stages) on cholesterol free NGM starting at embryos. Scale bar: 10 μm.
Extended Data Fig. 6.
Extended Data Fig. 6.. Schematic of the humanized APOE4 transgenic mice.
(a) Schematic showing that the mouse Apoe gene (coding exons and introns) was replaced by the human APOE4 allele by homologous recombination.
Extended Data Fig. 7.
A schematic model.
Figure 1.
Figure 1.. Loss of vhl-1 suppresses mortality induced by multiple factors (miniSOG, heat and APOE4) that cause molecular and cellular damages.
(a) Lifespan curves of N2 wild type (WT) and pan neuronal APOE4(vxIs824) transgenic animals at 28 °C starting at L4 on normal NGM, showing 50% median and 50% maximal survival decrease in APOE4(vxIs824) compared to WT. **** indicates P < 0.0001 (WT: n=62 animals, APOE4: n= 36 animals). (b) Representative confocal microscopic images of PVD neuron (wyIs592[ser-2prom-3p::myr-GFP]) in WT and pan neuronal APOE4(vxIs824) animals at young adult stages on normal NGM, showing PVD abnormalities with apparent loss of third and fourth branches. Scale bar: 10 μm. (c) Schematic of vhl-1(ok161) loss-of-function deletion allele (with the exon 2 and 3 deleted) that leads to impaired ubiquitination and stabilized HIF-1 to counteract oxidative stress. Scale bar: 100 bp. (d) Lifespan curves of WT, pan neuronal APOE4(vxIs824), vhl-1(ok161) mutants, and APOE4(vxIs824); vhl-1(ok161) animals at 28 °C starting at L4 on normal NGM. **** indicates P < 0.0001 (WT: n=40 animals, APOE4: n= 44 animals, APOE4(vxIs824); vhl-1(ok161): n=49 animals, vhl-1: n= 45 animals). (e) Lifespan curves of WT, APOE4 (vxIs824) and APOE4(vxIs824); vhl-1(ok161) with or without early life (starting at embryos) cholesterol-free NGM to L4 on cholesterol-free NGM followed by picking to normal NGM and culturing at 28°C. **** indicates P < 0.0001, n.s indicates non-significant (WT: n=51 animals, APOE4: n= 45 animals, APOE4(vxIs824); vhl-1(ok161): n=54 animals, WT + cholesterol free: n=49 animals, APOE4 + cholesterol free: n=35 animals, APOE4(vxIs824); vhl-1(ok161) + cholesterol free: n=52 animals). (f) Lifespan curves of WT, APOE4(vxIs824) and APOE4(vxIs824); vhl-1(ok161) grown to L4 on normal NGM followed by picking to cholesterol-free NGM and culturing at 28°C. **** indicates P < 0.001 (WT: n=48 animals, APOE4: n= 37 animals, APOE4(vxIs824); vhl-1(ok161): n= 47 animals). (g) Lifespan curves of WT and APOE4(vxIs824) starting at early life (starting at embryos) with indicated NAC diet concentration (0 mg/ml, 1 mg/ml and 10 mg/ml) to L4 on normal NGM supplemented with indicated NAC concentration followed by picking to normal NGM supplement with indicated concentration of NAC and culturing at 28°C. **** indicates P < 0.001, n.s indicates non-significant (WT+ 0 mg/ml: n=340 animals, WT+ 1 mg/ml: n=357 animals, WT+ 10 mg/ml: n=122 animals, APOE4 + 0 mg/ml: n=78 animals, APOE4 + 1 mg/ml: n=29 animals, APOE4 + 10 mg/ml: n=74 animals). (h) Lifespan curves of WT and APOE4(vxIs824) grown to L4 on normal NGM followed by picking to normal NGM supplemented with indicated concentration of NAC (starting at L4) and transferred to 28°C. *** indicates P < 0.001, n.s indicates non-significant (n > 40 animals per condition). (i) Percent survival of miniSOG animals [unc-25p::tomm20::miniSOG::SL2::RFP], grown to L4 starting at early life (embryos) with NAC supplement, starting at early life (embryos) with cholesterol free NGM or normal NGM, followed by room light or blue light treatments for 45 mins. (n > 40 animals per condition). (j) Percent survival of miniSOG animals [unc-25p::tomm20::miniSOG::SL2::RFP] or LOF mutant vhl-1(ok161); miniSOG animals grown to L4 on normal NGM, followed by room light or blue light treatments for 45 mins or 90 mins (n > 40 animals per condition). (k) Lifespan curves of WT, APOE4(vxIs824), APOE4(vxIs824); vhl-1(ok161) animals at constant 20 °C on normal NGM. ** indicates P < 0.01, **** indicates P < 0.0001, (n > 40 animals per condition). (l) Lifespan curves of WT, APOE4(vxIs824), and APOE4(vxIs824); vhl-1(ok161) animals with or without (starting at embryos) cholesterol diet to L4 followed by picking to normal NGM and culturing at 20°C. * Indicates P < 0.05, **** indicates P < 0.0001, (n > 40 animals per condition).
Figure 2.
Figure 2.. Stabilized HIF-1 recapitulates the effects of VHL-1 inactivation.
(a) Schematic of the hif-1(ia4) LOF deletion allele (1,231 bp deletion of the second, third, and fourth exons) and its impaired capacity to counteract oxidative stress. Scale bar: 100 bp. (b) Representative epifluorescence images and quantification showing that cysl-2p::GFP constitutive upregulation in vhl-1 mutants is blocked by hif-1(ia4). Scale bar: 100 μm. ****indicates P < 0.0001 (n > 30 animals per condition). (c) Lifespan curves of WT, LOF mutant vhl-1(ok161) and double LOF mutant vhl-1 (ok161); hif-1(ia4) animals at 28 °C starting at L4 on normal NGM. **** indicates P < 0.0001 (n > 40 animals per condition). (d) Schematic of non-degradable form of HIF-1 (P621A) expressed by the unc-14 promoter (predominantly active in neurons) in hif-1 mutant background (otIs197 [unc-14p::hif-1(P621A) + ttx-3p::RFP]. Scale bar: 100 bp. (e) Lifespan curves of WT, non-degradable form of HIF-1(P621A) (otIs197) or vhl-1(ok161) LOF mutant animals at 28 °C starting at L4 on normal NGM. **** indicates P < 0.0001, n.s indicates non-significant (n > 40 animals per condition). (f) Lifespan curves of WT, APOE4(vxIs824); otIs197 and APOE4(vxIs824) animals at 28 °C starting at L4 on normal NGM. **** indicates P < 0.0001, n.s indicates non-significant (n > 40 animals per condition). (g) Lifespan curves of WT, APOE4(vxIs824), APOE4(vxIs824); vhl-1(ok161) and APOE4(vxIs824); otIs197 animals grown to L4 on normal NGM followed by picking to cholesterol free NGM and culturing at 28°C. *** indicates P < 0.001, n.s indicates non-significant (n > 40 animals per condition). (h) Lifespan curves of WT, APOE4(vxIs824), APOE4(vxIs824); vhl-1(ok161) and APOE4(vxIs824); otIs197 animals starting at early life (embryos) with cholesterol free NGM to L4 followed by picking to normal NGM and culturing at 28°C. n.s indicates non-significant (n > 40 animals per condition). (i) Lifespan curves of WT, APOE4(vxIs824), APOE4(vxIs824); vhl-1(ok161) and APOE4(vxIs824); stable hif-1 (otIs197) animals starting at early life (embryos) with cholesterol free NGM to L4 followed by picking to cholesterol free NGM and culturing at 28°C. **** indicates P < 0.0001, n.s indicates non-significant, (n > 40 animals per condition). (j) Lifespan curves of WT, APOE4(vxIs824), APOE4(vxIs824); vhl-1(ok161) and APOE4(vxIs824); stable hif-1 (otIs197) animals starting at early life (starting at embryos) with indicated NAC concentration diet to L4 on normal NGM followed by picking to normal NGM supplemented with indicated concentration of NAC and transferred to 28°C (left). Lifespan curves of WT, APOE4(vxIs824) and APOE4(vxIs824); stable hif-1 (otIs197) animals grown to L4 on normal NGM followed by picking to normal NGM supplemented with indicated concentration of NAC (starting at L4 stage) and culturing at 28°C. (n > 40 animals per condition). (k) Lifespan curves of WT, APOE4(vxIs824), APOE4(vxIs824); vhl-1(ok161) and APOE4(vxIs824); stable hif-1 (otIs197) animals at constant 20 °C on normal NGM. * Indicates P < 0.05, ** indicates P < 0.01, *** indicates P < 0.001, **** indicates P < 0.0001, n.s indicates non-significant (n > 40 animals per condition). (l) Lifespan curves of WT, APOE4(vxIs824), APOE4(vxIs824); vhl-1(ok161) and APOE4(vxIs824); stable hif-1 (otIs197) animals at constant 20 °C on cholesterol free NGM. ** indicates P < 0.01, *** indicates P < 0.001, **** indicates P < 0.0001, n.s indicates non-significant (n > 40 animals per condition). (m) Lifespan curves of WT, APOE4(vxIs824), APOE4(vxIs824); vhl-1(ok161) and APOE4(vxIs824); stable hif-1 (otIs197) animals starting at early life (start at embryos) with cholesterol free NGM to L4 followed by picking to normal NGM and culturing at 20°C. ** indicates P < 0.01, *** indicates P < 0.001, **** indicates P < 0.0001, n.s indicates non-significant (n > 40 animals per condition). (n) Lifespan curves of WT, APOE4(vxIs824), APOE4(vxIs824); vhl-1(ok161) and APOE4(vxIs824); stable hif-1 (otIs197) animals starting at early life (embryos) with cholesterol free and 10 mg/ml NAC diets to L4 on cholesterol free NGM followed by picking to normal NGM and culturing at 20°C of incubator. n.s indicates non-significant (n > 40 animals per condition).
Figure 3.
Figure 3.. APOE4 causes non-cell autonomous proteostasis dysregulation and actin cleavage suppressed by vhl-1.
(a) Schematic for RNA-seq transcriptome profiling of WT and pan neuronal transgenic APOE4 (vxIs824), showing representative genes of various classes dysregulated in APOE4 compared to WT. (b) Representative confocal low-magnification images of hsp16p::GFP in body wall muscles in WT and APOE4 (vxIs824) animals at different stages of L1, L2, L4, young adult (day1 post L4) and Day 5 post L4 on normal NGM. Scale bar: 100 μm. (c) Quantification of fluorescence intensities of hsp16p::GFP in body wall muscles under conditions indicated. *** indicates P < 0.001, n.s indicates non-significant (n > 30 animals per condition). (d-f) Representative confocal high-magnification images of hsp16p::GFP in body wall muscles in WT and APOE4 (vxIs824) at different stages of L4, young adult (day1 post L4) and Day 5 post L4 on normal NGM. Scale bar: 10 μm. (g) Representative confocal high-magnification images of unc54p::Q40::YFP in body wall muscles in WT and APOE4 (vxIs824) at stages of L4 on normal NGM, and quantification of aggregation number of unc54p::Q40::YFP in body wall muscles under conditions indicated. Scale bar: 10 μm. * indicates P < 0.05, **** indicates P < 0.0001, n.s indicates non-significant (n > 30 animals per condition). (h) Representative SDS-PAGE western blots of WT, APOE4(vxIs824), APOE4(vxIs824); vhl-1(ok161) and APOE4(vxIs824); stable hif-1 (otIs197). (i) Representative confocal high-magnification images in body wall muscles of WT, APOE4(vxIs824), APOE4(vxIs824); vhl-1(ok161) and APOE4(vxIs824); stable hif-1 (otIs197) animals immunostained with primary antibody against actin at young adult stages (24 hrs post L4) on normal NGM. Scale bar: 1 μm.
Figure 4.
Figure 4.. APOE4 causes PVD morphological deterioration suppressed by vhl-1.
(a) Representative confocal images of PVD neuron in WT, APOE4(vxIs824), APOE4(vxIs824); vhl-1(ok161) at L4 stages on normal NGM showing vhl-1 LOF mutants with rescued APOE4-induced PVD morphological deterioration. Scale bar: 10 μm. (b) Representative confocal images of PVD neuron in WT, APOE4(vxIs824), APOE4(vxIs824); vhl-1(ok161) at young adult stages on normal NGM showing vhl-1 LOF mutants with rescued APOE4-induced PVD morphological deterioration. Scale bar: 10 μm. (c) Representative confocal images of PVD neuron in WT, APOE4(vxIs824), APOE4(vxIs824); vhl-1(ok161) at day 5 post L4 stages on normal NGM showing vhl-1 LOF mutants with rescued APOE4-induced PVD morphological deterioration. Scale bar: 10 μm. (d-f) Quantification of % of PVD neuron abnormal (with the third and fourth branches of PVD neurons missing or severed) in WT, APOE4(vxIs824), APOE4(vxIs824); vhl-1(ok161) under conditions indicated on normal NGM. *** indicates P < 0.001, (n > 30 animals per condition).
Figure 5.
Figure 5.. APOE4 causes neuronal mitochondria defects suppressed by vhl-1.
(a) Schematic of neuronal organelle-specific fluorescent markers. (b) Representative confocal low and high magnification images of neuronal tissue specific expression mitochondria reporter (ric19p::mito::GFP) in WT and APOE4(vxIs824) animals at young adult (day1 post L4 stages) with indicated position. Scale bar: 100 μm (low magnification) and 10 μm (high magnification). (c) Quantification of percentage of ric19p::mito::GFP abnormal based on head neurons in WT and APOE4(vxIs824) animals at different stages of L1, L2, L4 and young adult (day1 post L4 stages) on normal NGM. **** indicates P < 0.0001, n.s indicates non-significant (n > 30 animals per condition). (d) Representative confocal low and high magnification images of hypodermal cell mitochondria based on dpy7p::mito::mkate2 showing no apparent change in WT and APOE4(vxIs824) at young adult stages on normal NGM. Scale bars: 100 μm (low magnification) and 10 μm (high magnification). (e) Representative confocal images of intestinal mitochondria based on mai-2::GFP showing no apparent change in WT and APOE4(vxIs824) at young adult stages on normal NGM. Scale bar: 10 μm. (f) Representative confocal images of ric19p::mito::GFP in WT, APOE4(vxIs824) and APOE4(vxIs824);vhl-1(ok161) at young adult stages with head neuron positions (day1 post L4 stages) on normal NGM. Scale bar: 10 μm. (g) Quantification of percentage of ric19p::mito::GFP animals abnormal based on head neurons in WT, APOE4(vxIs824) and APOE4(vxIs824);vhl-1(ok161) at young adult stages (day1 post L4 stages) on normal NGM. ** indicates P < 0.01 (n > 30 animals per condition). (h) Representative confocal images of neuronal lysosomal membrane reporter in WT and APOE4(vxIs824) at different stages of L1, L2, L4 and Day 1 post L4 on normal NGM. Scale bar: 10 μm.
Figure 6.
Figure 6.. HIF-1 target gene F22B5.4 in neurons protects against thermal stress.
(a) Quantitative RT-PCR measurements of indicated gene expression levels in WT, vhl-1(ok161) and otIs197 animals upon sustained treatment at 28 °C or 20 °C for 24 hours starting at L4 on normal NGM. ** indicates P < 0.01, *** indicates P < 0.001, **** indicates P < 0.0001, n.s indicates non-significant. (b-c) Lifespan curves of WT, tgn-38(gk5592) LOF mutants, vhl-1(ok161) mutants, and double LOF mutant vhl-1; tgn-38 at 28 °C starting at L4 on normal NGM. **** indicates P < 0.0001 (n > 40 animals per condition). (d) Lifespan curves of WT and Y70C5C.1(ve718) LOF mutants at 28 °C starting at L4 on normal NGM. **** indicates P < 0.0001 (n > 40 animals per condition). (e) Lifespan curves of WT, vhl-1(ok161) mutants, vhl-1(ok161) mutants with RNAi against tgn-38 and Y70C5C.1 at 28 °C starting at L4. **** indicates P < 0.0001 (n > 40 animals per condition). (f) Representative confocal high magnification images of the F22B5.4 translational reporter with GFP observed predominantly in head neurons in WT animals. Scale bar: 10 μm. (g) Quantitative RT-PCR measurements of F22B5.4 gene expression levels under conditions indicated on normal NGM. **** indicates P < 0.0001, n.s. indicates non-significant. (h) Lifespan curves of WT, three representative F22B5.4 translational reporter lines and ric19p::F22B5.4 over-expression gain-of-function animals at 28 °C starting at L4 on normal NGM. **** indicates P < 0.0001 (n > 40 animals per condition). (i) Lifespan curves of WT, APOE4(vxIs824) and APOE4(vxIs824); Ex[ric19p::F22B5.4, unc54p::mcherry] animals at 28 °C starting at L4 on normal NGM. *** indicates P < 0.001 (n > 40 animals per condition).
Figure 7.
Figure 7.. Vhl inhibition mitigates cerebral vascular and synaptic damages in humanized APOE4 transgenic mice.
(a) Schematic for the knockdown of Vhl by AAV-shRNA in humanized APOE4 transgenic mice. (b-c) Representative images of CD13+ pericyte coverage (red) of lectin+ endothelial capillary profiles (green) in the hippocampus (b). Quantification of pericyte coverage on capillaries (c). * indicates P < 0.05, n = 3 mice per group. Scale bar: 50 μm. (d-e) Representative western blot showing occludin proteins from mouse brain tissues (d) and quantification of relative protein levels of Occludin (e). * indicates P < 0.05, *** indicates P < 0.001, n = 3 mice per group. (f) Schematic for the Evans blue leakage experiment and quantification of Evans blue leakage in mouse brain tissues. * indicates P < 0.05, n = 5 mice per group. (g-h) Representative images of SMI312+ axons (red) and NeuN+ neurons (green) in the hippocampus (g), with quantification of SMI312+ axon density (h). * indicates P < 0.05, n = 3 mice per group. Scale bar: 100 μm. (i-j) Representative western blot showing Synaptophysin proteins from mouse brain tissues (i). Quantification of relative protein levels of Synaptophysin (j). * indicates P < 0.05, ** indicates P < 0.01, n = 3 mice per group. Data were presented as means ± S.E.M.

Similar articles

References

    1. Schächter F., Faure-Delanef L., Guénot F., Rouger H., Froguel P., Lesueur-Ginot L., and Cohen D. (1994). Genetic associations with human longevity at the APOE and ACE loci. Nat Genet 6, 29–32. 10.1038/ng0194-29. - DOI - PubMed
    1. Strittmatter W.J., Saunders A.M., Schmechel D., Pericak-Vance M., Enghild J., Salvesen G.S., and Roses A.D. (1993). Apolipoprotein E: high-avidity binding to beta-amyloid and increased frequency of type 4 allele in late-onset familial Alzheimer disease. Proc Natl Acad Sci U S A 90, 1977–1981. 10.1073/pnas.90.5.1977. - DOI - PMC - PubMed
    1. Corder E.H., Saunders A.M., Strittmatter W.J., Schmechel D.E., Gaskell P.C., Small G.W., Roses A.D., Haines J.L., and Pericak-Vance M.A. (1993). Gene dose of apolipoprotein E type 4 allele and the risk of Alzheimer’s disease in late onset families. Science 261, 921–923. 10.1126/science.8346443. - DOI - PubMed
    1. Sebastiani P., Gurinovich A., Nygaard M., Sasaki T., Sweigart B., Bae H., Andersen S.L., Villa F., Atzmon G., Christensen K., et al. (2019). APOE Alleles and Extreme Human Longevity. J Gerontol A Biol Sci Med Sci 74, 44–51. 10.1093/gerona/gly174. - DOI - PMC - PubMed
    1. Bejanin A., lulita M.F., Vilaplana E., Carmona-Iragui M., Benejam B., Videla L., Barroeta I., Fernandez S., Altuna M., Pegueroles J., et al. (2021). Association of Apolipoprotein E ε4 Allele With Clinical and Multimodal Biomarker Changes of Alzheimer Disease in Adults With Down Syndrome. JAMA Neurol 78, 937–947. 10.1001/jamaneurol.2021.1893. - DOI - PMC - PubMed

Publication types