[Preprint]. 2024 Jun 6:2024.02.14.580397.
doi: 10.1101/2024.02.14.580397.

Brainwide mesoscale functional networks revealed by focal infrared neural stimulation of the amygdala

Affiliations

Brainwide mesoscale functional networks revealed by focal infrared neural stimulation of the amygdala

An Ping et al. bioRxiv. .

Update in

Abstract

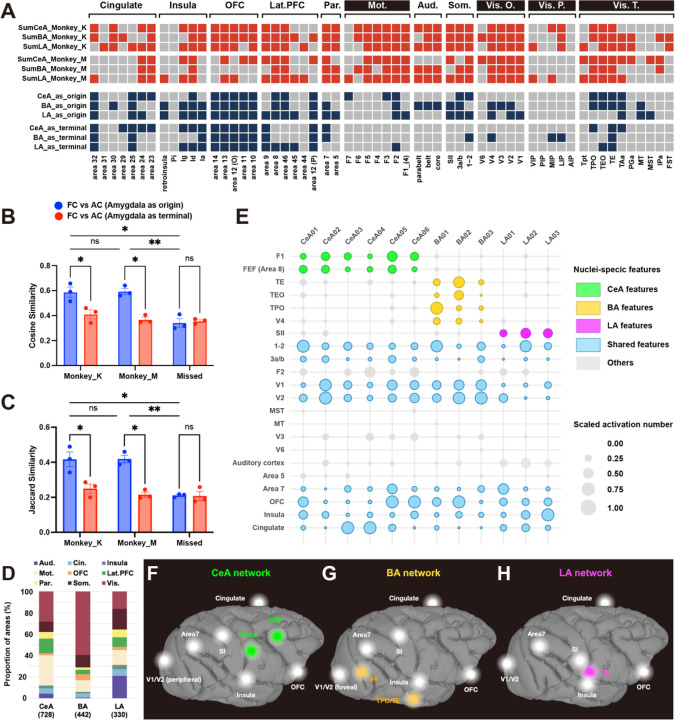
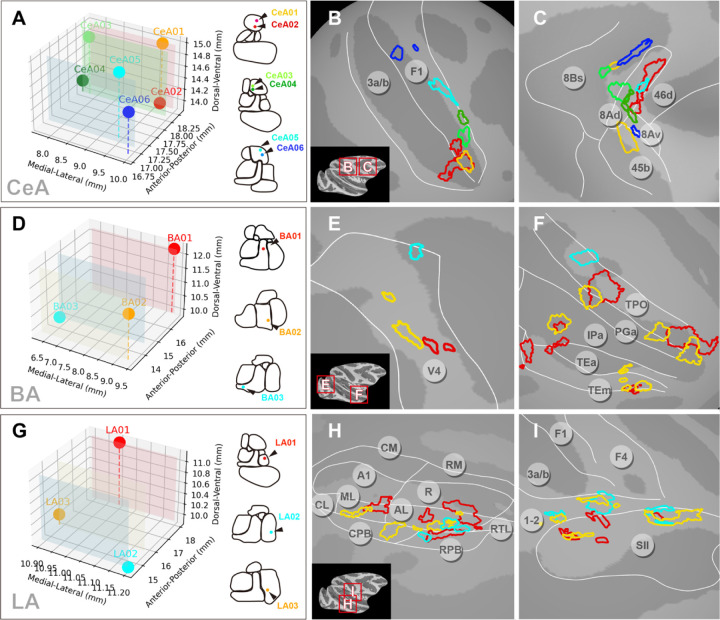
The primate amygdala serves to evaluate emotional content of sensory inputs and modulate emotional and social behaviors; it modulates cognitive, multisensory and autonomic circuits predominantly via the basal (BA), lateral (LA), and central (CeA) nuclei, respectively. Based on recent electrophysiological evidence suggesting mesoscale (millimeters-scale) nature of intra-amygdala functional organization, we have investigated the connectivity of these nuclei using Infrared Neural Stimulation of single mesoscale sites coupled with mapping in ultrahigh field 7T functional Magnetic Resonance Imaging (INS-fMRI). Stimulation of multiple sites within amygdala of single individuals evoked 'mesoscale functional connectivity maps', allowing comparison of BA, LA and CeA connected brainwide networks. This revealed a mesoscale nature of connected sites, complementary spatial patterns of functional connectivity, and topographic relationships of nucleus-specific connections. Our data reveal a functional architecture of systematically organized brainwide networks mediating sensory, cognitive, and autonomic influences from the amygdala.


Conflict of interest statement

Competing interests: Authors declare that they have no competing interests.

Figures

Fig. 1.
Fig. 1.. Identifying functionally connected sites in the brain following INS stimulation of single mesoscale sites the amygdala.
(A) A coronal section through the caudal amygdala. (B) Parcellation of the amygdala at the most caudal site shown in A. CeA: central amygdala. AB: accessory basal amygdala. BA: basal amygdala. LA: lateral amygdala. Hipp: hippocampus. (C) Raw structural image indicating the optical fiber inserted through a grid in a chamber. (D) Activation at the laser tip in CeA (red voxel, intensity: 0.2 J/cm2, p<1×10⁻⁶). (E) BOLD time course at the laser tip in D. Above: 15 consecutive trials; Below: averaged time course (the dotted rectangle spans the duration of INS). Each red line: one trial of 4 pulse trains (see Methods). (F-H) Coronal, sagittal and horizontal view of a remote cluster activated in response to stimulation in D (p<1×10⁻⁴). (I) Activation cluster (white arrow) in F-H shown on inflated brain surface. (J) BOLD time course at connected cluster (white arrow) in F-H. Above: all 15 trials; Below: averaged time course.
Fig. 2.
Fig. 2.. Mesoscale brainwide connections of the amygdala.
(A) The white dots represent the INS stimulation sites in the right amygdala. CeA (green contour, 6 sites), BA (yellow contour, 3 sites), LA (red contour, 3 sites) LA: lateral amygdala. BA: basal amygdala. AB: accessory basal amygdala. CeA: central amygdala. MeA: medial amygdala. ICA: intercalated cell masses. AAA: anterior amygdala area. (B) The stacked histogram for patch size of brainwide cortical activations. The x axis represents the size of patches in millimeter square. The y axis represents the number of patches of different sizes. Each color represents a stimulation site in monkey K, namely 6 sites in CeA (upper row, shades of green), 3 sites in BA (middle row, shades of yellow) and 3 sites in LA (lower row, shades of red). (C) Whole brain activations evoked by single stimulation sites (1 site for each of CeA, BA and LA) mapped on inflated hemisphere (ipsilateral to the stimulation) of monkey K and monkey M. Both medial view and lateral view are presented. Ps: principal sulcus. As: arcuate sulcus. Cs: central sulcus. IPs: intraparietal sulcus. syf: sylvian fissure. sts: superior temporal sulcus. Ls: lunate sulcus. IOs: inferior occipital sulcus. Cgs: cingulate sulcus. POs: parietal-occipital sulcus. POm: medial parieto-occipital sulcus. calc: calcarine.
Fig. 3.
Fig. 3.. Cortical distributions of CeA, BA and LA networks. (A) A comparison of connectivity revealed by INS-fMRI and by anatomical tracers.
Upper 6 rows: red represents presence of functional connections in monkey K and monkey M. Lower 6 rows: blue represents compiled results of anatomical connections originating from the amygdala and anatomical connections to the amygdala originating from the cortex (based on http://cocomac.g-node.org, see method). T.: visual system (temporal). Vis. P.: visual system (parietal). Vis. O.: visual system (occipital). Som.: somatosensory cortex. Lat-PFC: lateral prefrontal cortex. Par.: parietal cortex. OFC: orbital frontal cortex. Mot.: motor cortex. Aud.: auditory cortex. Pi: parainsula. Ig: granular insula. Id: dysgranular insula. Ia: agranular insula. (B-C) Jaccard similarity and cosine similarity between FC (functional connectivity) and AC (anatomical connectivity), the red color represents similarity between FC and AC to the amygdala originating from the cortex, the blue color represents similarity between FC and AC that originating from the amygdala. Results are from 2 monkeys (monkey K and monkey M), and from stimulations sites out of the amygdala (missed) in monkey K. (D) Proportional composition of cortical connections from CeA, BA and LA in monkey K (e.g., for all stimulation sites in CeA, the #voxels in an area connected to CeA / total voxels connected to CeA). (E) Global distribution of activation evoked by different stimulation sites. Each column illustrates activation from a single site (6 in CeA, 3 in BA, 3 in LA). The colors represent that the brain areas have outstanding and consistent activations from stimulating sites in CeA (green), BA (yellow), LA (magenta). Blue color represent that all stimulation sites evoke activations in this brain area. The size of bubbles represents the number of voxels evoked by each stimulation site in each brain area. The numbers were scaled by each stimulation site. (F-H) Summarized global networks involving CeA (F), BA (G), and LA (H), respectively. The colored nodes represent areas dominated by CeA, BA, or LA, the white nodes represent areas receiving similar prominence of connections from CeA, BA, and LA.
Fig. 4.
Fig. 4.. Functional connections with cingulate cortex, insula, and OFC.
Topography of connected areas in cingulate cortex (B-E), insula (G-J), and OFC (L-O). Segmentation of the brain areas are shown in the first column (A, F, K). Merged views of CeA, BA and LA are shown in the last column (E, J, O). Iai: intermediate agranular insula. Iapl: posterior lateral agranular insula. Ial: lateral agranular insula. The results are masked by cingulate, insula and OFC for the purpose to highlight results in these areas.
Fig. 5.
Fig. 5.. Local cortical topography of connections from single amygdala nuclei.
Activations from different stimulation sites within each of CeA, BA, and LA were mapped onto the cortical surface (P<1×10⁻³). (A, D, G) Stimulation sites are shown in 3d coordinates (left) and in rostro-caudal contour cartoons (right). (A-C) Six stimulation sites in CeA revealed connected sites mostly in F1 (B) and FEF Area 8 (C). (D-F) Three stimulation sites in BA revealed connected sites in area V4 (E) and in ventral visual pathway TP, PG, IP, TE (F). (G-I) Three stimulation sites in LA revealed connected sites in auditory belt/parabelt areas AL, ML, CPB, RPB (H) and somatosensory areas 1–2 and SII (I). A1: primary auditory area. R: rostral area. CM: caudomedial belt region. AL: anterolateral belt region. ML: middle lateral belt region. RPB: rostral parabelt region. CPB: caudal parabelt region.
Fig. 6.
Fig. 6.. Connectivity patterns in cortical areas with activations from CeA, BA and LA.
Topography of connected sites in V1/V2 (A), SI/SII (B), and area7 (C), respectively.

References

    1. LeDoux J. The amygdala. Curr Biol 17, R868–874, doi:10.1016/j.cub.2007.08.005 (2007). - DOI - PubMed
    1. Adolphs R. & Anderson D. J. in The Neuroscience of Emotion A New Synthesis 251–278 (Princeton University Press, 2018).
    1. Janak P. H. & Tye K. M. From circuits to behaviour in the amygdala. Nature 517, 284–292, doi:10.1038/nature14188 (2015). - DOI - PMC - PubMed
    1. Bickart K. C., Dickerson B. C. & Barrett L. F. The amygdala as a hub in brain networks that support social life. Neuropsychologia 63, 235–248, doi:10.1016/j.neuropsychologia.2014.08.013 (2014). - DOI - PMC - PubMed
    1. Gothard K. M. Multidimensional processing in the amygdala. Nat Rev Neurosci 21, 565–575, doi:10.1038/s41583-020-0350-y (2020). - DOI - PMC - PubMed

Publication types