[Preprint]. 2024 Feb 28:rs.3.rs-3818622.
doi: 10.21203/rs.3.rs-3818622/v1.

Transcriptome- and proteome-wide effects of a circular RNA encompassing four early exons of the spinal muscular atrophy genes

Affiliations

Transcriptome- and proteome-wide effects of a circular RNA encompassing four early exons of the spinal muscular atrophy genes

Diou Luo et al. Res Sq. .

Update in

Abstract

Spinal muscular atrophy (SMA) genes, SMN1 and SMN2, produce multiple circular RNAs (circRNAs), including C2A-2B-3-4 that encompasses early exons 2A, 2B, 3 and 4. Here we report the transcriptome- and proteome-wide effects of overexpression of C2A-2B-3-4 in inducible HEK293 cells. Our RNA-Seq analysis revealed altered expression of ~ 15% genes (4,172 genes) by C2A-2B-3-4. About half of the affected genes by C2A-2B-3-4 remained unaffected by L2A-2B-3-4, a linear transcript encompassing exons 2A, 2B, 3 and 4 of SMN1/SMN2. These fifindings underscore the unique role of the structural context of C2A-2B-3-4 in gene regulation. A surprisingly high number of upregulated genes by C2A-2B-3-4 were located on chromosomes 4 and 7, whereas many of the downregulated genes were located on chromosomes 10 and X. Supporting a cross-regulation of SMN1/SMN2 transcripts, C2A-2B-3-4 and L2A-2B-3-4 upregulated and downregulated SMN1/SMN2 mRNAs, respectively. Proteome analysis revealed 61 upregulated and 57 downregulated proteins by C2A-2B-3-4 with very limited overlap with those affected by L2A-2B-3-4. Independent validations confirmed the effect of C2A-2B-3-4 on expression of genes associated with chromatin remodeling, transcription, spliceosome function, ribosome biogenesis, lipid metabolism, cytoskeletal formation, cell proliferation and neuromuscular junction formation. Our findings reveal a broad role of C2A-2B-3-4, a universally expressed circRNA produced by SMN1/SMN2.

Keywords: SMA; SMN; Survival Motor Neuron; circRNA; circular RNA; proteome; spinal muscular atrophy; transcriptome.


Conflict of interest statement

Competing interests The authors declare no competing interests.

Figures

Figure 1
Figure 1. An overview of backsplicing event to form C2A-2B-3–4 from SMN1/SMN2 genes.
Top panel: Genomic overview of the early exons of SMN1/SMN2 genes. Exons are depicted in colored shapes and introns in broken lines. Sizes of exons and introns are marked above exons and below introns, respectively. The backsplicing event to form C2A-2B-3–4 is marked with a red arrow. Bottom panel: A diagram of C2A-2B-3–4. Predicted miRNA binding sites are indicated with thick lines . Gray color represents miRNAs of unknown function. Purple color represents miRNAs with identified functions related to SMN biology and/or neurodegeneration. Green color represents miRNAs whose targets are located across the backsplice junction. Thus, these miRNAs bind differentially to circRNA as compared to their linear mRNA counterparts.
Figure 2
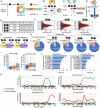
Figure 2. The effect of overexpression of SMN C2A-2B-3–4 on the transcriptome.
(A) Diagram showing overexpression of C2A-2B-3–4 and L2A-2B-3–4 from TC4–2A and TL4–2A cells, respectively. Control T-REx cells do not overexpress SMN1/SMN2 transcripts. (B) A representative gel showing the results of semi-quantitative PCR for detection circRNA C2A-2B-3–4. Primer annealing sites and cell lines are shown on the top of gel, while lane number is indicated at the bottom. The size marker (M) is indicated on the left side of gel, while the identity of each band on the right side. (C) Identification of vector-specific linear transcripts of SMN1/SMN2 generated in different cells. Labeling is the same as in (B). (D) Quantification of C2A-2B-3–4 expression by qPCR. A diagrammatic representation of circRNA of interest and primer annealing sites are indicated on the top of bar graph. The bar graph shows the number of C2A-2B-3–4 transcripts per cell as determined by qPCR. Error bars represent standard error of the mean. Statistical significance: **, p<0.01. (E) Summary of RNA-Seq measuring the impact of overexpression of C2A-2B-3–4 and its linear counterpart L2A-2B-3–4 on the transcriptome. “Significant” indicates genes with Benjamini and Hochberg adjusted p value (adj. p) < 0.05, out of 19,025 total genes examined for differential expression. “FC >2” indicates genes with more than 2-fold up- or downregulation. (F) MA plots depicting gene expression changes upon overexpression of C2A-2B-3–4 or L2A-2B-3–4, or a direct comparison between the two. Y axis: log2 fold change. X axis: mean normalized read counts per gene. Red dots indicate genes with significantly altered expression. (G) Venn diagrams examining the overlap between genes altered in the induced TC4–2A and TL4–2A cells compared to control, with upregulated (left panel) and downregulated (right panel) genes indicated. Cell types along with the total number of affected genes are indicated at the top. (H) Proportion of protein-coding genes, pseudogenes and lncRNAs among differentially affected genes in TC4–2A and TL4–2A cells compared to T-REx control (I) Box plots summarizing the distributions of gene length (left panel) and transcript count (right panel). Boxed area shows the interquartile range (IQR) spanning the middle 50% of values for the given quantification. The median is indicated with a line. Whiskers above and below the box represent upper and lower bound, minus outliers. (J) Over-representation analysis (ORA) for specific chromosomal locations of upregulated and downregulated genes. Genomic regions are indicated at the left of each graph. X axis: −log10 of p values of enrichment. Left panel examines enrichment in genes upregulated by TC4–2A overexpression, right panel downregulated genes. (K) Enrichment by chromosomal position for four chromosomes identified in ORA. Y axis: enrichment for a given chromosomal region in upregulated (green) or downregulated (red) genes as compared to all genes expressed in T-REx cells. Dashed line indicates enrichment ratio of 1.0, or average enrichment. X axis: chromosomal position in million base pairs (Mbp). Genes were assigned based on their start position and sorted into bins of 10 Mbp. A graphical overview of each chromosome is depicted below each graph. Boxes indicate chromosomal regions, and red triangles indicate centromere position.
Figure 3
Figure 3. Over-representation analysis (ORA) of GO terms and KEGG pathways.
ORA for specific GO terms and Kyoto Encyclopedia of Genes and Genomes (KEGG) pathways. Categories of genes are indicated at the left of each graph. X axis: −log10 of p values of enrichment. Left panels examine enrichment in genes upregulated by overexpression of C2A-2B-3–4, right panels downregulated genes by C2A-2B-3–4.
Figure 4
Figure 4. Validation of genes upregulated in RNA-seq.
qPCR quantification of mRNA expression levels of significantly upregulated genes upon overexpression of C2A-2B-3–4 is shown in bar graphs. The gene symbol is indicated above each graph. Cell types are indicated under the X-axis. The Y -axis represents the relative expression as compared with control T-REx cells. Error bars represent standard error of the mean. Statistical significance: n = 3 *, p<0.05; **, p<0.01.
Figure 5
Figure 5. Validation of genes downregulated in RNA-seq.
qPCR quantification of mRNA expression levels of significantly downregulated genes upon overexpression of C2A-2B-3–4 is shown in bar graphs. Labeling is the same as in Figure 4.
Figure 6
Figure 6. Effect of overexpression of C2A-2B-3–4 and L2A-2B-3–4 on proteome.
(A) A heatmap of hierarchical cluster analysis of each individual sample of the biological triplicate across three cell lines. The cell lines are indicated on the left side of the heat map. The top 50 proteins are shown. The Euclidean distance was used as similarity measuring parameter, while Ward’s linkage (clustering to minimize the sum of squares of any two clusters) was the clustering algorithm. Each colored square indicates relative abundance of an identified protein. Cell line and replicate was marked on the left of heatmap. On the right side showing a color key (high, red; low, blue) indicates the scale of relative abundance determined by Euclidean distance. (B) A three-dimensional (3D) scores plot of Partial Least-Squares Discriminant Analysis (PLSDA) of each individual sample. The top three most discriminant components were selected to plot data in three directions. Each individual replicate is indicated with a colored shape. (C) Venn diagrams showing the overlap between genes significantly altered in the TC4–2A and TL4–2A cells compared to control, with overall regulated (center panel), upregulated (left panel) and downregulated (right panel) genes indicated. Two-tailed t test was performed and p value <0.05 was considered significant. Cells along with the total number of affected genes are indicated at the top. Of note, there are two proteins (SUB1 (P53999) and YBX3 (P16989)) that were regulated in opposite directions in TC4–2A and TL4–2A, respectively. Hence, the sum of the overlapped subsets of up- and downregulated proteins is 2 less than the one shown in the center panel, while the sum of the non-overlapped subsets is 2 more in both up- and downregulated groups, respectively. (D) An overview of proteins identified in TC4–2A (Supplementary Table S4). Proteins are grouped based on regulation direction and statistical significance. Statistical analysis is the same as in (C). The number of proteins identified in each group are indicated, while the percentage of the total identified proteins is shown in parenthesis. Color coding is indicated on the right of pie graph. (E) Identification of the most significantly altered proteins in TC4–2A. Left panel: Volcano plot of all identified proteins in TC4–2A. The X axis indicates log2 transformed value of fold change (FC), whereas the Y axis indicates the -log10 transformed p value. Each individual protein was plotted as a colored dot: grey indicates proteins showing p≥0.05, other color-coding is the same as in (D). Right panel: Bar graph including proteins with p<0.05 and log2(FC) ≥1 of expression levels. The protein names are labeled under X axis. Y axis indicates log2 value of fold change (FC). Upregulated and downregulated proteins are shown in green and red, respectively. (F) Enrichment analysis (Over-representation analysis, ORA) of significantly upregulated (left panel) and downregulated proteins (right panel) in TC4–2A, respectively. Results of Gene Ontology and Pathway are shown. ER, enrichment ratio.
Figure 7
Figure 7. Western blot validation of representative candidates altered significantly upon C2A-2B-3–4 overexpression.
(A) Expression profiles of top candidates identified in proteomics analysis. Absolute (fold change) <1.2, +; ≥1.2, ++; ≥1.5, +++; ≥ 2, ++++. Green: upregulated, p or adj. p <0.05; red: downregulated, p or adj. p <0.05. (B-D) Western blot results of validated candidates. Left panel: Representative blots. α-tubulin is used as loading control. Cell line is indicated at the top of the panel. Antibody used is indicated at the right and nearby molecular weight markers are indicated at the left. Right panel: quantification of western blot results. For each band, background signal was subtracted and then signal was normalized by α -tubulin. Error bars represent standard error of the mean (SEM). n=3, *: p < 0.05compared to T-REx control.

Similar articles

References

    1. Memczak S. et al. Circular RNAs are a large class of animal RNAs with regulatory potency. Nature 495, 333–338, doi:10.1038/nature11928 (2013). - DOI - PubMed
    1. Wang P. L. et al. Circular RNA is expressed across the eukaryotic tree of life. PLoS One 9, e90859, doi:10.1371/journal.pone.0090859 (2014). - DOI - PMC - PubMed
    1. Ye C. Y., Chen L., Liu C., Zhu Q. H. & Fan L. Widespread noncoding circular RNAs in plants. New Phytol 208, 88–95, doi:10.1111/nph.13585 (2015). - DOI - PubMed
    1. Enuka Y. et al. Circular RNAs are long-lived and display only minimal early alterations in response to a growth factor. Nucleic Acids Res 44, 1370–1383, doi:10.1093/nar/gkv1367 (2016). - DOI - PMC - PubMed
    1. Lasda E. & Parker R. Circular RNAs: diversity of form and function. RNA 20, 1829–1842, doi:10.1261/rna.047126.114 (2014). - DOI - PMC - PubMed

Publication types

LinkOut - more resources