[Preprint]. 2024 Feb 26:rs.3.rs-3976896.
doi: 10.21203/rs.3.rs-3976896/v1.

Noradrenergic signaling controls Alzheimer's disease pathology via activation of microglial β2 adrenergic receptors

Affiliations

Noradrenergic signaling controls Alzheimer's disease pathology via activation of microglial β2 adrenergic receptors

Ania Majewska et al. Res Sq. .

Update in

Abstract

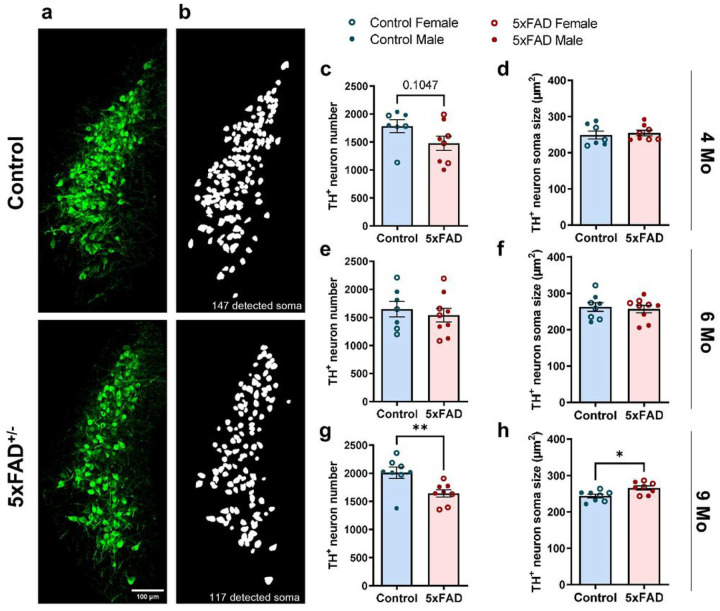
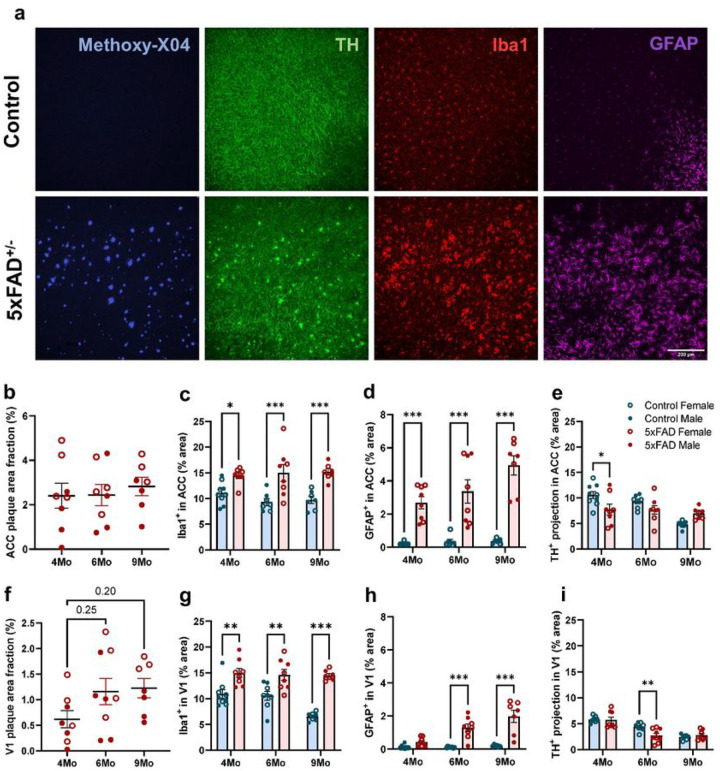
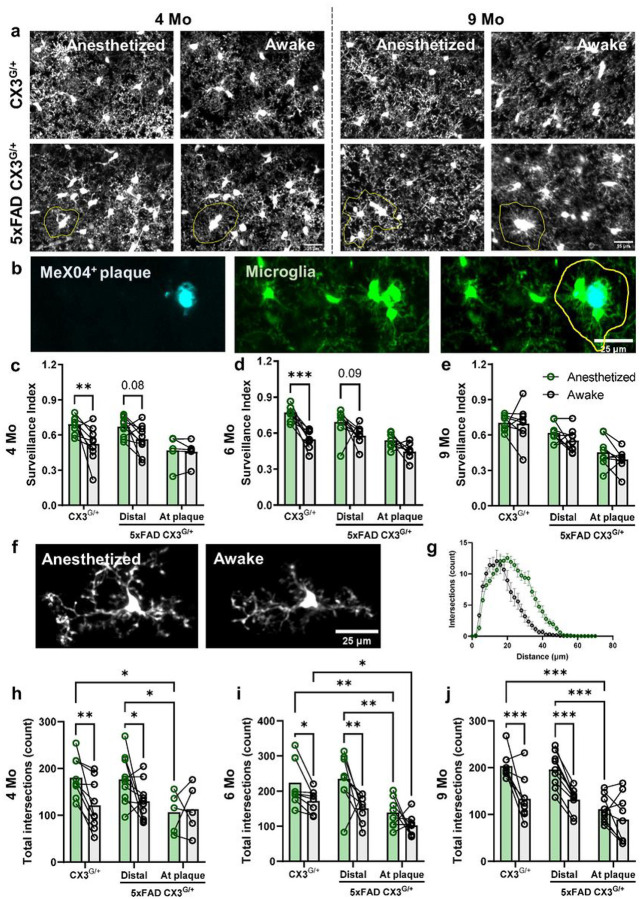
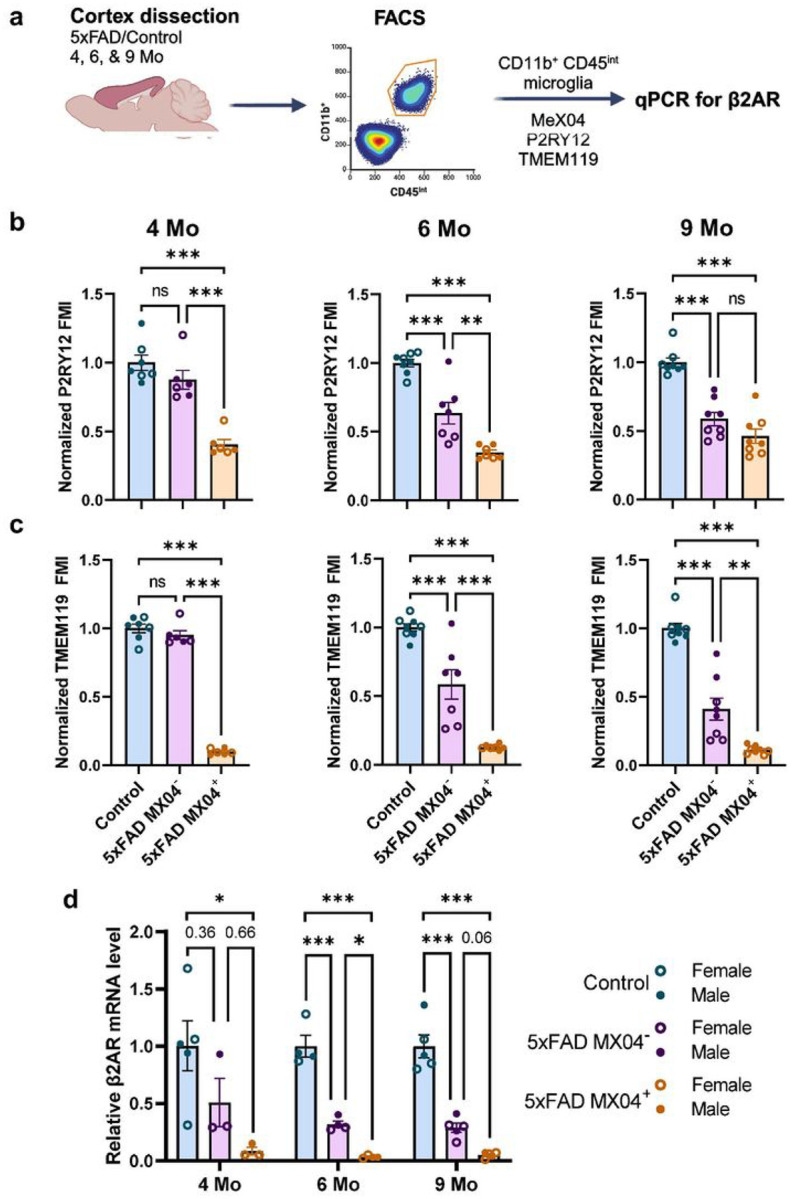
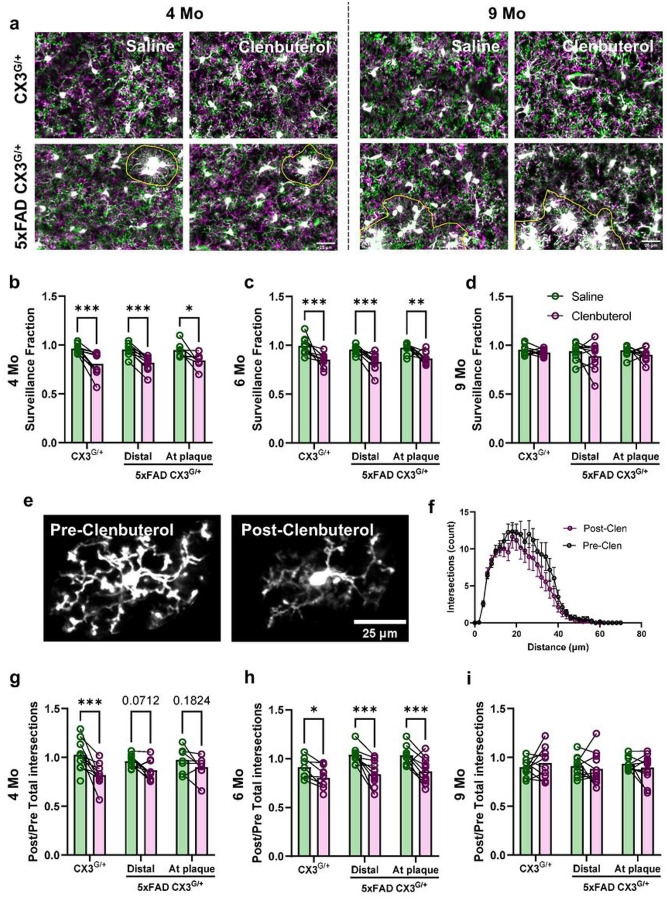
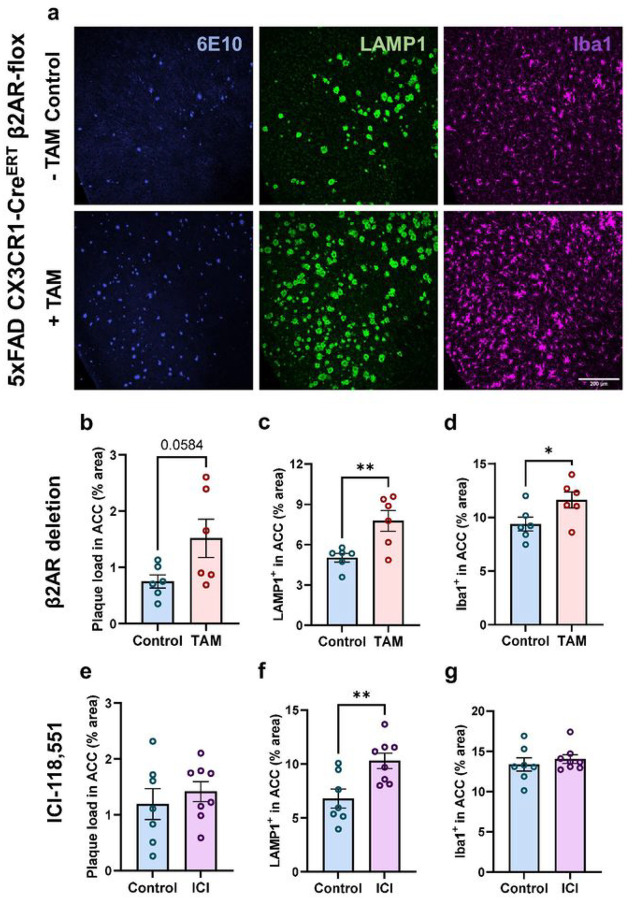
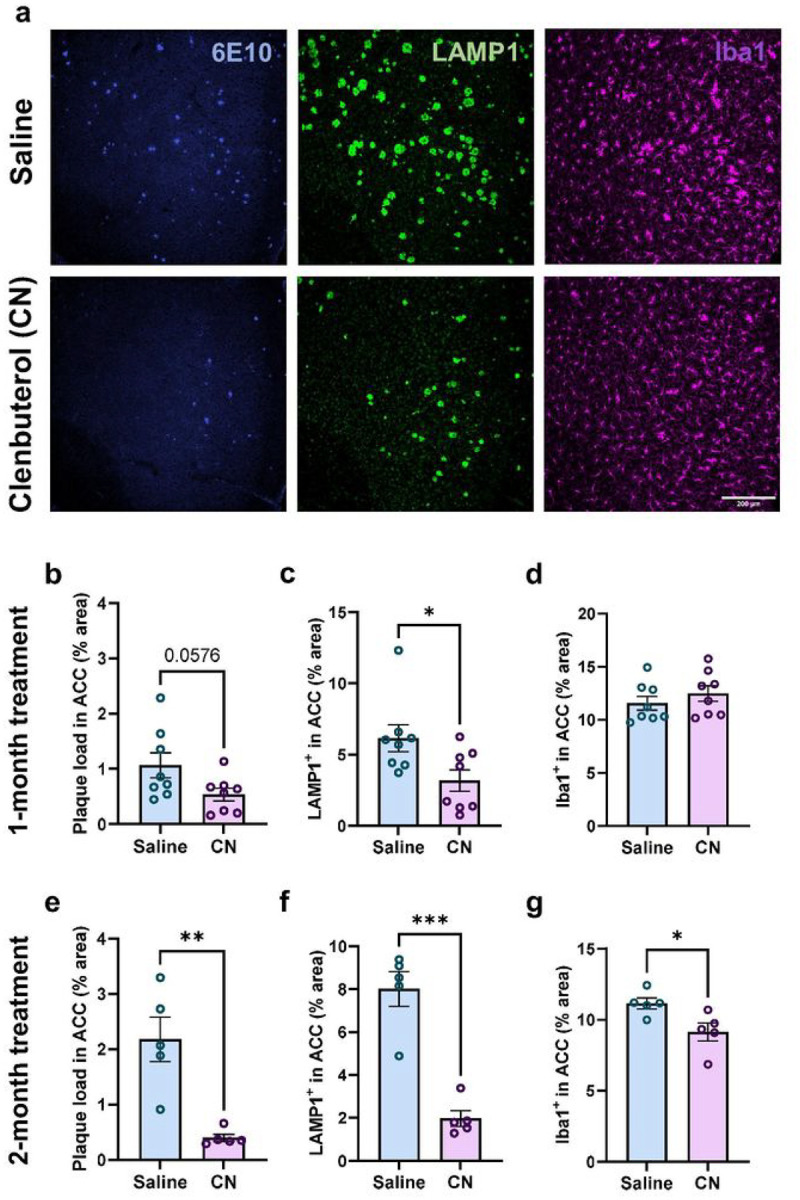
Norepinephrine (NE) is a potent anti-inflammatory agent in the brain. In Alzheimer's disease (AD), the loss of NE signaling heightens neuroinflammation and exacerbates amyloid pathology. NE inhibits surveillance activity of microglia, the brain's resident immune cells, via their β2 adrenergic receptors (β2ARs). Here, we investigate the role of microglial β2AR signaling in AD pathology in the 5xFAD mouse model of AD. We found that loss of cortical NE projections preceded the degeneration of NE-producing neurons and that microglia in 5xFAD mice, especially those microglia that were associated with plaques, significantly downregulated β2AR gene expression early in amyloid pathology. Importantly, dampening microglial β2AR signaling worsened plaque load and the associated neuritic damage, while stimulating microglial β2AR signaling attenuated amyloid pathology. Our results suggest that microglial β2AR could be explored as a potential therapeutic target to modify AD pathology.


Conflict of interest statement

Competing interests The authors declare no competing interests.

Figures

Figure 1
Figure 1. Loss of NE neurons in the LC in 5xFAD mice at advanced amyloid pathology stage.
a Representative 20x confocal images of LC neurons immunolabeled with TH (scale bar = 100mm). b Representative soma detection using Cellpose custom-trained model. c-h Number and size of LC neurons are comparable between control and 5xFAD mice at 4 months (c-d) and 6 months (e-f), LC neuron number is lower while neuronal size is larger at 9 months in 5xFAD compared to control mice (g-h). n = 7–9 mice per genotype per age group. Student t-test; *p<0.05, **p<0.01.
Figure 2
Figure 2. Early loss of cortical TH+ projection in 5xFAD mice.
a Representative 20x confocal images showing neuritic plaques (Methoxy-X04, blue), putative NE projections (TH, green), microglia (Iba1, red), and astrocytes (GFAP, magenta) in the ACC at 4 months (scale bar = 200μm). Analyses were performed in ACC (b-e) and V1 (f-i). b, f Quantification of senile plaque load labeled with Methoxy-X04. c, g, d, h Area fraction of both microglia (c, g) and astrocyte (d, h) increased early in 5xFAD mice. e, i Decrease in TH+ projections in ACC at 4 months (e) and in V1 at 6 months (i) in 5xFAD mice compared to littermate controls. n = 7–9 mice per genotype per age group. One-way ANOVA with Bonferroni correction (b, f) or two-way ANOVA comparing between genotypes and ages with Bonferroni correction for genotype comparisons within the same age group (c-e, g-i); *p<0.05, **p<0.01, ***p<0.001.
Figure 3
Figure 3. The effect of anesthesia on microglia surveillance differs with pathology and age in V1.
a Representative in vivo two-photon images showing fewer microglial pixels in time projected images in awake animals (reflecting lower microglial surveillance) than in anesthetized animals at 4 months (left) and to a lesser extent at 9 months (right) (scale bar = 25μm). Plaque-associated microglia (outlined in yellow) were manually selected based on proximity to MeX04+ plaques (not shown). b Representative in vivo two-photon images showing the selection of plaque-associated microglia (outlined in yellow). c-e Quantification of microglial surveillance in awake versus anesthetized state in CX3CR1GFP/+ (Control) and CX3CR1GFP/+ 5xFAD+/− (5xFAD) mice (c: 4 months; d: 6 months; e: 9 months). f Representative images of manually selected individual microglia from awake and anesthetized mice for Sholl analysis. g Representative Sholl curves showing Sholl profiles of microglia in awake (black) and anesthetized (green) control mice at 4 months. h-j Both control and plaque-distal microglia, but not plaque-associated microglia, are more ramified (more total intersections) under anesthesia (h: 4 months; i: 6 months; j: 9 months). n = 8–10 mice per genotype per age group. Repeated measures ANOVA with Bonferroni (c-e) or Tukey (h-j) correction; *p<0.05, **p<0.01, ***p<0.001.
Figure 4
Figure 4. Loss of microglial homeostatic signature and β2AR expression is dependent on age and amyloid pathology in 5xFAD mice.
a Experimental paradigm for microglia isolation and analysis. b-c Expression of microglial homeostatic marker P2RY12 (b) and TMEM119 (c) is downregulated early in plaque-associated microglia and progressively decreases in plaque-distal microglia with aging (n = 7–9 mice per genotype per age group). d β2AR mRNA levels were reduced in both plaque-associated and plaque-distal microglia (n = 3–5 mice per genotype per age group). Cortices from different age groups were collected at different times, and thus, analyzed independently and normalized to the age-matched controls. One-way ANOVA with Bonferroni post-hoc correction; *p<0.05, **p<0.01, ***p<0.001.
Figure 5
Figure 5. β2AR stimulation decreases microglia surveillance regardless of amyloid pathology but becomes ineffective with age in V1.
a Representative in vivo two-photon time projected images from CX3CR1GFP/+ and CX3CR1GFP/+5xFAD+/− mice. Images obtained before treatment are shown in magenta and superimposed on images obtained after saline or clenbuterol injection which are shown in green (scale bar = 25μm). Plaque-associated microglia (outlined in yellow) were manually selected based on proximity to MeX04+ plaques (not shown). b-d Quantification of microglial surveillance fraction (area of image covered by microglia post/pre) in Saline (green) and Clenbuterol (magenta) treatment groups in CX3G/+ and 5xFAD CX3G/+ mice (b: 4 months; c: 6 months; d: 9 months). e Representative individual microglia prior to and after clenbuterol treatment used for Sholl analysis. f Representative curves showing Sholl pro les of microglia pre- (black) and post- (magenta) clenbuterol treatment in CX3G/+ mice at 4 months old. g-i Quantification of ratio of microglia total intersections from Sholl analysis post/pre treatment. Both CX3G/+ and 5xFAD CX3G/+ microglia retract their processes in response to clenbuterol at 4 and 6 months but not at 9 months (g: 4 months; h: 6 months; i: 9 months). n = 9–11 mice per genotype per age group. Two-way ANOVA with Bonferroni (b-d) or Tukey (g-i) correction; *p<0.05, **p<0.01, ***p<0.001.
Figure 6
Figure 6. Both genetic deletion of microglial β2AR and prolonged exposure to β2AR antagonist accelerates pathology in female 5xFAD mice.
a Representative 20x confocal images of the ACC immunolabeled for plaque (6E10, blue), plaque-associated neuritic damage (LAMP1, green), and microglia (Iba1, magenta) in 4-month-old female 5xFAD CX3CR1-CreERT β2AR-flox without (Control, upper panels) or with tamoxifen (TAM) treatment to induce β2AR excision (β2AR deletion, lower panels) (scale bar = 200μm). b-d Ablating microglial β2AR in female 5xFAD CX3CR1-CreERT β2AR-flox mice with TAM treatment resulted in a trend toward increasing plaque load (b), significantly worsened neuritic damage (c), and microglia reactivity (d). e-g Female 5xFAD mice after treatment with ICI-118,551, a β2AR-specific antagonist, for 1 month (treatment started at 3 months) show significantly higher neuritic damage (f) but no changes in plaque load (e) and microglia reactivity (g) compared to DMSO-treated controls. n = 6–8 mice per treatment. Student t-test; *p<0.05, **p<0.01.
Figure 7
Figure 7. Prolonged exposure to β2AR agonist attenuates amyloid pathology and associated neuritic damage in the ACC in male 5xFAD mice.
a Representative 20x confocal images of the ACC immunolabeled for plaque (6E10, blue), plaque-associated neuritic damage (LAMP1, green), and microglia (Iba1, magenta) in male 5xFAD mice treated with saline control (upper panels) or β2AR agonist clenbuterol (lower panels) (scale bar = 200μm). All animals were 3 months old at the start of treatments. b-g Quantification of plaque load, neuritic damage, and microglia activation in the ACC of male 5xFAD mice after 1 month (b-d, n = 8 mice per treatment) or 2 months (e-g, n = 5 mice per treatment) of daily i.p. injections with saline or clenbuterol (CN). Student t-test; *p<0.05, **p<0.01, ***p<0.001.

Similar articles

References

    1. O’Donnell J., Zeppenfeld D., McConnell E., Pena S. & Nedergaard M. Norepinephrine: a neuromodulator that boosts the function of multiple cell types to optimize CNS performance. Neurochem Res 37, 2496–2512, doi: 10.1007/s11064-012-0818-x (2012). - DOI - PMC - PubMed
    1. Berridge C. W. & Waterhouse B. D. The locus coeruleus-noradrenergic system: modulation of behavioral state and state-dependent cognitive processes. Brain Res Brain Res Rev 42, 33–84, doi: 10.1016/s0165-0173(03)00143-7 (2003). - DOI - PubMed
    1. Mann D. M., Yates P. O. & Hawkes J. The pathology of the human locus ceruleus. Clin Neuropathol 2, 1–7 (1983). - PubMed
    1. Beardmore R., Hou R., Darekar A., Holmes C. & Boche D. The Locus Coeruleus in Aging and Alzheimer’s Disease: A Postmortem and Brain Imaging Review. J Alzheimers Dis 83, 5–22, doi: 10.3233/JAD-210191 (2021). - DOI - PMC - PubMed
    1. German D. C. et al. Disease-specific patterns of locus coeruleus cell loss. Ann Neurol 32, 667–676, doi: 10.1002/ana.410320510 (1992). - DOI - PubMed

Publication types

LinkOut - more resources