[Preprint]. 2024 Mar 29:2024.02.22.581560.
doi: 10.1101/2024.02.22.581560.

NSD2 is a requisite subunit of the AR/FOXA1 neo-enhanceosome in promoting prostate tumorigenesis

Affiliations

NSD2 is a requisite subunit of the AR/FOXA1 neo-enhanceosome in promoting prostate tumorigenesis

Abhijit Parolia et al. bioRxiv. .

Update in

  • NSD2 is a requisite subunit of the AR/FOXA1 neo-enhanceosome in promoting prostate tumorigenesis.
    Parolia A, Eyunni S, Verma BK, Young E, Liu Y, Liu L, George J, Aras S, Das CK, Mannan R, Ur Rasool R, Mitchell-Velasquez E, Mahapatra S, Luo J, Carson SE, Xiao L, Gajjala PR, Venkatesh S, Jaber M, Wang X, He T, Qiao Y, Pang M, Zhang Y, Tien JC, Louw M, Alhusayan M, Cao X, Su F, Tavana O, Hou C, Wang Z, Ding K, Chinnaiyan AM, Asangani IA. Parolia A, et al. Nat Genet. 2024 Oct;56(10):2132-2143. doi: 10.1038/s41588-024-01893-6. Epub 2024 Sep 9. Nat Genet. 2024. PMID: 39251788 Free PMC article.

Abstract

The androgen receptor (AR) is a ligand-responsive transcription factor that binds at enhancers to drive terminal differentiation of the prostatic luminal epithelia. By contrast, in tumors originating from these cells, AR chromatin occupancy is extensively reprogrammed to drive hyper-proliferative, metastatic, or therapy-resistant phenotypes, the molecular mechanisms of which remain poorly understood. Here, we show that the tumor-specific enhancer circuitry of AR is critically reliant on the activity of Nuclear Receptor Binding SET Domain Protein 2 (NSD2), a histone 3 lysine 36 di-methyltransferase. NSD2 expression is abnormally gained in prostate cancer cells and its functional inhibition impairs AR trans-activation potential through partial off-loading from over 40,000 genomic sites, which is greater than 65% of the AR tumor cistrome. The NSD2-dependent AR sites distinctly harbor a chimeric AR-half motif juxtaposed to a FOXA1 element. Similar chimeric motifs of AR are absent at the NSD2-independent AR enhancers and instead contain the canonical palindromic motifs. Meta-analyses of AR cistromes from patient tumors uncovered chimeric AR motifs to exclusively participate in tumor-specific enhancer circuitries, with a minimal role in the physiological activity of AR. Accordingly, NSD2 inactivation attenuated hallmark cancer phenotypes that were fully reinstated upon exogenous NSD2 re-expression. Inactivation of NSD2 also engendered increased dependency on its paralog NSD1, which independently maintained AR and MYC hyper-transcriptional programs in cancer cells. Concordantly, a dual NSD1/2 PROTAC degrader, called LLC0150, was preferentially cytotoxic in AR-dependent prostate cancer as well as NSD2-altered hematologic malignancies. Altogether, we identify NSD2 as a novel subunit of the AR neo-enhanceosome that wires prostate cancer gene expression programs, positioning NSD1/2 as viable paralog co-targets in advanced prostate cancer.

Keywords: AR neo-enhanceosome; AR reprogramming; dual NSD1/2 PROTAC degrader; hormone receptor oncogenesis; targetable paralog co-dependencies.


Conflict of interest statement

Competing interests All the authors declare no competing financial interests.

Figures
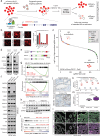
Figure 1:
Figure 1:. Epigenetics-CRISPR screen reveals NSD2 as a novel AR coactivator.
a) Schematic of the epigenetic-targeted functional CRISPR screen using the LNCaP mCherry-KLK3 endogenous AR reporter lines. b) Left: mCherry immunofluorescence images of the reporter LNCaP cells treated with epigenetic drugs targeting known AR cofactors. Right: Barplot showing quantification of the mCherry signal from treated LNCaP reporter cells normalized to the DMSO treatment control. c) sgRNA enrichment rank plot based on the ratio of guide RNA abundances in mCherry-LOW to mCherry-HIGH cell populations. LNCaP reporter cells were treated with the sgRNA library for 8 days and FACS-sorted as shown in panel (a) for genomic sgRNA sequencing. d) Immunoblots of AR targets and histone marks upon treatment with the control (siNC) or NSD2-targeting (siNSD2) siRNAs in prostate cancer cell lines. Total histone H3 is used as the loading control. e) Representative protein map of NSD2-Long (NSD2-L) and NSD2-Short (NSD2-S) splice isoforms. HMG: High mobility group; PHD: Plant homeodomain. f) Immunoblots of AR targets and histone marks in CRISPR-mediated stable knock-out (KO) of both or only the NSD2-L isoform. Total H3 is the loading control. g) GSEA plots for AR and E2F up-regulated genes using the fold change rank-ordered genes from the LNCaP NSD2 knock-out (KO) vs wild-type (WT) control lines. DEGS, differentially expressed genes. (n=2 biological replicates) h) Immunoblots of labeled proteins in LNCaP NSD2 knock-out cells stimulated with 10nM DHT for increasing time durations. i) GSEA plots of AR hallmark genes in the LNCaP NSD2 wild-type (WT) vs knock-out (KO) cells using the fold change rank-ordered genes from DHT (10nM for 24h) vs DMSO treated LNCaP cells. DEGS, differentially expressed genes. j) Representative immunohistochemistry (IHC) images of NSD2 in primary prostatectomy patient specimens. k) NSD2 signal intensity plot from IHC staining in panel (j). Adjacent benign and primary prostate cancer tissues were used for this matched analysis. (n = 4 biological replicates; two-sided t-test). In box plots, the center line shows the median, box edges mark quartiles 1–3, and whiskers span quartiles 1–3 ± 1.5*interquartile range. l) Representative multiplex immunofluorescence (IF) images of KRT8, AR, and NSD2 in benign prostate, primary prostate cancer, or metastatic CRPC patient specimens. m) Quantification of NSD2 IF signal intensity per KRT8+ luminal epithelial cell from images in panel (l). (two-sided t-test). In box plots, the center line shows the median and the whiskers are drawn down to the 10th percentile and up to the 90th. Points below and above the whiskers are drawn as individual dots.
Figure 2:
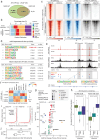
Figure 2:. NSD2 expands the AR neo-enhancer circuitry to include chimeric AR half-sites.
a) Venn diagram showing overlaps of AR ChIP-seq peaks in NSD2 wild-type (WT) and knock-out (KO) LNCaP cell lines. b) Genomic location of NSD2-dependent and independent AR sites defined from the overlap analysis in panel (a). c) ChIP-seq read-density heatmaps of AR, FOXA1, and H3K27Ac at top 1,000 AR enhancer sites (ranked by score) in LNCaP NSD2 WT and KO cell lines. d) Top five known HOMER motifs (ranked by p-value) enriched within NSD2-dependent and independent AR sites in LNCaP cells. (HOMER, hypergeometric test). e) ChIP-seq read-density tracks of AR and H3K27Ac within a Chr10 locus in NSD2 WT and KO LNCaP cell lines. HOMER motifs detected within AR peaks are shown below with grey boxes highlighting NSD2 dependent and independent AR elements. f) Fold change heatmap of HOMER motifs enrichment within AR binding sites specific to HOXB13, FOXA1, or FOXA1+HOXB13 overexpression in LHSAR cells (data from Pomerantz et al, 2015). g) Fold change and significance of HOMER motifs enriched within primary prostate cancer-specific AR sites over normal tissue-specific AR elements (data from Pomerantz et al., 2015). h) AR ChIP-seq read density boxplot at sites containing the ARE or the FOXA1:AR chimeric motif in primary normal and tumor patient samples (normal prostate, n=7; primary prostate cancer, n=13; CRPC, n=15). In box plots, the center line shows the median, box edges mark quartiles 1–3, and whiskers span quartiles 1–3 ± 1.5 * interquartile range. i) Rank-ordered plot of AR super-enhancers (HOMER ROSE algorithm) in NSD2 wild-type and knock-out LNCaP cells with select cis-coded known AR target genes noted. j) Boxplot of AR super-enhancer scores (HOMER ROSE al) of top 100 cis-elements in NSD2 WT or KO LNCaP cells.
Figure 3:
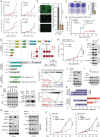
Figure 3:. NSD2 enables oncogenic AR activity with NSD1/2 being paralog co-dependencies.
a) Left: Growth curves (Cell-titer Glo) of prostate cancer cells treated with non-targeting (siNC) or NSD2-targeting siRNAs. Right: Growth curves (Cell-titer Glo) of CRISPR-engineered prostate cancer cells with deletion of the NSD2 gene (NSD2 KO) relative to the control wildtype (NSD2 WT) cells. b) Left: Representative images of Boyden chambers showing invaded cells stained with calcein AM dye in the LNCaP NSD2 WT and KO. Right: Barplot showing quantified fluorescence signal from invaded cells (two-way ANOVA and Tukey’s test) c) Left: Representative images of colonies of 22RV1 NSD2 WT and KO cell lines (n= 3 biological replicates). Right: Barplot showing staining intensity of the colonies. (Two-sided t-test) d) Reverse Kaplan Meier plot of subcutaneous tumor grafting of 22RV1 NSD2 WT, NSD2 KO, or NSD2 KO cells rescued with the NSD2-L-HA isoform. e) Tumor volumes of 22RV1 NSD2-KO+NSD2-FKBP12F36V cell line-derived xenografts with or without treatment with dTAGv-1. Mean ± SEM is shown. (Multiple t-test) f) Immunoblots of noted proteins in whole-cell or chromatin fractions of LNCaP NSD2-FKBP12F36V cell line plus/minus treatment with dTAG-13 (0.5uM for 24h). g) Schematic of the epitope-tagged NSD2 and AR fragments used in the interaction studies. The dashed red box marks NSD2 and AR interacting functional domains. Inset: Summary of co-immunoprecipitation assays showing interaction between NSD2 and AR protein fragments. Source immunoblots are included in Fig. S5b,c. Red circles show interaction while grey circles represent no detectable binding between corresponding fragments. h) Left: Immunoblots of Halo-tag-based co-immunoprecipitation of the AR DNA-binding domain (DBD) in HEK293FT cells that overexpress HA-tagged NSD2-HMG single or triple mutants. Immunoblots of input fractions are shown as control. DBD: DNA binding domain; NSD2 HMG domain mutations: F463A, W491A, Y502A and, the triple mutant (TM). Right: Immunoblots of co-immunoprecipitation of wheatgerm-purified Halo-AR-DBD fragment with the purified His-NSD2 HMG variants. Immunoblots of input fractions are shown as control. i) GSEA plots for AR and MYC target genes using the fold change rank-ordered genes (RNAseq) from the LNCaP NSD1 KO vs wild-type cells. DEGS, differentially expressed genes. (n=2 biological replicates) j) Immunoblots of labeled proteins in VCaP cells upon siRNA treatment targeting NSD1 and/or NSD2 genes. Total histone H3 is a loading control. k) Top: GSEA net enrichment scores of EZH2/PRC2 repressed gene signatures (C2 pathways) in siNSD1 versus siNC treated VCaP cells. Bottom: GSEA net enrichment score of the prostate cancer-specific EZH2 repressed gene signature (defined in-house, see Methods) in siNSD1 and/or siNSD2 vs siNC treated VCaP cells. l) Immunoblots of noted histone marks in VCaP cells co-treated with siRNA targeting NSD1 and/or NSD2, followed by the EZH2-inhibitor EPZ-6438. m) Immunoblot of listed proteins in LNCaP cells treated with control siRNA (siNC) or siRNA targeting NSD1 and/or NSD2. n) Left: Cell growth curve (Cell-titer Glo) assays of VCaP cells treated with control siRNA (siNC) or siRNA targeting NSD1 or NSD1+NSD2 together. Right: Growth curves of NSD1-deficient (sgNSD1) LNCaP cells plus/minus treatment with siRNA targeting NSD2. (Two-way ANOVA or Tukey’s test).
Figure 4:
Figure 4:. LLC0150 is an NSD1/2 PROTAC with preferential cytotoxicity in AR-driven prostate cancer.
a) Structure of LLC0150 and schema of NSD1 and NSD2 functional domains. LLC0150-binding PWWP1 domain is highlighted using a dashed red box. HMG: High mobility group; PHD: Plant homeodomain. b) Immunoblots of listed proteins in VCaP cells treated with UNC6934 (warhead), LLC0150-dead (epimer control) or LLC0150 for 12h at 1uM. Total histone H3 is used as a loading control. c) Immunoblots of listed proteins in VCaP cells treated with LLC0150 (2uM) for increasing time durations. Total histone H3 is used as a loading control. d) GSEA plots of MYC target genes using the fold change rank-ordered genes from LLC0150 vs DMSO treated LNCaP cells. DEGS, differentially expressed genes. e) Venn diagram showing the overlap of AR ChIP-seq peaks in LNCaP cells treated with LLC0150 (2uM for 48h) or DMSO as control. f) ChIP-seq read-density heatmaps of AR, FOXA1, and H3K27Ac at enhancers that are co-bound by AR and FOXA1 in LNCaP cells plus/minus treatment with LLC0150 (2uM for 48h). g) Percent growth inhibition (Cell-titer Glo) of LNCaP cells upon co-treatment with varying concentrations of LLC0150 and enzalutamide. h) Dose-response curves of LLC0150 or enzalutamide in parental or enzalutamide-resistant VCaP cells. Data are presented as mean +/− SEM (n=2 biological replicates). Serving as a control, enzalutamide dose-response curve credentials the enzalutamide-resistant VCaP cell line. i) IC50 rank-order plot of over 110 human-derived normal or cancer cell lines after 5 days of treatment with LLC0150. AR+ prostate cancer models are highlighted in red, and NSD2-mutant hematologic cell lines are shown in purple as well as marked with an asterisk (*). Each cell line’s originating tissue lineages and known NSD2 alteration status are shown below.
Figure 5:
Figure 5:. Schema depicting NSD2’s role in loading the AR enhanceosome at tumor-enriched chimeric AR neo-enhancer elements.
Chromatin loading of AR in prostate epithelial cells follows two distinct modes of DNA interactions: Left, NSD2-independent binding at cis-elements harboring the canonical, 15bp palindromic AREs that are predominantly found in the physiological/normal enhancer circuitry, and Right: NSD2-dependent loading at cis-regulatory elements harboring chimeric AR-half motifs juxtaposed to the FOXA1 sequence that distinctively constitute the cancer-specific enhancer/super-enhancer circuitries.

References

    1. Heinlein C. A. & Chang C. Androgen receptor in prostate cancer. Endocr. Rev. 25, 276–308 (2004). - PubMed
    1. Nadal M. et al. Structure of the homodimeric androgen receptor ligand-binding domain. Nat. Commun. 8, 14388 (2017). - PMC - PubMed
    1. Shaffer P. L., Jivan A., Dollins D. E., Claessens F. & Gewirth D. T. Structural basis of androgen receptor binding to selective androgen response elements. Proc. Natl. Acad. Sci. U. S. A. 101, 4758–4763 (2004). - PMC - PubMed
    1. Mills I. G. Maintaining and reprogramming genomic androgen receptor activity in prostate cancer. Nat. Rev. Cancer 14, 187–198 (2014). - PubMed
    1. Pomerantz M. M. et al. The androgen receptor cistrome is extensively reprogrammed in human prostate tumorigenesis. Nat. Genet. 47, 1346–1351 (2015). - PMC - PubMed

Publication types