

This is a preprint.
Design, optimization, and inference of biphasic decay of infectious virus particles
- PMID: 38464262
- PMCID: PMC10925204
- DOI: 10.1101/2024.02.23.581735
Design, optimization, and inference of biphasic decay of infectious virus particles
Update in
-
Design, optimization, and inference of biphasic decay of infectious virus particles.J Theor Biol. 2025 Mar 7;600:112042. doi: 10.1016/j.jtbi.2025.112042. Epub 2025 Jan 10. J Theor Biol. 2025. PMID: 39799993 Free PMC article.
Abstract
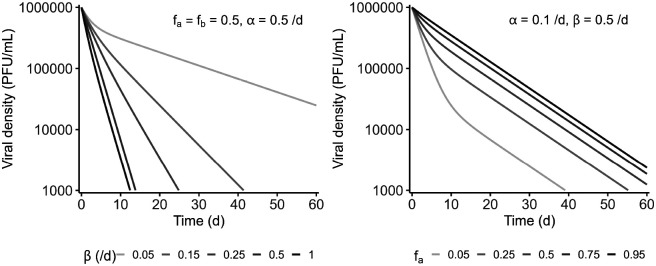
Virus population dynamics are driven by counter-balancing forces of production and loss. Whereas viral production arises from complex interactions with susceptible hosts, the loss of infectious virus particles is often approximated as a first-order kinetic process. As such, experimental protocols to measure infectious virus loss are not typically designed to identify non-exponential decay processes. Here, we propose methods to evaluate if an experimental design is adequate to identify multiphasic virus particle decay and to optimize the sampling times of decay experiments, accounting for uncertainties in viral kinetics. First, we evaluate synthetic scenarios of biphasic decays, with varying decay rates and initial proportions of subpopulations. We show that robust inference of multiphasic decay is more likely when the faster decaying subpopulation predominates insofar as early samples are taken to resolve the faster decay rate. Moreover, design optimization involving non-equal spacing between observations increases the precision of estimation while reducing the number of samples. We then apply these methods to infer multiple decay rates associated with the decay of bacteriophage ('phage') , an evolved isolate derived from phage . A pilot experiment confirmed that decay is multiphasic, but was unable to resolve the rate or proportion of the fast decaying subpopulation(s). We then applied a Fisher information matrix-based design optimization method to propose non-equally spaced sampling times. Using this strategy, we were able to robustly estimate multiple decay rates and the size of the respective subpopulations. Notably, we conclude that the vast majority (94%) of the phage population decays at a rate 16-fold higher than the slow decaying population. Altogether, these results provide both a rationale and a practical approach to quantitatively estimate heterogeneity in viral decay.
Keywords: Fisher information matrix; inference; multiphasic decay; optimal design; viral decay.
Conflict of interest statement
COMPETING INTERESTS The authors have no competing interest to declare.
Figures


References
-
- Atkinson A., Donev A., and Tobias R. Optimum experimental designs, with SAS. Oxford, New York: Oxford University Press, 2007.
-
- Atkinson A. C., and Bogacka B. Compound d-and ds-optimum designs for determining the order of a chemical reaction. Technometrics 39, 4 (1997), 347–356.
-
- Beckett S. J., Demory D., Coenen A. R., Casey J. R., Dugenne M., Follett C. L., Connell P., Carlson M. C., Hu S. K., Wilson S. T., et al. Disentangling top-down drivers of mortality underlying diel population dynamics of prochlorococcus in the north pacific subtropical gyre. Nature communications 15, 1 (2024), 2105. - PMC - PubMed
-
- Borin J. M., Lee J. J., Lucia-Sanz A., Gerbino K. R., Weitz J. S., and Meyer J. R. Rapid bacteria-phage coevolution drives the emergence of multiscale networks. Science 382, 6671 (2023), 674–678. - PubMed
Publication types
Grants and funding
LinkOut - more resources
Full Text Sources
Research Materials