[Preprint]. 2024 Feb 29:2024.02.28.582567.
doi: 10.1101/2024.02.28.582567.

Domain coupling in activation of a family C GPCR

Affiliations

Domain coupling in activation of a family C GPCR

Naomi R Latorraca et al. bioRxiv. .

Update in

  • Domain coupling in activation of a family C GPCR.
    Latorraca NR, Sabaat S, Habrian CH, Bleier J, Stanley C, Kinz-Thompson CD, Marqusee S, Isacoff EY. Latorraca NR, et al. Nat Chem Biol. 2025 Sep;21(9):1433-1443. doi: 10.1038/s41589-025-01895-3. Epub 2025 Apr 25. Nat Chem Biol. 2025. PMID: 40281344 Free PMC article.

Abstract

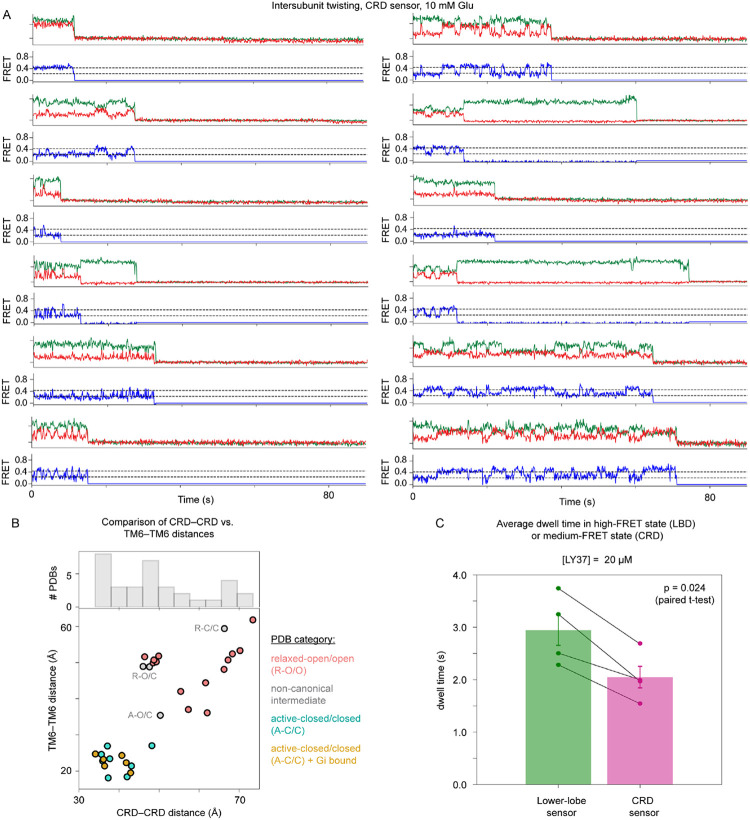
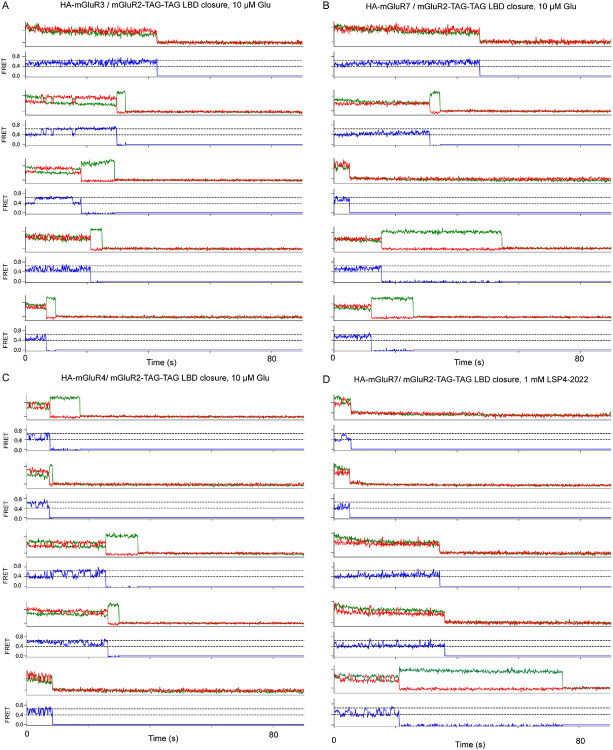
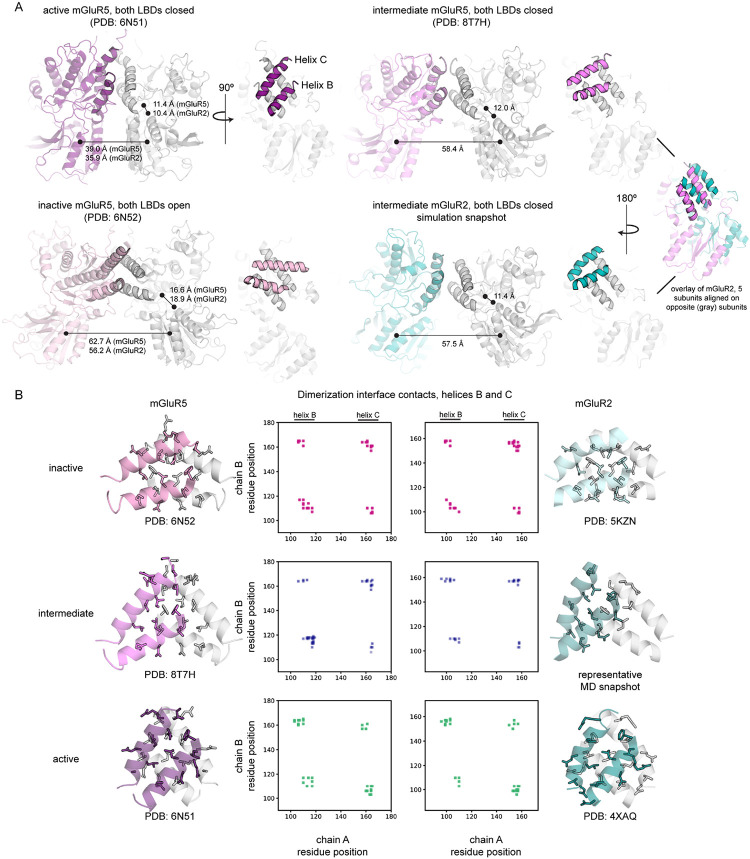
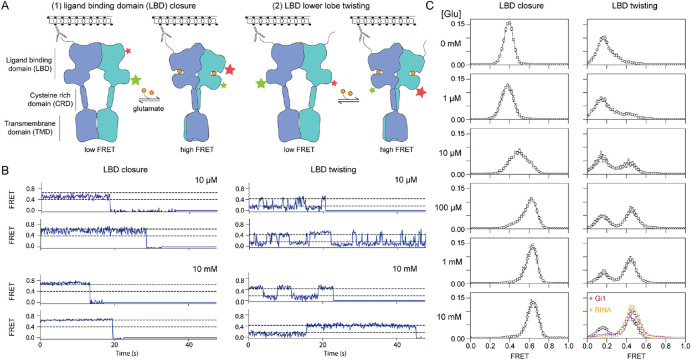
The G protein-coupled metabotropic glutamate receptors form homodimers and heterodimers with highly diverse responses to glutamate and varying physiological function. The molecular basis for this diversity remains poorly delineated. We employ molecular dynamics, single-molecule spectroscopy, and hydrogen-deuterium exchange to dissect the pathway of activation triggered by glutamate. We find that activation entails multiple loosely coupled steps and identify a novel pre-active intermediate whose transition to the active state forms dimer interactions that set signaling efficacy. Such subunit interactions generate functional diversity that differs across homodimers and heterodimers. The agonist-bound receptor is remarkably dynamic, with low occupancy of G protein-coupling conformations, providing considerable headroom for modulation of the landscape by allosteric ligands. Sites of sequence diversity within the dimerization interface and diverse coupling between activation rearrangements may contribute to precise decoding of glutamate signals and transients over broad spatial and temporal scales.


Figures

Extended Data Fig. 1.
Representative smFRET traces. Donor (green) and acceptor (red) intensities (top) and FRET values (blue; bottom) for the LBD closure (left) and inter-subunit twisting (right) FRET pairs.
Extended Data Fig. 2.
(A) Traces and interface interaction time courses for additional simulations. Simulations 1 and 3 show transitions to a relaxed, LBD-closed intermediate, and data for simulation 5 is represented in the main text figure. (B) Changes in the flexibility of the R177-containing helix, before and after the transition (n = 3 simulations; error bars represent s.e.m.). RMSF analysis carried out on 2 μs pre- and post- transition; average structure calculated from simulations 2 and 4, which do not transition away from initial state (left).
Extended Data Fig. 3.
(A) smFRET distributions for LBD closure for two mutants demonstrate that R177A, but not D95A, leads to a reduction in glutamate affinity, but that in the presence of a strong agonist, both mutants populate fully closed states. (B) These changes are summarized by the plot on the right, which shows the median FRET value for each averaged smFRET distributed plotted vs. glutamate concentration. Pink circles represent data collected in presence of 20 μM LY37. (C) In a crystal structure (PDB entry 4XAQ) of the mGluR2 LBD, R177 adopts two distinct orientations. We speculate that the non-equivalent effects of D95A and R177A on ligand affinity and intersubunit twisting are due, at least in part, to the ability of R177 to engage R243 on the opposite protomer via a π–π stack, one of the two R177 orientations observed in the crystal structure of agonist-bound mGluR2 LBD (29). Classical molecular mechanics forcefields do not explicitly represent π–π interactions, suggesting that our simulations may over-represent the orientation of R177 that engages D95. Additionally, introduction of R243A in single-molecule constructs substantially reduced expression, preventing smFRET investigation. (D) Conservation of the interface network across the eight mGluR subtypes found in R. norvegicus.
Extended Data Fig. 4.
(A) Woods plots showing (top) change in hydrogen exchange protection vs. peptide sequence position at increasing exchange times. Peptides are colored blue if they exhibit an increase in protection of at least 10% in the presence of glutamate or red if they exhibit a decrease in protection of at least 10% in the presence of glutamate. (B) Dimerization interfaces of two mGluR2 crystal structures are colored by the maximal change in protection for any peptide covering a given residue position.
Extended Data Fig. 5.
(A) Representative smFRET traces for the CRD reporter, collected in the presence of 10 mM glutamate (left). (B) Scatter plot of TM6–TM6 vs. CRD–CRD distances across different full-length cryo-EM structures of mGluRs. A histogram of CRD–CRD distances reveals the heterogeneous spectrum of CRD–CRD distances observed across mGluR homo- and heterodimers. Cα positions for Ala548 (mGluR2) or the equivalent position in other mGluRs were used to determine CRD–CRD distances; Cα positions for Phe756 (mGluR2) or equivalent in other mGluRs were used to determine TM6–TM6 distances (C) Dwell times calculated from a two-state HMM fit carried out using ebFRET in SPARTAN. Each point corresponds to the average dwell time from one of four separate experimental days; dwell times for each sensor were compared on each day.
Extended Data Fig. 6.
smFRET traces for the LBD closure reporter, which reveal differences in kinetics of transitions between the low- and high-FRET states. Specifically, the mGluR2 subunit adopts longer lived low- and high-FRET states in the mGluR2/3 and mGluR2/4 heterodimers (A, B) vs. the mGluR2/7 heterodimer (C), where those states are not easily resolved. In the presence of a Group III (mGluR7)-specific agonist (D), the mGluR2 subunit in mGluR2/7 heterodimers occasionally makes excursions to high-FRET states, indicating that mGluR2 is allosterically influenced by mGluR7.
Extended Data Fig. 7.
Extended Data Fig. 7.. Comparison to structures of mGluR5 determined via cryo-EM.
(A) The cryo-EM–captured mGluR5 intermediate (top, right) and the MD-determined mGluR2 intermediate (middle, right) both exhibit two closed LBDs with substantial separation between their lower lobes (≥ 50 Å). mGluR5 structures were compared to the mGluR2 active state structure (PDB 4XAQ) and the mGluR2 inactive state structure (PDB 5KZN). The distances between upper and lower lobes of each clamshell correspond to the Cα–Cα distance between residues 144 and 272 (mGluR2) or residues 151 and 280 (mGluR5). LBD distances correspond to the distance between either chain's lower-lobe center of mass (residues 188–317 and 452–474 for mGluR2 or residues 195–327 and 465–487 for mGluR5). Note that simulated conformations of the mGluR2 LBD differ from that of the mGluR5 intermediate in terms of the relative positioning of the hydrophobic interface residues (overlay, far right) and in terms of (B) van der Waals contacts between upper lobe dimerization interface helices B and C. Contact matrices for six different mGluR5 (purple) and mGluR2 (teal) structures reveal conformation–specific contact patterns. In the R-O/O conformation, helices B and C form numerous self-contacts across the interface, while in the A-C/C conformation, helices B and C form numerous cross-interface interactions (off-diagonal elements). The simulated mGluR2 intermediate and the mGluR5 relaxed-closed/closed intermediate state are similar in that cross-protomer contact between helices B and C is minimal but differ in the degree to which one subunit has fully rotated with respect to the other, giving rise to the asymmetry observed in the mGluR2 intermediate's contact matrix.
Figure 1.
Figure 1.. Agonist-induced LBD closure is loosely coupled to intersubunit activation of the extracellular domain.
(A) Donor/acceptor pairs used to distinguish between intrasubunit LBD closure (left, middle-left) and intersubunit twisting (middle-right, right). For both pairs, adding agonist brings donor/acceptor pairs into closer proximity, thereby increasing the FRET signal. Detergent-solubilized receptors undergo stochastic labeling with donor and acceptor fluorophores via click chemistry, followed by low-density immobilization on a coverslip and single-molecule TIRF imaging. Analysis is limited to puncta with a single donor and single acceptor. (B) single-molecule FRET traces for the two FRET pairs, carried out in the presence of EC50 (10 μM) and saturating (10 mM) levels of glutamate. (C) smFRET histograms collected under a range of glutamate concentrations for each FRET pair. Lower right: 10 mM glutamate alone (black symbols) and along with either 100 μM of the positive allosteric modulator BINA (orange) or 4 μM of Gi1 (red). ≥ 4 movies per histogram; error bars represent standard error of the mean (s.e.m.).
Figure 2.
Figure 2.. An electrostatic network controls the relaxed–active conformational transition.
(A) Snapshots from an MD simulation, before and after the transition from an active, closed conformation to a relaxed, closed conformation. The distance between the upper and lower lobes of the LBD (or 'clamshell') is shown for each subunit and remains the same over the course of the simulation; by contrast, the distance between the lower lobe of each subunit increases substantially after the transition to values seen in relaxed-state structures. (B) Residues involved in cross-protomer interactions at the dimerization interface are shown on the structure of the mGluR2 LBD (left), and dimer interface cross-protomer contacts are shown over time using gray bars (downsampled every 12 ns; right). (C) smFRET experiments to monitor intersubunit twisting reveal that R177A and D95A mutations reduce population of the high-FRET peak (left). Percentage of high-FRET population in smFRET measurements of inter-subunit twisting on additional polar residues at the dimer interface (right); error bars represent standard error of the mean (s.e.m.) across ≥ 5 movies.
Figure 3.
Figure 3.. Glutamate binding differentially stabilizes interface helices.
(A) A dimerization interface mutant, mGluR2-R177A, exhibits reduced clamshell closure in response to 10 mM glutamate (black) compared to wild-type (compare to Figure 1C, lower left) or to mGluR2-R177A in the presence of high-affinity agonist LY379268 (purple). (B) Snapshots from MD simulation with just the R177-containing helix (helix D) shown (full structure on left) demonstrate how a key salt bridge breaks apart upon transition to the relaxed, closed intermediate (top) and how, after this transition, helix D becomes less ordered (bottom). 10 frames per image, downsampled every 360 ns, before and after the transition. (C) (Top) Woods plots from HDX-MS experiment at 30,000 s: each horizontal bar corresponds to a peptide representing a fragment of the mGluR2 LBD sequence identified by mass spectrometry; the height of each bar corresponds to the peptide's change in % deuteration in the presence vs. in the absence of 10 mM glutamate, such that negative values (blue) correspond to increased protection in 10 mM glutamate and positive values (red) correspond to decreased protection in 10 mM glutamate. (Bottom) The change in solvent-accessible surface area in an active-state crystal structure (PDB 4XAQ) vs. in a relaxed-state crystal structure (PDB 5KZN), normalized by peptide length (negative values indicate less solvent exposure in active state). Vertical, dashed red lines indicate ligand-contacting residues in the 4XAQ crystal structure. (D) Uptake plots from HDX-MS experiments demonstrate non-uniform changes in protection across interface helices B-D in the presence of 10 mM glutamate (purple) vs. 0 mM glutamate (yellow).
Figure 4.
Figure 4.. CRD linker acts as a brake on activation.
(A) smFRET histograms across increasing concentrations of glutamate, as in Figure 1, using the CRD twisting sensor. (B) Proportion of each smFRET distribution occupying the higher of two FRET states, for either the lower lobe reporter, shown in Fig. 1 (dashed line), or the CRD linker (solid line); bimodal fit carried out for on histogram generated from each movie, with error bars corresponding to S.E.M. for 4–5 movies per concentration. (C) Addition to 10 mM glutamate of the positive allosteric modulator BINA (orange) introduces a higher FRET peak at ~0.65, whereas addition of the inhibitory heterotrimeric G protein (Gi, blue) spreads to even higher FRET values. 0 mM glutamate (grey) and 10 mM glutamate (purple) replot smFRET distributions from panel (A). (D) Four representative smFRET traces for each condition shown in panel (C).
Figure 5.
Figure 5.. Differential population of mGluR2 LBD-closed states across mGluR heterodimers.
(A) FRET distributions in 10 μM clearly resolve open (low-FRET) and closed (high-FRET) peaks only in mGluR2/3 and mGluR2/4 heterodimers. (B) Representative traces from datasets in (A) show distinct mGluR2 LBD open–closed kinetics with different partner subunits. mGluR2/3 and mGluR2/4 display the longest-lived dwells in both LBD open and closed states, in agreement with the well-resolved FRET peaks in (B). (C) In the presence of Group III–specific agonist LSP4-2022, ligand binding to either the mGluR4 or the mGluR7 subunit induces some closure of unliganded mGluR2, with greater occupancy of the mGluR2 closed conformation in the presence of the mGluR7 subunit. (D) Representative traces for conditions shown in panel (C).

Similar articles

References

    1. Reiner A., Levitz J., Glutamatergic Signaling in the Central Nervous System: Ionotropic and Metabotropic Receptors in Concert. Neuron 98, 1080–1098 (2018). - PMC - PubMed
    1. Ellaithy A., Gonzalez-Maeso J., Logothetis D. A., Levitz J., Structural and Biophysical Mechanisms of Class C G Protein-Coupled Receptor Function. Trends Biochem. Sci. 45, 1049–1064 (2020). - PMC - PubMed
    1. T. S. F. Hansen Kasper B., Wollmuth Lonnie P., Bowie Derek, Furukawa Hiro, Menniti Frank S., Sobolevsky Alexander I., Swanson Geoffrey T., Swanger Sharon A., Greger Ingo H., Nakagawa Terunaga, McBain Chris J., Jayaraman Vasanthi, Low Chian-Ming, Mark L. Dell’Acqu, Structure, Function and Pharmacology of Glutamate Receptor Ion Channels. Pharmacol. Rev. 73, 298–487 (2021). - PMC - PubMed
    1. Koehl A., Hu H., Feng D., Sun B., Zhang Y., Robertson M. J., Chu M., Kobilka T. S., Laermans T., Steyaert J., Tarrasch J., Dutta S., Fonseca R., Weis W. I., Mathiesen J. M., Skiniotis G., Kobilka B. K., Structural insights into the activation of metabotropic glutamate receptors. Nature 566, 79–84 (2019). - PMC - PubMed
    1. Du J., Wang D., Fan H., Xu C., Tai L., Lin S., Han S., Tan Q., Wang X., Xu T., Zhang H., Chu X., Yi C., Liu P., Wang X., Zhou Y., Pin J. P., Rondard P., Liu H., Liu J., Sun F., Wu B., Zhao Q., Structures of human mGlu2 and mGlu7 homo- and heterodimers. Nature 594 (2021). - PubMed

Publication types