[Preprint]. 2024 Jun 11:2024.02.24.581671.
doi: 10.1101/2024.02.24.581671.

Ribonanza: deep learning of RNA structure through dual crowdsourcing

Affiliations

Ribonanza: deep learning of RNA structure through dual crowdsourcing

Shujun He et al. bioRxiv. .

Abstract

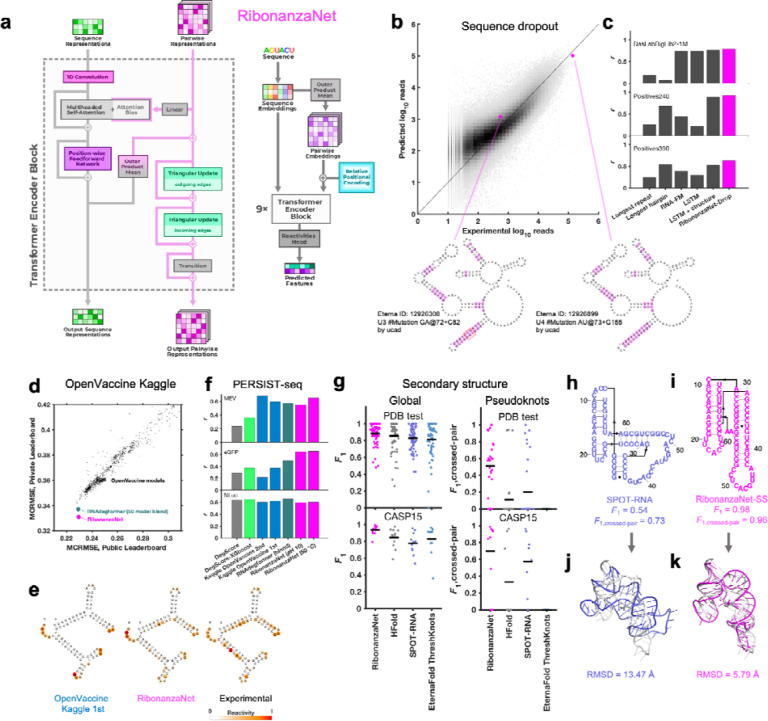
Prediction of RNA structure from sequence remains an unsolved problem, and progress has been slowed by a paucity of experimental data. Here, we present Ribonanza, a dataset of chemical mapping measurements on two million diverse RNA sequences collected through Eterna and other crowdsourced initiatives. Ribonanza measurements enabled solicitation, training, and prospective evaluation of diverse deep neural networks through a Kaggle challenge, followed by distillation into a single, self-contained model called RibonanzaNet. When fine tuned on auxiliary datasets, RibonanzaNet achieves state-of-the-art performance in modeling experimental sequence dropout, RNA hydrolytic degradation, and RNA secondary structure, with implications for modeling RNA tertiary structure.


Figures

Extended Data Figure 1.
Extended Data Figure 1.. Eterna OpenKnot challenge.
(a) Eterna interface, showing straight strings (white arrow) to mark pseudoknots modeled with EternaFold and ThreshKnot. (b-c) Accuracy of secondary structure modeling packages. Paired and unpaired nucleotides in secondary structure predictions were converted to 0 and 1; correlation coefficients (Spearman rs) were computed against SHAPE (2A3) data from two separate libraries with insert lengths of (b) 50 and (c) 90 nucleotides from Eterna OpenKnot pilot rounds; different colored bars show results from four and three replicates, respectively. Figure is limited to single-structure comparisons since most packages for pseudoknot prediction do not model structural ensembles. Data are derived from experiments on PK50 and PK90 listed in Supplemental Table S10. (d) Example of design card made available to Eterna players: chemical mapping data derived from DMS and 2A3 mapping experiments (top tracks) allow ranking of secondary structures (bottom tracks; ipknots = IPknot) predicted for a window of a MISL RNA from RFAM.
Extended Data Figure 2.
Extended Data Figure 2.. Signal-to-noise across Ribonanza data sets.
(a) Signal-to-noise ratio values estimated based on Illumina counting statistics predicts replicability as assessed by Pearson correlation coefficient r between replicate datasets; a signal-to-noise ratio of 1.0 corresponds to r = 0.80 (red lines). (b) The number of reads correlates with signal-to-noise ratio, with a read number of 500 corresponding to a mean signal-to-noise ratio of 1.0 (red lines). (c) Experiments that seek data on larger numbers of sequences or longer sequences (‘Positives240’, with insert length of 240 compared to 50–130 nucleotides) give smaller fractions of sequences with signal to noise ratio above 1.0 (red bars). Note shift in x-axis scale in right-hand four panels compared to left-hand four panels. In all panels, results for SHAPE profiles with the 2A3 modifier are shown. In (a)-(b), replica datasets were experiments for the Eterna OpenKnot Pseudoknot 50 (PK50) pilot datasets carried out with DNA prepared by two different synthesis companies (GenScript, Twist) by two different experimenters (P50LIB_2A3_000001, P50LIB_2A3_000002 in Supplemental Table S10).
Extended Data Figure 3.
Extended Data Figure 3.. Rationale for choosing mean absolute error (MAE) as evaluation metric for Ribonanza Kaggle competition.
(a) To determine what metric to use for scoring Kaggle submissions against experimental data, we rescored top 10 public/private submissions from the preceding OpenVaccine Kaggle competition (left) to see which metric resulted in the least shakeup between public leaderboard scores (test data for which participants could see scores but not individual data for continuous evaluation) and private leaderboard scores (test data completely unavailable to participants), as measured by Spearman rs between public/private scores. MAE was the best in preventing shakeup (highest Spearman rs between public/private scores). Consistent with OpenVaccine competition scoring, data were not clipped for OpenVaccine comparisons. (b) We rescored top 10 public/private submissions from the Ribonanza competition and confirmed that MAE had the highest Spearman rs between public/private scores (least shakeup). Consistent with Ribonanza competition scoring, data were clipped between 0 and 1 for Ribonanza comparisons.
Extended Data Figure 4.
Extended Data Figure 4.. Ribonanza results on Tetrahymena ribozyme.
(a) Secondary structure and (b) 2D map of stems and tetraloop/receptor tertiary contact inferred from cryo-EM structure (PDB: 7EZ0). M2 predictions from (c) RNAdegformer baseline, (d-f) Kaggle 1st, 2nd, and 3d place, and (g) RibonanzaNet models mark out stems in the molecule, including a P3 pseudoknot in the RNA’s catalytic core (gold), but different models predict different spurious stems (red labels), and all except Kaggle 2nd place model miss the tetraloop/receptor. (h) RibonanzaNet base pair score leads to (i) mostly accurate secondary structure prediction (F1 = 0.85) whose inaccuracy at pseudoknots is flagged by RibonanzaNet’s estimated accuracy value eF1,crossed pair = 0.46.
Extended Data Figure 5.
Different Kaggle models perform best for different test sub-libraries of the test set. Heatmap gives MAE accuracy to experimental data (here presented relative to mean MAE over top 10 models, shown in the top bar graph). Some of the larger sub-libraries were split (‘split A’, ‘split B’, etc.) to simplify data processing.
Extended Data Figure 6.
Extended Data Figure 6.. Full architecture diagrams of top 3 Ribonanza Kaggle models.
(a) 1st place model (team vigg), (b) 2nd place model (team hoyso), and (c) one of two models used for 3rd place submission (Twin Tower model from team ар ен κа).
Extended Data Figure 7.
Extended Data Figure 7.. Training RibonanzaNet.
(a) Steps taken to train RibonanzaNet, initially with pseudo labels from top 3 Kaggle submissions over the train sequences with noisy data; then training with pseudolabels expanded to include test data; and finally ‘semisupervised’ learning including actual data for train sequences. (b) improvements of RibonanzaNet test accuracy (MAE, mean absolute error to test data after clipping values between 0 and 1) as more pseudo-labels were included. ‘Gold zone’ and ‘prize zone’ mark 11th place and 6th place Kaggle scores which were cutoffs for Kaggle gold medals and prizes, respectively.
Extended Data Figure 8.
Extended Data Figure 8.. ArmNet (Artificial Reactivity Mapping using neural Networks) post-competition model from the vigg team.
(a) Two modifications to the Kaggle 1st place model improved performance: (1) adding the 1D convolutional module after each attention block, as was done in the Kaggle 2nd place solution, and (2) concatenating the attention scores and BPP features and combining them using the 2D convolutional layer of the next block. The second modification supports the idea from RibonanzaNet and the 3rd place solution – to provide two-way communication between the sequence and 2D features – is important for model performance. Triangular operations tested in RibonanzaNet were not included in ArmNet. (b) With input of BPP matrices from EternaFold and blending an increasing number of models (1, 3, 5, 7, 15), ArmNet outperforms all previous models in both private and public leaderboard MAE (light blue symbols). Without BPP and as a single model, ArmNet achieves excellent private leaderboard MAE when trained on pseudo labels from the 15-model ArmNet-BPPM ensemble (‘PL’; purple). When the single no-BPP ArmNet model is instead trained on pseudolabels derived from the top 3 Kaggle submissions (as in RibonanzaNet; Extended Data Figure 7), MAE scores are slightly worse than other ArmNet models and RibonanzaNet (not shown; see Supplemental Table S5). MAE is mean absolute error to test data after clipping values between 0 and 1. ‘Gold zone’ and ‘prize zone’ mark 11th place and 6th place Kaggle scores which were cutoffs for Kaggle gold medals and prizes, respectively.
Extended Data Figure 9.
Extended Data Figure 9.. Estimation of confidence in secondary structure modeling.
Expected eF1 (harmonic mean of base pair precision and recall) vs. actual F1 over (a) all base pairs and (b) just base pairs in pseudoknots (pairs i-j that ‘cross’ another pair m-n, i.e., i < m < j < n or m < i < n < j). Values for secondary structures in the test set as well as a random held out split of the train set (‘validation’), which were not used to fit the eF1 relations, are shown.
Extended Data Figure 10.
Extended Data Figure 10.. RibonanzaNet predictions for MERS frameshift stimulation element.
(a) Experimental and (b) RibonanzaNet-predicted mutate-and-map measurements for MERS FSE element. (c) Pair scores output by RibonanzaNet-SS. (d) Final secondary structure output after application of Hungarian algorithm to (c). The estimated accuracy values over the predicted structure and over just the crossed pairs are eF1 = 0.86 and eF1,crossed pair = 0.80, respectively.
Extended Data Figure 11.
Extended Data Figure 11.. Data ablation studies evaluated on the downstream task of RNA secondary structure.
RibonanzaNet was re-trained with randomly sampled subsets of the Kaggle Ribonanza training data (214,831 sequences with either 2A3/DMS profile with signal-to-noise > 1.0; five left most points); a post-competition Ribonanza+ data set for which higher signal-to-noise chemical mapping data were collected (494,111 sequences with either 2A3/DMS profile signal-to-noise > 1.0; sixth point); and the Ribonanza training data supplemented by pseudolabels for the training set (563k noisy training sequences with signal to noise < 1 in both 2A3 and DMS profiles; seventh point) and for the training and test set (2.1M sequences, the final RibonanzaNet model; eighth point). Each of these models was then fine-tuned and evaluated on the same training/test sets as RibonanzaNet-SS, as described in the main text. Chemical mapping MAE scores (light blue, top panel) and F1 scores for the entire secondary structure (magenta curves, middle and bottom panels) appear to saturate, reflecting intrinsic bounds in both metrics due to data quality and maximal accuracy of 1.0, respectively. However, the MAE computed over higher quality data (signal-to-noise > 5.0, blue, top panel) and the F1, crossed-pair scores (black and gray curves, middle and bottom panels) continue to improve with number of training sequences, suggesting good alignment of pre-training and downstream tasks.
Extended Data Figure 12.
Extended Data Figure 12.. Comparison of accuracy of 3D structures predicted by trRosettaRNA using RibonanzaNet-SS and SPOT-RNA secondary structures.
(a) RMSD or (b) lDDT of structures predicted by trRosettaRNA using secondary structure derived from RibonanzaNet or SPOT-RNA as an input feature. P-values of 0.698 and 0.405 for (a) and (b) are from paired Wilcoxon signed-rank test.
Extended Data Figure 13.
Extended Data Figure 13.. Analysis of RibonanzaNet secondary structure predictions as they relate to sequence and structural parameters.
(a) Secondary structure F1 scores for test sequences with respect to the length of the test sequence. (b) Comparison of secondary structure F1 scores for long sequences (greater than or equal to 75 nucleotides) or short sequences (less than 75 nucleotides). (c) Secondary structure F1 test scores with respect to sequence similarity of training sequences. (d) Comparison of secondary structure F1 score values with respect to sequence similarity, separated into sequences with similar sequences in the training dataset (E-value less than 1) and those with no discernible matches by nucleotide BLAST (E-value set to 1). (e) Secondary structure F1 score of test structures with respect to similarity of 3D structures used for fine-tuning, calculated via TM-score with US-align. (f) Comparison of secondary structure F1 scores with respect to TM-score discretized into test sequences with (TM-score greater than or equal to 0.45) and without (TM-score less than 0.45) a similar 3D structure in the PDB training data utilized during fine tuning. P-values (Wilcoxon rank sum test) for length, E-value and TM-score are 0.114, 0.286, and 0.664 respectively.
Figure 1.
Figure 1.. The Ribonanza challenge.
(a) Timeline of different rounds within the three tracks of Ribonanza: crowdsourced sequence collection, including Eterna design; RNA synthesis and chemical mapping; and crowdsourced deep learning on Kaggle. (b-c) Secondary structures with SHAPE (2A3) chemical reactivity data for sequences drawn from (b) diverse Eterna submissions and (c) expert databases (MISL RNA from RFAM;, miniTTR6 nanostructure designed in RNAmake from PDB 6DVK). For each Eterna and RFAM molecule, secondary structures from numerous modeling packages were compared to SHAPE data, and best-fit structure is shown. For miniTTR6, secondary structure and non-canonical base pairs (Leontis-Westhof annotation) were derived from the PDB. (d) Reactivity data from a genome scan of Middle Eastern Respiratory Virus; pseudoknotted structure shown on right. (e) Mutate-and-map experiments measure reactivity profiles for a sequence mutated at each nucleotide (left); column-wise Z-scores provide more ready visualization of perturbations at sites of mutations as well as at partners involved in Watson-Crick-Franklin stems (secondary structure) and tertiary structure, here shown for miniTTR6. (f) Replicate measurements by different experimenters based on DNA template libraries synthesized by different vendors confirm replicability (left); independently measured profiles with estimated mean signal-to-noise ratios as low as 1.0 (right) agree with Pearson’s correlation coefficient r > 0.80. Secondary structures in (b)-(d) were prepared in RiboDraw.
Figure 2.
Figure 2.. Realistic representations of RNA structure learned from chemical mapping data.
(a) RNAdegformer model consists of Transformer encoder layers supplemented by convolutions. Attention matrices are biased by sequence-distance matrices and, optionally, base pairing probability (BPP) matrices from conventional secondary structure modeling algorithms, here EternaFold. (b) Increasing training data improves RNAdegformer modeling accuracy more rapidly for sequence-only models than for models with BPP input. MAE is mean absolute error on chemical reactivity, after clipping data and predictions to values between 0.0 and 1.0. The curve fits assume a simple power law, MAE = a + b Sequencesc, where a, b, and c are fit parameters. (c-d) Mutate-and-map predictions for the MERS frameshift stimulation element by RNAdegformer models trained with increasing amount of chemical mapping data either (c) with or (d) without BPP input.
Figure 3.
Figure 3.. Diverse deep learning models from Kaggle Ribonanza challenge.
(a) Scores on test sets used for continuous evaluation (Public Leaderboard) vs. prospective evaluation (Private Leaderboard). MAE is mean absolute error compared to experimental chemical reactivity data, after clipping data and predictions between 0.0 and 1.0. (b) MAE between different models suggests diversity in predictions even within top 10 Kaggle models. (c-f) Mutate-and-map data for the MERS frameshift stimulation element, as measured through SHAPE/2A3 experiments and predicted by 1st, 2nd, and 3rd place Kaggle models. To obtain sufficient signal-to-noise, each row in (c) averages over all sequences that harbored a mutation at the corresponding position. (g-i) Transformer encoder operations for (g) 1st place model (team vigg), (h) 2nd place model (team hoyso), and (i) one of two models used for 3rd place submission (ар ен κа). Diagrams of full architectures provided in Extended Data Fig. 6.
Figure 4.
Figure 4.. RibonanzaNet model and fine-tuning for downstream tasks.
(a) RibonanzaNet architecture unifies features of RNAdegformer and top Kaggle models into a single, self-contained model. (b) Predictions of RibonanzaNet-Drop for sequence dropout during SHAPE chemical mapping experiments, tested on DasLabBigLib2–1M after fine-tuning on Illumina sequence read counts in DasLabBigLib-1M. Diagrams depict similar sequences (differences highlighted in magenta; red rounded rectangle in left-hand diagram show G-C pairs stabilizing long stem) with identical predicted secondary structures (pseudoknot not shown) but different levels of dropout. (c) Pearson correlation coefficients of logarithm of sequencer read counts compared to RibonanzaNet-Drop and baseline models for three test sets. (d) Modeling accuracy of RibonanzaNet-Deg for OpenVaccine test sets (Public & Private Leaderboard) after fine-tuning on OpenVaccine training examples. MCRMSE: mean column root mean squared error for SHAPE reactivity and two degradation conditions (pH 10 and 50 °C, 10 mM MgCl2, 1 day). (e) SHAPE reactivity of OpenVaccine test molecule ‘2204Sept042020’ predicted by top model in Kaggle OpenVaccine competition (‘Nullrecurrent’) and RibonanzaNet, compared to experimental profile. (f) Pearson correlation coefficients of degradation profiles predicted by different algorithms compared to degradation rates measured by PERSIST-seq for mRNA molecules encoding a multi-epitope vaccine SARS-CoV-2 (MEV), enhanced green fluorescent protein (eGFP), and nanoluciferase (NLuc). (g) Secondary structure accuracies of RibonanzaNet-SS and other packages on a temporally split PDB test set (top) and CASP15 RNA targets (bottom). F1 is harmonic mean of precision and recall of base pairs; lines in violin plots display mean F1. (h-i) Secondary structure models for CASP15 target R1107, human CPEB3 ribozyme, derived from (h) SPOT-RNA and (i) RibonanzaNet. (j-k) Overlay of X-ray structure (white) and 3D models using trRosettaRNA guided by secondary structures from (j) SPOT-RNA and (k) RibonanzaNet.

Similar articles

References

    1. Jumper J., Evans R., Pritzel A., Green T., Figurnov M., Ronneberger O., Tunyasuvunakool K., Bates R., Žídek A., Potapenko A., Bridgland A., Meyer C., Kohl S. A. A., Ballard A. J., Cowie A., Romera-Paredes B., Nikolov S., Jain R., Adler J., Back T., Petersen S., Reiman D., Clancy E., Zielinski M., Steinegger M., Pacholska M., Berghammer T., Bodenstein S., Silver D., Vinyals O., Senior A. W., Kavukcuoglu K., Kohli P. & Hassabis D. Highly accurate protein structure prediction with AlphaFold. Nature 596, 583–589 (2021). - PMC - PubMed
    1. Baek M., DiMaio F., Anishchenko I., Dauparas J., Ovchinnikov S., Lee G. R., Wang J., Cong Q., Kinch L. N., Schaeffer R. D., Millán C., Park H., Adams C., Glassman C. R., DeGiovanni A., Pereira J. H., Rodrigues A. V., van Dijk A. A., Ebrecht A. C., Opperman D. J., Sagmeister T., Buhlheller C., Pavkov-Keller T., Rathinaswamy M. K., Dalwadi U., Yip C. K., Burke J. E., Garcia K. C., Grishin N. V., Adams P. D., Read R. J. & Baker D. Accurate prediction of protein structures and interactions using a three-track neural network. Science 373, 871–876 (2021). - PMC - PubMed
    1. Wang W., Feng C., Han R., Wang Z., Ye L., Du Z., Wei H., Zhang F., Peng Z. & Yang J. trRosettaRNA: automated prediction of RNA 3D structure with transformer network. Nat. Commun. 14, 7266 (2023). - PMC - PubMed
    1. Baek M., McHugh R., Anishchenko I., Jiang H., Baker D. & DiMaio F. Accurate prediction of protein-nucleic acid complexes using RoseTTAFoldNA. Nat. Methods 21, 117–121 (2024). - PMC - PubMed
    1. Chen K., Zhou Y., Wang S. & Xiong P. RNA tertiary structure modeling with BRiQ potential in CASP15. Proteins 91, 1771–1778 (2023). - PubMed

Publication types