. 2024 Jan 9;11(3):uhae004.
doi: 10.1093/hr/uhae004. eCollection 2024 Mar.

Cuticular wax biosynthesis in blueberries (Vaccinium corymbosum L.): Transcript and metabolite changes during ripening and storage affect key fruit quality traits

Affiliations

Cuticular wax biosynthesis in blueberries (Vaccinium corymbosum L.): Transcript and metabolite changes during ripening and storage affect key fruit quality traits

Yifan Yan et al. Hortic Res. .

Abstract

In fruits, cuticular waxes affect fruit quality traits such as surface color at harvest and water loss during postharvest storage. This study investigated the transcriptional regulation of cuticular wax deposition in northern highbush blueberries (Vaccinium corymbosum L.) in relation to fruit water loss and surface color during ripening and postharvest storage, as well as the effects of abscisic acid (ABA)-mediated changes in cuticular wax deposition on these fruit quality traits. Total cuticular wax content (μg∙cm-2) decreased during fruit ripening and increased during postharvest storage. Transcriptome analysis revealed a transcript network for cuticular wax deposition in blueberries. Particularly, five OSC-Likes were identified as putative genes for triterpene alcohol production, with OSC-Like1 and OSC-Like2 encoding mixed amyrin synthases, OSC-Like3 encoding a lupeol synthase, and OSC-Like4 and OSC-Like5 encoding cycloartenol synthases. The expression of three CYP716A-like genes correlated to the accumulation of two triterpene acids oleanolic acid and ursolic acid, the major wax compounds in blueberries. Exogenous ABA application induced the expression of triterpenoid biosynthetic genes and the accumulation of β-amyrin and oleanolic acid, as well as increased the ratio of oleanolic acid to ursolic acid. These changes were associated with reduced fruit water loss. The content of β-diketones was also increased by ABA application, and this increase was associated with increased fruit lightness (measured as L* using CIELAB Color Space by a colorimeter). This study provided key insights on the molecular basis of cuticular wax deposition and its implications on fruit quality traits in blueberries.

Keywords: Triterpenoids; abscisic acid; fruit color; fruit water loss; transcriptomics; β-diketones.


Conflict of interest statement

No potential conflict of interest was reported by the authors.

Figures

Figure 1
Figure 1
Cuticular wax deposition and its effect on fruit weight loss (%) during fruit ripening and postharvest storage in ‘Calypso’ (A, C, E, and G) and ‘Last Call’ (B, D, F, and H) blueberries. (A–B) Changes in cuticular wax content (μg cm−2); (C–D) changes in cuticular wax load (μg berry−1); (E–F) principal component analysis (PCA) on individual wax contents; (G–H) fruit weight loss (%) during storage at 20°C and 35% relative humidity (RH) for eleven days. Data presented in (A–D) and (G–H) are means ± standard error (SE, n = 3), and in (E–F) are the means of three replicates. One-way ANOVA was performed in (A–D), different letters identify significant differences of each wax group among stages. Repeated measures one-way ANOVA was performed in (G–H), different letters identify significant differences in fruit weight loss among stages. Means were separated according to LSD tests (p < 0.05). The acronyms W2 and W4 stand for two and four weeks after postharvest storage, respectively; ‘*’ indicates aliphatic compounds that did not include β-diketones (i.e. fatty acids, alcohols, esters, aldehydes, and alkanes).
Figure 2
Figure 2
Cuticular wax deposition and berry phenotypic traits in response to exogenous abscisic acid (ABA) application during fruit ripening and postharvest storage in ‘Calypso’ and ‘Last Call’. (A) Heatmaps displaying percentage change (%) of total and individual wax contents between ABA and control (CN) treatments in ‘Calypso’ (top) and ‘Last Call’ (bottom); the asterisks identify significant (p < 0.05) changes between ABA and CN treatments according to Student’s t-test. (B) Table displaying fruit water loss rate (μg cm−2 h−1) and lightness level (measured as L* by a colorimeter); two-way ANOVA was performed, and no interactions were found between stages and treatments; ‘***’ identifies p < 0.001, ‘**’ identifies p < 0.01, ‘*’ identifies p < 0.05, ‘ns’ identifies a non-significant effect (p > 0.05); different letters identify significant differences (p < 0.05) between treatments, means were separated according to LSD tests. (C) Pearson correlation map (n = 36) displaying the relationships between percentage changes (ABA/CN) in cuticular waxes and percentage changes (ABA/CN) in berry phenotypic traits in ‘Calypso’ and ‘Last Call’ during fruit ripening and postharvest storage; blue circles identify significant (p < 0.05) negative correlations, red circles identify significant (p < 0.05) positive correlations. Larger and darker circles identify stronger correlations. Crosses identify non-significant (p > 0.05) correlations. Data presented in (A) and (C) are the means of three biological replicates, data presented in (B) are the means ± standard error (SE, n = 3).
Figure 3
Figure 3
Differential gene expression analysis (A–D) and enrichment analysis (E–L) in control (CN) ‘Calypso’ blueberries during fruit ripening and postharvest storage. In each row from left to right, each panel represents the comparison between Red and Green stage, Harvest and Red stage, W2 and Harvest stage, and W4 and W2 stage, respectively. (A–D) Volcano plots for differentially expressed genes (DEGs, adjusted p-value < 0.05 or log2 fold change [FC] < −2 or log2 FC > 2) between each comparison; blue dots refer to downregulated genes, red dots refer to upregulated genes, and grey dots refer to unaffected genes. (E–L) Enriched (false discovery rate [FDR] < 0.01) wax-related gene ontology (GO) terms between each comparison within upregulated (E–H) and downregulated (I–L) genes; line graph indicates the log10p value of each GO term, bar graph indicates the percentage of upregulated or downregulated genes in each GO term; log10p-value = 0 and percentage of upregulated or downregulated genes = 0 identify non-enriched GO terms (FDR > 0.01).
Figure 4
Figure 4
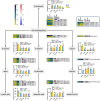
Transcriptional regulation of aliphatic compounds during fruit ripening and postharvest storage and in response to exogenous ABA application in ‘Calypso’. (A) Biosynthetic pathway for very-long-chain (VLC) aliphatic compounds (except for β-diketones); (B) biosynthetic pathway for β-diketones and derivatives; (C) transcription factors (TFs) and other regulatory genes involved in aliphatic compound biosynthesis (presented in the dark blue frame box). Dashed arrows indicate biosynthetic steps producing compounds that are not detected in this study. DESeq2 normalized expression counts in control (CN) treatment are presented at Green, Red, Harvest, W2, and W4 stages (from left to right) in the left heatmap; yellow and purple boxes indicate low and high expression levels, respectively. Log2 fold change (FC) (ABA/CN) of expression levels are presented at Green, Red, Harvest, W2, and W4 stages (from left to right) in the right heatmap; blue and red boxes indicate downregulation and upregulation of genes, respectively, by exogenous abscisic acid (ABA) application; asterisks indicate significant differences (adjusted p-values < 0.05) according to the differential expression analysis. Data presented in the heatmaps are the means of three biological replicates. Expression of genes involved in each step are presented at the right side of the corresponding arrow, except for the first step (from C16 and C18 fatty acyl-CoA to VLC fatty acids), where I, II, III, and IV stand for the four enzymatic reactions involved in fatty acid elongation, catalyzed by β-ketoacyl-CoA synthase (CER2, CER6, and CER26), β-ketoacyl-CoA reductase (KCR1), β-hydroxyacyl-CoA dehydrogenase (PAS2), and trans-Δ2-enoyl-CoA reductase (CER10), respectively. The expression of major genes involved in each reaction are presented at the left side of corresponding arrow, expression of additional KCS genes (KCS1, KCS3, KCS4, KCS10, KCS11, and KCS13) are presented at the right side. The contents of individual wax groups at Green, Red, Harvest, W2, and W4 stages in CN (blue bar) and ABA (yellow bar) treatments are presented in bar graphs on the right side of the corresponding wax groups (in grey frames). Data presented in bar graphs are the means ± standard error (SE, n = 3); significant effects of stages, treatments, and their interaction were tested by two-way ANOVA; capital letters identify significantly different (p < 0.05) wax contents among stages, when no interaction was found between stages and treatments. One-way ANOVA was further performed to identify significant effects of stages and treatments when a significant interaction was found between stages and treatments; lower-case letters identify significantly different (p < 0.05) wax contents among stages and between treatments; means were separated according to LSD tests.
Figure 5
Figure 5
Transcriptional regulation of cyclic compounds during fruit ripening and postharvest storage and in response to exogenous abscisic acid (ABA) application in ‘Calypso’. Dashed arrows indicate biosynthetic steps producing compounds that are not detected in this study. DESeq2 normalized expression counts in control (CN) treatment are presented at Green, Red, Harvest, W2, and W4 stages (from left to right) in the left heatmap; yellow and purple boxes indicate low and high expression levels, respectively. Log2 fold change (FC) (ABA/CN) of expression levels are presented at Green, Red, Harvest, W2, and W4 stages (from left to right) in the right heatmap; blue and red boxes indicate downregulation and upregulation of genes, respectively, by exogenous abscisic acid (ABA) application; asterisks indicate significant differences (adjusted p-values < 0.05) according to the differential expression analysis. Data presented in the heatmaps are the means of three biological replicates. Expression of genes involved in each step are presented at the right side of the corresponding arrow (OSC and CYP716A subfamily monooxygenases are potentially multifunctional); expression of transcription factors (TFs, MYB61) is highlighted in the dark blue frame box at the top right corner. The contents of individual cyclic compounds at Green, Red, Harvest, W2, and W4 stages in CN (blue bar) and ABA (yellow bar) treatments are presented in bar graphs on the right side of the corresponding cyclic compounds (in grey frames). Data presented in bar graphs are the means ± standard error (SE, n = 3); significant effects of stages, treatments, and their interaction were tested by two-way ANOVA; capital letters identify significantly different (p < 0.05) wax contents among stages, when no interaction was found between stages and treatments; one-way ANOVA was further performed to identify significant effects of stages and treatments when a significant interaction was found between stages and treatments; lower-case letters identify significantly different (p < 0.05) wax contents among stages and between treatments; means were separated according to LSD tests.
Figure 6
Figure 6
Pearson correlation heatmap (n = 15) between the contents of cuticular waxes and the expression levels of wax-related genes in ‘Calypso’ blueberries. (A) Correlation between aliphatic compounds and related genes; (B) correlation between β-diketones and related genes; (C) correlation between cyclic compounds and related genes. Cuticular wax contents and DESeq2 normalized expression counts were log10 (x + 1) transformed; data were re-ordered by hierarchical clustering; the row names and correlation coefficient of panels (A–C) could be referred to Tables S7–S9, respectively.
Figure 7
Figure 7
Phylogenetic relationships of putative oxidosqualene cyclases (OSCs) in blueberries (highlighted by red text) and homologs (highlighted by blue text) in other species. The catalytic specificities of OSCs are highlighted by different color frames (pink: lupeol synthases; light blue: cycloartenol synthases; light yellow: α-amyrin synthases; light green: β-amyrin or multifunctional triterpene alcohol synthases). Numbers represent the bootstrap values for each node (1000 replicates). The asterisks indicate functionally characterized genes in other species. Protein motifs of each OSC are displayed in differentially colored boxes. The sequence information of each motif is provided in the legend.
Figure 8
Figure 8
Predicted transcript–metabolite networks related to cyclic compounds in blueberries during fruit ripening and postharvest storage, and in response to exogenous ABA application. Transcripts and metabolites are represented by diamond and circle nodes, respectively. Edges represent associations (r > 0.8 and p < 0.05) between transcripts and metabolites. The top 100 correlators for each metabolite are shown. Node borders in grey represent transcripts that are not deferentially expressed by ABA treatment at any stage; node borders in red represent transcripts that are upregulated by ABA treatments at one or more stages; node borders in blue represent transcripts that are downregulated by ABA treatments at one or more stages; node borders in green represent transcripts that are upregulated or downregulated by ABA treatments at different stages. Node colors in purple represent transcripts involved in cyclic compound biosynthesis (OSC-Like and CYP716A-Like genes identified in section 2.4); node colors in cyan represent transcripts potentially involved in cyclic compound biosynthesis (protein sequences of these potential transcripts share the same Pfam with OSC and CYP716A proteins); node colors in orange represent transcription factors (TFs, protein sequences of these potential transcripts contain at least one Pfam for transcriptional regulation) potentially involved in cyclic compound biosynthesis.

References

    1. Fernández-Muñoz R, Heredia A, Domínguez E. The role of cuticle in fruit shelf-life. Curr Opin Biotechnol. 2022;78:102802 - PubMed
    1. Yan Y, Dossett M, Castellarin SD. Cuticular waxes affect fruit surface color in blueberries. Plants, People, Planet. 2023;5:736–51
    1. Yan Y, Castellarin SD. Blueberry water loss is related to both cuticular wax composition and stem scar size. Postharvest Biol Technol. 2022;188:111907
    1. Busta L, Jetter R. Moving beyond the ubiquitous: the diversity and biosynthesis of specialty compounds in plant cuticular waxes. Phytochem Rev. 2018;17:1275–304
    1. Sawai S, Saito K. Triterpenoid biosynthesis and engineering in plants. Front Plant Sci. 2011;2:1–8 - PMC - PubMed