

Investigating the causal relationship and potential shared diagnostic genes between primary biliary cholangitis and systemic lupus erythematosus using bidirectional Mendelian randomization and transcriptomic analyses
- PMID: 38464525
- PMCID: PMC10921416
- DOI: 10.3389/fimmu.2024.1270401
Investigating the causal relationship and potential shared diagnostic genes between primary biliary cholangitis and systemic lupus erythematosus using bidirectional Mendelian randomization and transcriptomic analyses
Abstract
Background: The co-occurrence of primary biliary cholangitis (PBC) and systemic lupus erythematosus (SLE) has been consistently reported in observational studies. Nevertheless, the underlying causal correlation between these two conditions still needs to be established.
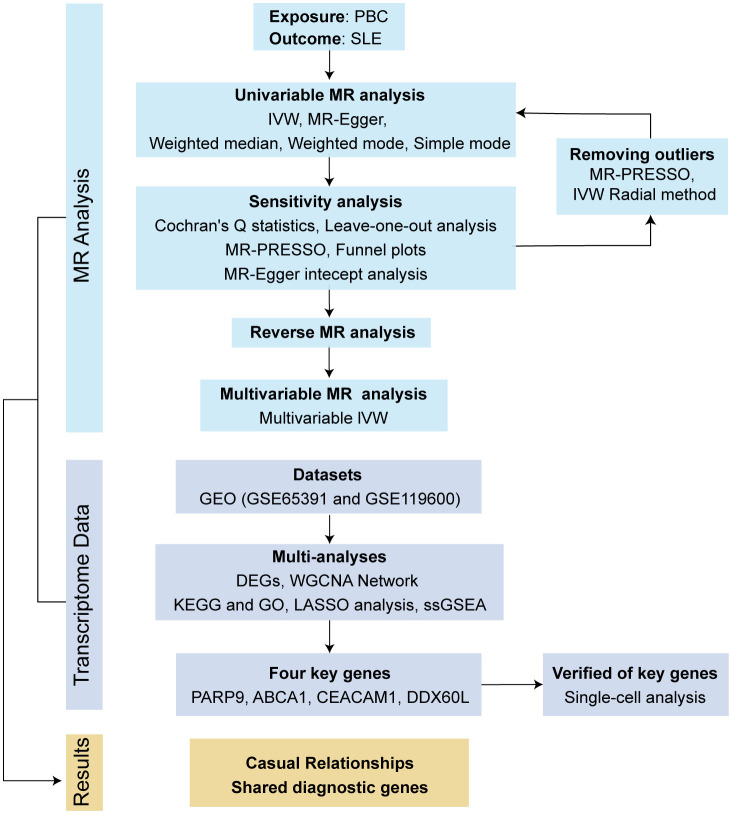
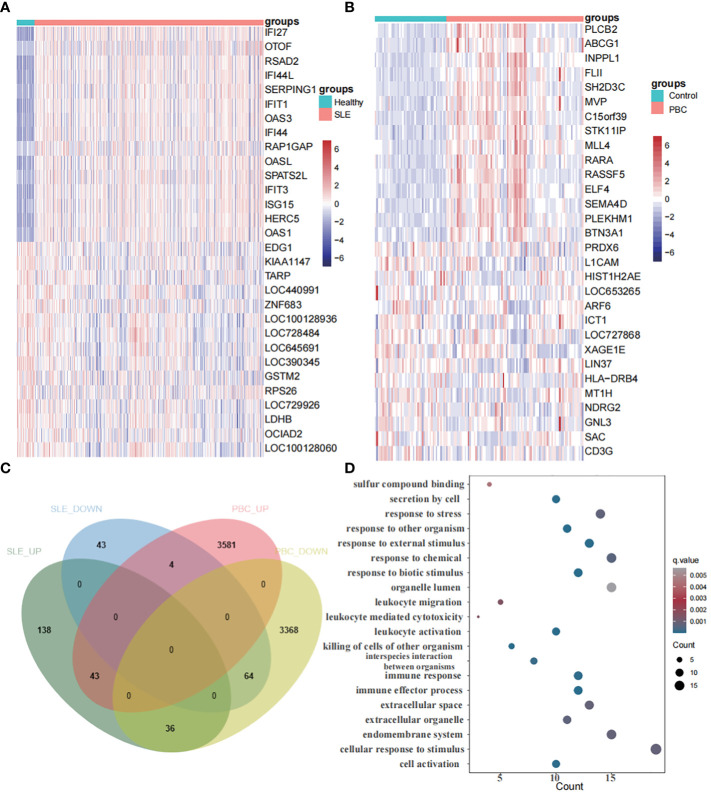
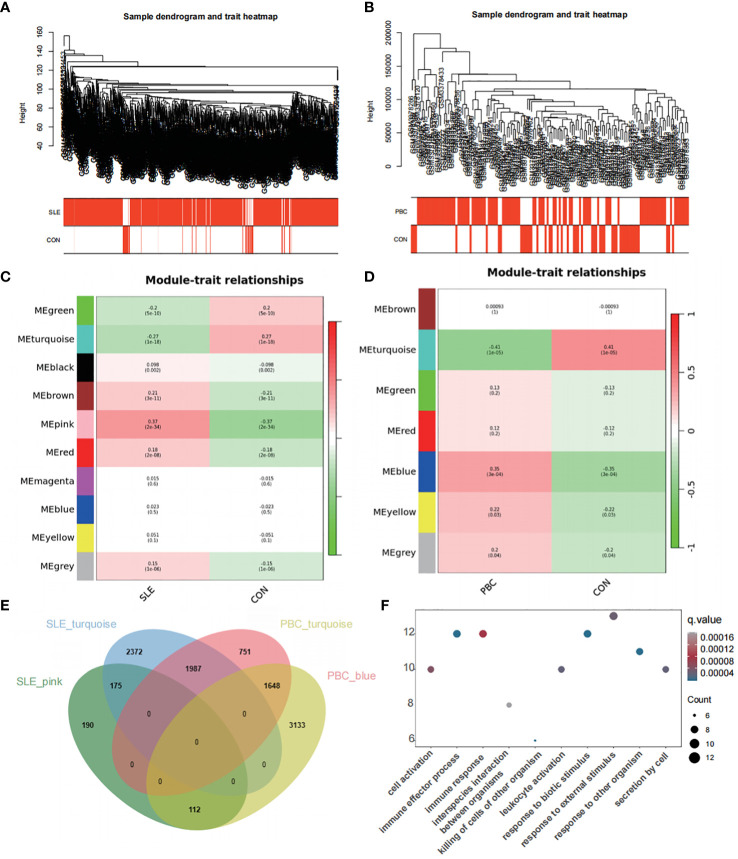
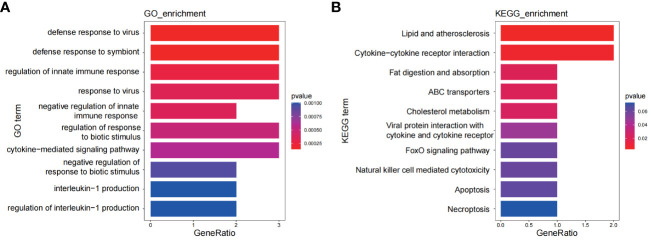
Methods: We performed a bidirectional two-sample Mendelian randomization (MR) study to assess their causal association. Five MR analysis methods were utilized for causal inference, with inverse-variance weighted (IVW) selected as the primary method. The Mendelian Randomization Pleiotropy RESidual Sum and Outlier (MR-PRESSO) and the IVW Radial method were applied to exclude outlying SNPs. To assess the robustness of the MR results, five sensitivity analyses were carried out. Multivariable MR (MVMR) analysis was also employed to evaluate the effect of possible confounders. In addition, we integrated transcriptomic data from PBC and SLE, employing Weighted Gene Co-expression Network Analysis (WGCNA) to explore shared genes between the two diseases. Then, we used Gene Ontology (GO) and Kyoto Encyclopedia of Genes and Genomes (KEGG) pathway enrichment methods to perform on the shared genes. The Least Absolute Shrinkage and Selection Operator (LASSO) regression algorithm was utilized to identify potential shared diagnostic genes. Finally, we verified the potential shared diagnostic genes in peripheral blood mononuclear cells (PBMCs)-specific cell populations of SLE patients by single-cell analysis.
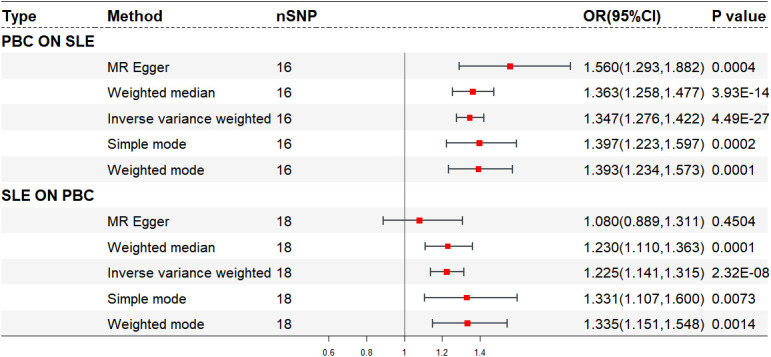
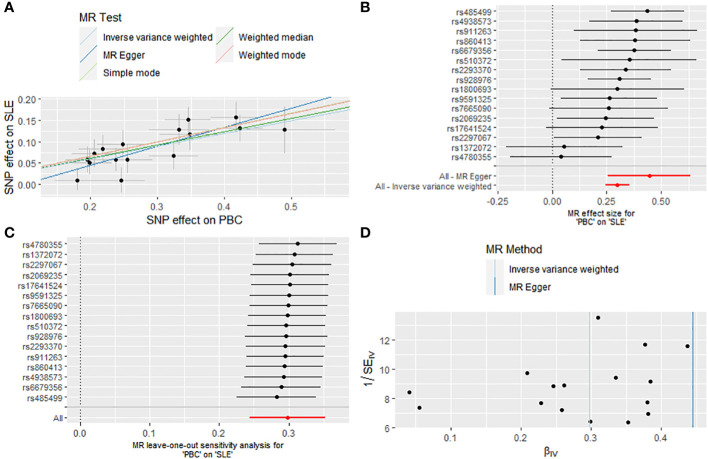
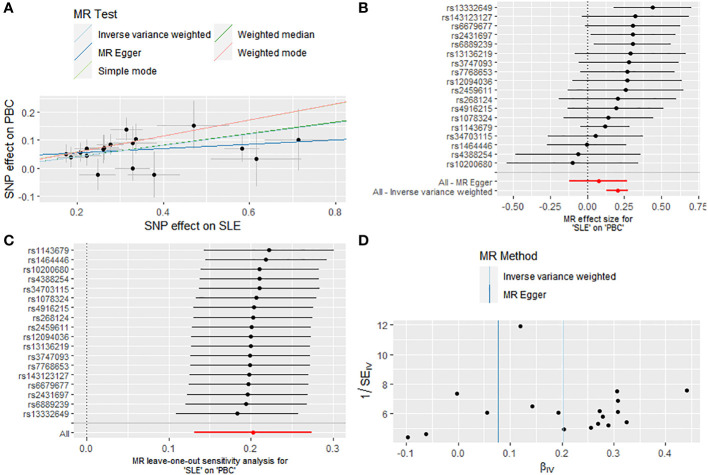
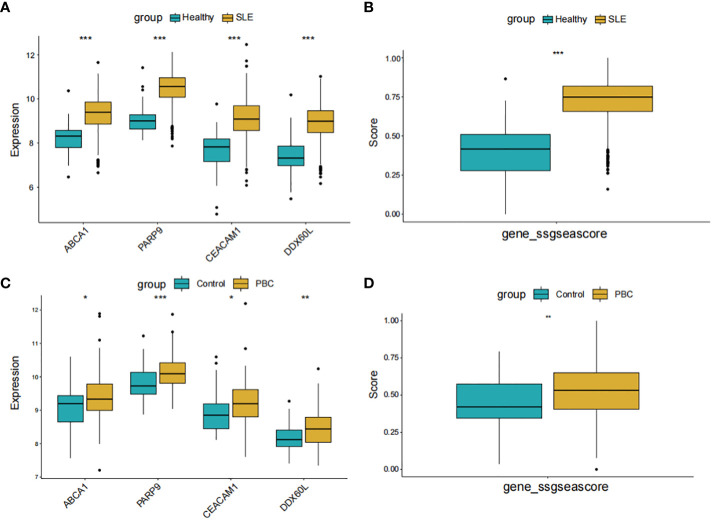
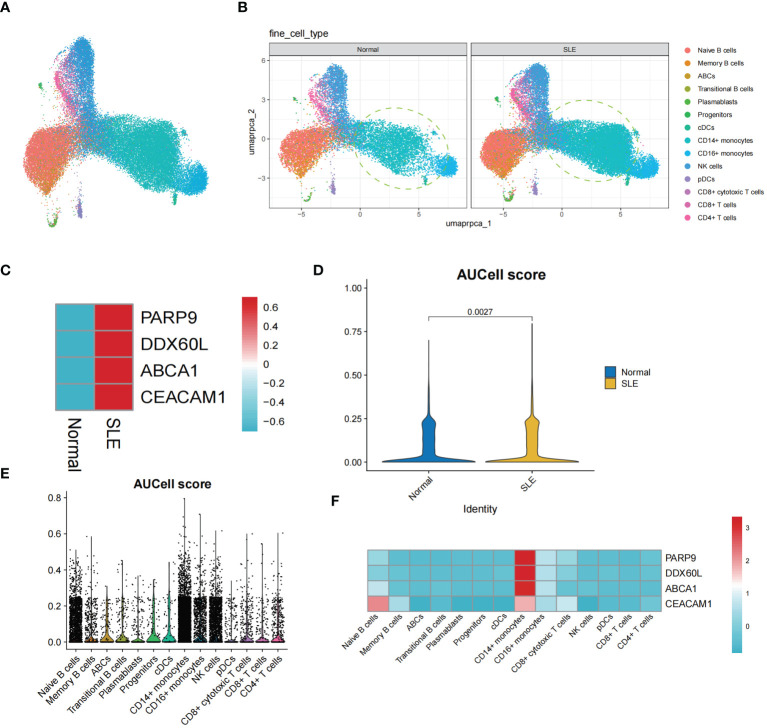
Results: Our MR study provided evidence that PBC had a causal relationship with SLE (IVW, OR: 1.347, 95% CI: 1.276 - 1.422, P < 0.001) after removing outliers (MR-PRESSO, rs35464393, rs3771317; IVW Radial, rs11065987, rs12924729, rs3745516). Conversely, SLE also had a causal association with PBC (IVW, OR: 1.225, 95% CI: 1.141 - 1.315, P < 0.001) after outlier correction (MR-PRESSO, rs11065987, rs3763295, rs7774434; IVW Radial, rs2297067). Sensitivity analyses confirmed the robustness of the MR findings. MVMR analysis indicated that body mass index (BMI), smoking and drinking were not confounding factors. Moreover, bioinformatic analysis identified PARP9, ABCA1, CEACAM1, and DDX60L as promising diagnostic biomarkers for PBC and SLE. These four genes are highly expressed in CD14+ monocytes in PBMCs of SLE patients and potentially associated with innate immune responses and immune activation.
Conclusion: Our study confirmed the bidirectional causal relationship between PBC and SLE and identified PARP9, ABCA1, CEACAM1, and DDX60L genes as the most potentially shared diagnostic genes between the two diseases, providing insights for the exploration of the underlying mechanisms of these disorders.
Keywords: Mendelian randomization; causal relationship; primary biliary cholangitis; systemic lupus erythematosus; transcriptomic data.
Copyright © 2024 Tao, Tang, Lv, Yuan, Wu, Zhao and Chen.
Conflict of interest statement
The authors declare that the research was conducted in the absence of any commercial or financial relationships that could be construed as a potential conflict of interest.
Figures
References
Publication types
MeSH terms
Substances
LinkOut - more resources
Full Text Sources
Medical
Research Materials
Miscellaneous