. 2024 Feb 23:15:1331210.
doi: 10.3389/fimmu.2024.1331210. eCollection 2024.

Extracellular vesicles released by microglia and macrophages carry endocannabinoids which foster oligodendrocyte differentiation

Affiliations

Extracellular vesicles released by microglia and macrophages carry endocannabinoids which foster oligodendrocyte differentiation

Marta Lombardi et al. Front Immunol. .

Abstract

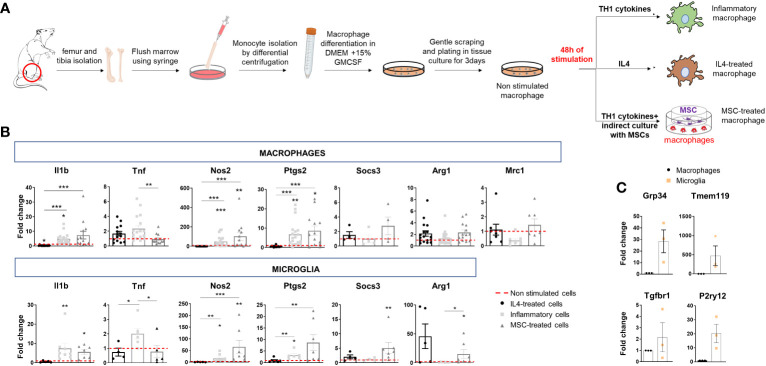
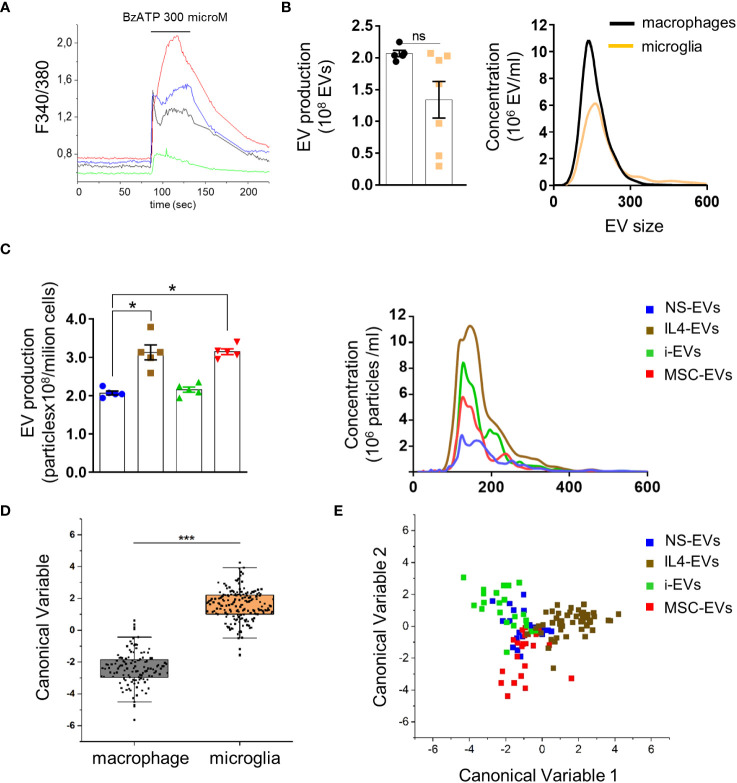
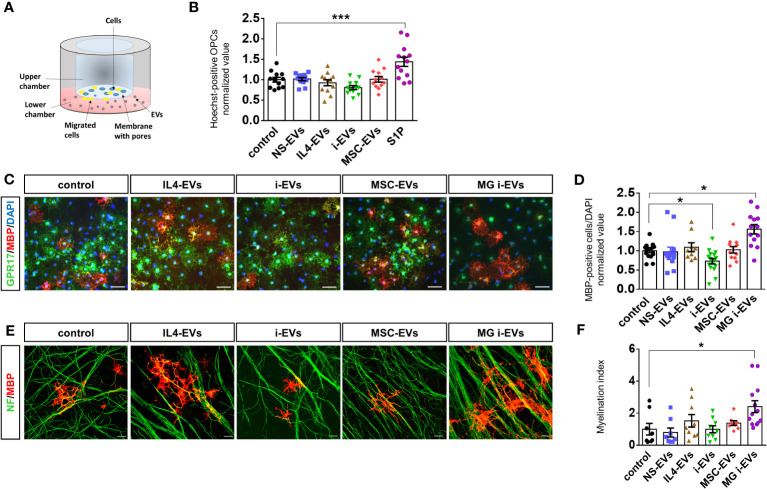
Introduction: Microglia and macrophages can influence the evolution of myelin lesions through the production of extracellular vesicles (EVs). While microglial EVs promote in vitro differentiation of oligodendrocyte precursor cells (OPCs), whether EVs derived from macrophages aid or limit OPC maturation is unknown.

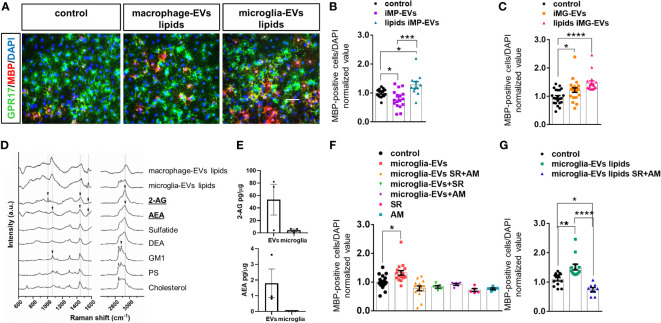
Methods: Immunofluorescence analysis for the myelin protein MBP was employed to evaluate the impact of EVs from primary rat macrophages on cultured OPC differentiation. Raman spectroscopy and liquid chromatography-mass spectrometry was used to define the promyelinating lipid components of myelin EVs obtained in vitro and isolated from human plasma.

Results and discussion: Here we show that macrophage-derived EVs do not promote OPC differentiation, and those released from macrophages polarized towards an inflammatory state inhibit OPC maturation. However, their lipid cargo promotes OPC maturation in a similar manner to microglial EVs. We identify the promyelinating endocannabinoids anandamide and 2-arachidonoylglycerol in EVs released by both macrophages and microglia in vitro and circulating in human plasma. Analysis of OPC differentiation in the presence of the endocannabinoid receptor antagonists SR141716A and AM630 reveals a key role of vesicular endocannabinoids in OPC maturation. From this study, EV-associated endocannabinoids emerge as important mediators in microglia/macrophage-oligodendrocyte crosstalk, which may be exploited to enhance myelin repair.

Keywords: 2-arachidonoylglycerol; anandamide; endocannabinoids; extracellular vesicles; macrophages; microglia; oligodendrocytes.


Conflict of interest statement

The authors declare that the research was conducted in the absence of any commercial or financial relationships that could be construed as a potential conflict of interest. The author(s) declared that they were an editorial board member of Frontiers, at the time of submission. This had no impact on the peer review process and the final decision.

Figures

Figure 1
Figure 1
Polarization of bone marrow-isolated macrophages and expression of inflammatory and pro-regenerative markers. (A) Schematic representation of macrophage differentiation and polarization in vitro. (B) Gene expression of inflammatory markers (Il1b, Tnf, Nos2 and Ptgs2) and pro-regenerative markers (Socs3, Arg1, Mrc1) in macrophages (top) and microglia (bottom) under the same experimental conditions: IL4 treatment, stimulation with inflammatory cytokines (inflammatory cells) or inflammatory cytokines and MSCs (MSC-treated cells). Data are normalized to non-stimulated cells (fold change of 1) (macrophages, Kruskal–Wallis test with Dunn’s multiple comparison: Il1b p<0.0001 number of independent experiments N=13; Tnf p=0.0024 N=12; Nos2 p<0.0001 N=12; Ptgs2 p<0.0001 N=13; Socs3 p=0.3221 N=4; Arg1 p=0.0414 N=14; Mrc1 p=0.0398 N=7. microglia, Kruskal–Wallis test with Dunn’s multiple comparison: Il1b p<0,0001 N=5; Tnf p=0.0071 N=4; Nos2 p<0,0001 N=5; Ptgs2 p=0.0005 N=6; Socs3 p=0.0080 N=4; Arg1 p=0.0026 N=5). (C) Low gene expression of homeostatic microglia markers (Gpr34, Tmem119, Tgfbr1, P2yr12) in bone marrow-derived macrophages compared to microglia in primary cultures (N=3/group; Gpr34 t-test p=0.0493, Tmem119 t-test p=0.1397 and P2ry12 t-test p=0.0419 p=0.1000, Tgfbr1, t-test p=0.4142).
Figure 2
Figure 2
Quantification and Raman spectroscopy analysis of EVs produced by macrophages with different states versus microglia-derived EVs. (A) Temporal analysis of changes of intracellular calcium concentration, expressed as F340/380, in fura-2-loaded macrophages exposed to 300 μM BzATP (N of analyzed cells=50). Representative traces from four distinct macrophages are shown in distinct colors. (B) EV production (left) and size profile (right) from 1 x 10⁶ non stimulated macrophages or microglia, quantified by NTA (N = 5 macrophages, N=7 microglia; Mann Whitney t-test p=0.0732). EV size, Mean±SEM: 176.0 ± 32.53 nm macrophages, 204.0 ± 50.91 nm microglia. (C) The graphs show production (left) and size distribution (right) of EVs from non-stimulated or polarised macrophages upon ATP stimulation (N=5; Kruskal-Wallis test p=0.0021 with Dunn’s multiple comparisons test). EV size Mean ± SEM: 185.3 ± 17.34 nm NS-EVs, 187.9 ± 32.88 nm IL4-EVs, 186.8 ± 23.90 nm i-EVs, 199.6 ± 40.09 nm MSC-EVs. (D) Canonical Variable scores obtained after PCA-LDA multivariate analysis of the Raman spectra obtained from macrophages and microglia. In the classification model, spectra from EVs were grouped based on the cell of origin to test Raman ability to discriminate the molecular composition of EVs from the two cell sources. The first 10 PC scores calculated by means of PCA were used for the LDA. Each dot represents a single spectrum (***p<0.001 after one way ANOVA). (E) Multivariate statistical analysis (PCA-LDA) performed on the Raman spectra of NS-EVs, IL-4-EVs, i-EVs or MSC-EVs derived from macrophages. The scatter plot represents the values obtained for the Canonical Variable 1 and Canonical Variable 2 after LDA. Each dot represents a single spectrum.
Figure 3
Figure 3
EVs derived from macrophages do not promote OPC migration and differentiation. (A) Scheme of the chemotactic assay. (B) The bar graph shows the percentage of migrated OPCs after an overnight exposure to NS-EVs, i-EVs, IL-4-EVs, or MSC-EVs from macrophages with respect to control OPCs. S1P was used as positive control. The number of migrated Hoechst+ cells was counted in 60 optical fields at 20X magnification (N=3, four replicates; One-way Anova p<0,0001 with Holm Sidak’s multiple comparisons test). (C) Representative images of MBP (red), GPR17 (green and DAPI (blue) staining in control OPCs or OPCs exposed to EVs derived from macrophages treated as in (B) (Scale bars, 50 μm). (D) Bar graphs shows quantification of MBP+ cells in control OPCs or OPCs exposed to EVs from macrophages with the four distinct phenotypes (N=4, three-fiver replicates; Kruskal-Wallis test p<0,0001 with Dunn’s multiple comparisons test). Microglia-derived i-EVs (MG i-EVs) were used as positive control. (E) Representative images of OPC-DRG co-cultures maintained in control conditions or exposed to IL4-EVs, i-EVs or MSC-EVs and stained for MBP (red) and neurofilament (NF, green) (Scale bars, 20 μm). (F) Myelination index (MBP staining/NF staining) under experimental conditions as in (E) (N=3, three replicates; Kruskal-Wallis test p=0.0069 with Dunn’s multiple comparisons test).
Figure 4
Figure 4
eCBs are present among EV lipids and drive OL differentiation. (A) Representative images of OPCs stained for MBP (red), GPR17 (green) and DAPI (blue) in non-stimulated cultures (control) or cultures exposed to the lipid fraction from EVs released by inflammatory macrophages (macrophage-EVs lipids) or microglia (microglia-EVs lipids). (B, C) Bar graphs shows quantification of MBP+ cells in control OPCs and in OPCs exposed to intact macrophage EVs (macrophage-EVs) or their lipid extract (macrophage-EVs lipids) (N=4 in two-three replicates; One-way ANOVA p=0,0002 with Holm Sidak’s multiple comparisons) (B) or to intact microglial EVs (microglia-EVs) or their lipid extract (microglia-EVs lipids) (N=5, three-four replicates; Kruskal-Wallis test p<0,0001 with Dunn’s multiple comparisons test) (C). (D) Raman spectra obtained from lipid extracts of EVs derived from inflammatory macrophages (macrophage-EVs lipids) or microglia (microglia-EVs lipids) in comparison with the spectra of lipid standard (2-AG, AEA, Sulfatide, DEA, GM1, PS and Cholesterol). Arrows show the presence of peaks common to 2-AG, AEA and GM1 in the lipid extracts. (E) 2-AG and AEA content in EVs versus donor microglia (N=3). Values are normalized on sample protein content. (F, G) Bar graphs shows quantification of MBP+ cells in control OPCs, OPCs exposed to intact microglial EVs (microglia-EVs) or their lipid extract (microglia-EVs lipids) in absence or in presence of eCB receptor antagonists SR141716A and AM630 in combination (SR+AM) or alone (SR, AM) [(F) N=3, three replicates; One-way ANOVA p<0,0001 with Holm Sidak’s multiple comparisons; (G) N=3, three replicates; One-way ANOVA p<0,0001 with Tukey’s multiple comparisons]. * = p<0.05; ** = p<0.01; *** = p<0.001 and **** = p≤0.0001. Not significant differences are indicated by ‘ns’.

References

    1. Franklin RJM, Ffrench-Constant C. Regenerating CNS myelin - from mechanisms to experimental medicines. Nat Rev Neurosci (2017) 18:753–69. doi: 10.1038/nrn.2017.136 - DOI - PubMed
    1. Nave KA, Werner HB. Myelination of the nervous system: mechanisms and functions. Annu Rev Cell Dev Biol (2014) 30:503–33. doi: 10.1146/annurev-cellbio-100913-013101 - DOI - PubMed
    1. Saab AS, Nave KA. Myelin dynamics: protecting and shaping neuronal functions. Curr Opin Neurobiol (2017) 47:104–12. doi: 10.1016/j.conb.2017.09.013 - DOI - PubMed
    1. Crawford AH, Tripathi RB, Foerster S, McKenzie I, Kougioumtzidou E, Grist M, et al. . Pre-Existing Mature Oligodendrocytes Do Not Contribute to Remyelination following Toxin-Induced Spinal Cord Demyelination. Am J Pathol (2016) 186:511–6. doi: 10.1016/j.ajpath.2015.11.005 - DOI - PMC - PubMed
    1. Klotz L, Antel J, Kuhlmann T. Inflammation in multiple sclerosis: consequences for remyelination and disease progression. Nat Rev Neurol (2023) 19:305–20. doi: 10.1038/s41582-023-00801-6 - DOI - PubMed

Publication types

Substances