. 2023:3:1185755.
doi: 10.3389/fopht.2023.1185755. Epub 2023 Jun 16.

The endothelin receptor antagonist macitentan ameliorates endothelin-mediated vasoconstriction and promotes the survival of retinal ganglion cells in rats

Affiliations

The endothelin receptor antagonist macitentan ameliorates endothelin-mediated vasoconstriction and promotes the survival of retinal ganglion cells in rats

Bindu Kodati et al. Front Ophthalmol (Lausanne). 2023.

Abstract

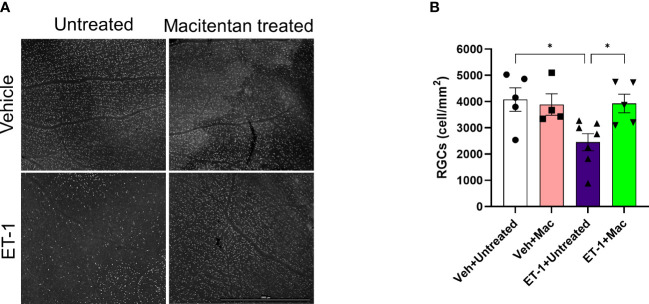
Glaucoma is a chronic and progressive eye disease, commonly associated with elevated intraocular pressure (IOP) and characterized by optic nerve degeneration, cupping of the optic disc, and loss of retinal ganglion cells (RGCs). The pathological changes in glaucoma are triggered by multiple mechanisms and both mechanical effects and vascular factors are thought to contribute to the etiology of glaucoma. Various studies have shown that endothelin-1 (ET-1), a vasoactive peptide, acting through its G protein coupled receptors, ETA and ETB, plays a pathophysiologic role in glaucoma. However, the mechanisms by which ET-1 contribute to neurodegeneration remain to be completely understood. Our laboratory and others demonstrated that macitentan (MAC), a pan endothelin receptor antagonist, has neuroprotective effects in rodent models of IOP elevation. The current study aimed to determine if oral administration of a dual endothelin antagonist, macitentan, could promote neuroprotection in an acute model of intravitreal administration of ET-1. We demonstrate that vasoconstriction following the intravitreal administration of ET-1 was attenuated by dietary administration of the ETA/ETB dual receptor antagonist, macitentan (5 mg/kg body weight) in retired breeder Brown Norway rats. ET-1 intravitreal injection produced a 40% loss of RGCs, which was significantly lower in macitentan-treated rats. We also evaluated the expression levels of glial fibrillary acidic protein (GFAP) at 24 h and 7 days post intravitreal administration of ET-1 in Brown Norway rats as well as following ET-1 treatment in cultured human optic nerve head astrocytes. We observed that at the 24 h time point the expression levels of GFAP was upregulated (indicative of glial activation) following intravitreal ET-1 administration in both retina and optic nerve head regions. However, following macitentan administration for 7 days after intravitreal ET-1 administration, we observed an upregulation of GFAP expression, compared to untreated rats injected intravitreally with ET-1 alone. Macitentan treatment in ET-1 administered rats showed protection of RGC somas but was not able to preserve axonal integrity and functionality. The endothelin receptor antagonist, macitentan, has neuroprotective effects in the retinas of Brown Norway rats acting through different mechanisms, including enhancement of RGC survival and reduction of ET-1 mediated vasoconstriction.

Keywords: endothelins; glaucoma; macitentan; neuroprotection; vasoconstriction.


Conflict of interest statement

Conflict of interest The authors declare that the research was conducted in the absence of any commercial or financial relationships that could be construed as a potential conflict of interest. The authors RK and DS declared that they were an editorial board member of Frontiers, at the time of submission. This had no impact on the peer review process and the final decision.

Figures

Figure 1
Figure 1
Hypothetical mechanisms of action of endothelin 1 (ET-1). (A) Vascular effects of ET-1. (B) Effects of ET-1 on the retinal ganglion cells. (C) Experimental scheme.
Figure 2
Figure 2
Retinal vasculature fluorescein angiography and vascular density analysis in Brown Norway rats. Rats were either treated or untreated with macitentan (endothelin receptor antagonist) for three days before intravitreal injection of ET-1. (A) The retinal vasculature was imaged with the Micron IV microscope prior to ET-1 injection (baseline) and subsequently at 5, 10 and 15 minutes. Arrowheads indicate the blood vessels which had the most prominent vasoconstriction (B) The retinal vasculature imaged with the Micron IV microscope prior to ET-1 injection and subsequently at 10 minutes. The processed images are the representative images for the Micron IV. Black color represents blood vessels, imaged prior to and post injection with ET-1 in rats that were either treated or untreated with macitentan.The field of view is equal to 3.6 mm (C, D) The vascular density and vascular density length were then measured using FIJI Vessel Analysis plugin and presented as percent of total area Mean ± SEM, n= 3-5 rats per treatment, where (*) = p ≤ 0.05, (**) = p ≤ 0.005, (***) = p ≤ 0.0005 and (****) = p < 0.0001 using two-way ANOVA (Tukey’s multiple comparisons test).
Figure 3
Figure 3
Retinal vessel diameter analysis in Brown Norway rats. Rats were either treated or untreated with macitentan for three days before intravitreal injection of ET-1. (A) The vessel diameter was then measured using FIJI Vessel Analysis plugin at two distances from the optic nerve head at eccentricity 1 (E1, B) and eccentricity 2 (E2, C) and presented as Mean of mm ± SEM. n= 3-4 rats per treatment where (#) = p<0.05, (ns) = no statistical difference for the unpaired t-test. Where (*) = p ≤ 0.05 and (**) = p ≤ 0.005 comparisons using two-way ANOVA (Tukey’s multiple comparisons test).
Figure 4
Figure 4
IOP profiles of Brown Norway rats subjected to intravitreal injection either untreated or treated with macitentan. (A) IOP measurements in each group are represented by a separate color (Vehicle injected Untreated [black], vehicle injected-macitentan treated [pink], and ET-1 injected untreated [purple], ET-1 injected Macitentan treated [green]). (B) IOP values were significantly higher at 2h time points in ET-1 injected animals compared to the vehicle injected animals. The decrease in IOP was observed in ET-1 injected rats at 4 h, 24 h and 7-day time points. Values at each time point represent mean IOP ± SEM; n=3-7 for treatment groups, where (*) = p ≤ 0.05, (***) = p ≤ 0.0005 and (****) = p < 0.0001 using two-way ANOVA (Tukey’s multiple comparisons test).
Figure 5
Figure 5
Treatment with macitentan significantly reduces ET-1 mediated RGC loss in Brown Norway rats (A) Brown Norway rats were untreated or treated with macitentan (Mac) for 3 days following which they were intravitreally injected with ET-1 or vehicle. Macitentan (or control gel) treatments were continued for additional 7 days. Rats were then sacrificed and retinal flat mounts were isolated. The panel shows representative images of retinal flat mounts immunostained with an antibody to the RGC marker Brn3a. Scale bar represents 1000 µm (B) A plot illustrating average number of Brn3a-positive RGCs per field of view (4-8 images per each retina were acquired, n=4-7 rats per group). Scale bar: 1000 μm. Bars represent mean ± SEM. * p<0.05, using two-way ANOVA multiple comparison procedures (Tukey’s Method).
Figure 6
Figure 6
Assessment of retinal ganglion cell (RGC) function in Brown Norway rats following intravitreal injection either with vehicle or ET-1. Pattern electroretinography (ERG) measurements in Vehicle untreated, Vehicle macitentan, ET-1 untreated and ET-1 macitentan-treated retired breeder Brown Norway rats were recorded at prior (Baseline) and post treatment (7 days after intravitreal injection) conditions. (A) A significant loss of pattern ERG (PERG) amplitude was observed in animals injected with the ET-1 either treated with gel or macitentan after post treatment compared to their baseline. Comparison between various groups post treatment were only indicated as shown in the analysis (B) No difference in the PERG latency between all treatment groups. (*) = p ≤ 0.05, (**) = p ≤ 0.005, (***) = p ≤ 0.0005 and (****) = p < 0.0001 indicates statistical significance using two-way ANOVA (Tukey’s multiple comparisons test), n=7-8 animals per treatment group. Bars represent mean ± SEM.
Figure 7
Figure 7
Integrity of optic nerve axons following intravitreal injection either with vehicle and ET-1 and with or without macitentan treatment. Following treatment, rats were euthanized, and optic nerve sections obtained were subjected to PPD staining to assess optic nerve degeneration. Axonal degeneration accompanied by gliosis and glial scar were observed in ET-1 injected untreated rats compared to vehicle injected rat eyes. (A) ET-1 injected macitentan-treated rats did not show any protection of their axons, compared to those of ET-1 injected untreated rats. (B) The mean counts of healthy axons were significantly reduced in ET-1 injected animals compared to vehicle injected animals. Bars represent mean ± SEM. (**p<0.005, ***p<0.0005) (Two-way ANOVA followed by Tukey’s multiple comparisons test). Scale bar: 20 μm. n=5-7 per treatment group. ns, not significant.
Figure 8
Figure 8
Expression levels of GFAP following intravitreal injections in Brown Norway rats. (A) Immunohistochemical analysis of GFAP expression in retinas and optic nerves of Brown Norway rats 24 hours following intravitreal injection of either vehicle or ET-1. Scale bar represents 100 μm (B) Quantitative PCR analysis of mRNA expression of GFAP and Fibronectin in rat primary optic nerve head astrocytes isolated from adult Sprague-Dawley rats following 24-hour treatment with either the vehicle, ET-1, macitentan or a combination of ET-1 and macitentan. The graph represents the mean ± SD of one representative experiment. The same experiment was repeated 3 times and similar trend was observed. (C) Untreated and macitentan treated rat retinal sections following intravitreal injections with either vehicle or ET-1 post 7 days of the treatment. Images were taken using the Leica DMi8 confocal microscope following immunohistochemical analysis of GFAP. Scale bar represents 75 μm. (D) Graph representing the quantification of the normalized integrated densities in the ganglion cell layer. GCL, ganglion cell layer; INL, inner nuclear layer; ONL, outer nuclear layer; DAPI indicated cell nuclei. Bars represent mean ± SEM. (*p<0.05) (Two-way ANOVA followed by Tukey’s multiple comparisons test). n=6 per treatment group.

Similar articles

Cited by

References

    1. Dhaun N, Webb DJ. Endothelins in cardiovascular biology and therapeutics. Nat Rev Cardiol (2019) 16(8):491–502. doi: 10.1038/s41569-019-0176-3 - DOI - PubMed
    1. Yanagisawa M, Inoue A, Ishikawa T, Kasuya Y, Kimura S, Kumagaye S, et al. . Primary structure, synthesis, and biological activity of rat endothelin, an endothelium-derived vasoconstrictor peptide. Proc Natl Acad Sci U S A. (1988) 85(18):6964–7. doi: 10.1073/pnas.85.18.6964 - DOI - PMC - PubMed
    1. Inoue A, Yanagisawa M, Kimura S, Kasuya Y, Miyauchi T, Goto K, et al. . The human endothelin family: three structurally and pharmacologically distinct isopeptides predicted by three separate genes. Proc Natl Acad Sci U S A. (1989) 86(8):2863–7. doi: 10.1073/pnas.86.8.2863 - DOI - PMC - PubMed
    1. Yorio T, Krishnamoorthy R, Prasanna G. Endothelin: is it a contributor to glaucoma pathophysiology? J Glaucoma (2002) 11(3):259–70. doi: 10.1097/00061198-200206000-00016 - DOI - PubMed
    1. Kallberg ME, Brooks DE, Garcia-Sanchez GA, Komaromy AM, Szabo NJ, Tian L. Endothelin 1 levels in the aqueous humor of dogs with glaucoma. J Glaucoma. (2002) 11(2):105–9. doi: 10.1097/00061198-200204000-00005 - DOI - PubMed