

Identification and validation of shared gene signature of kidney renal clear cell carcinoma and COVID-19
- PMID: 38464749
- PMCID: PMC10921934
- DOI: 10.7717/peerj.16927
Identification and validation of shared gene signature of kidney renal clear cell carcinoma and COVID-19
Abstract
Background: COVID-19 is a severe infectious disease caused by the SARS-CoV-2 virus, and previous studies have shown that patients with kidney renal clear cell carcinoma (KIRC) are more susceptible to SARS-CoV-2 infection than the general population. Nevertheless, their co-pathogenesis remains incompletely elucidated.
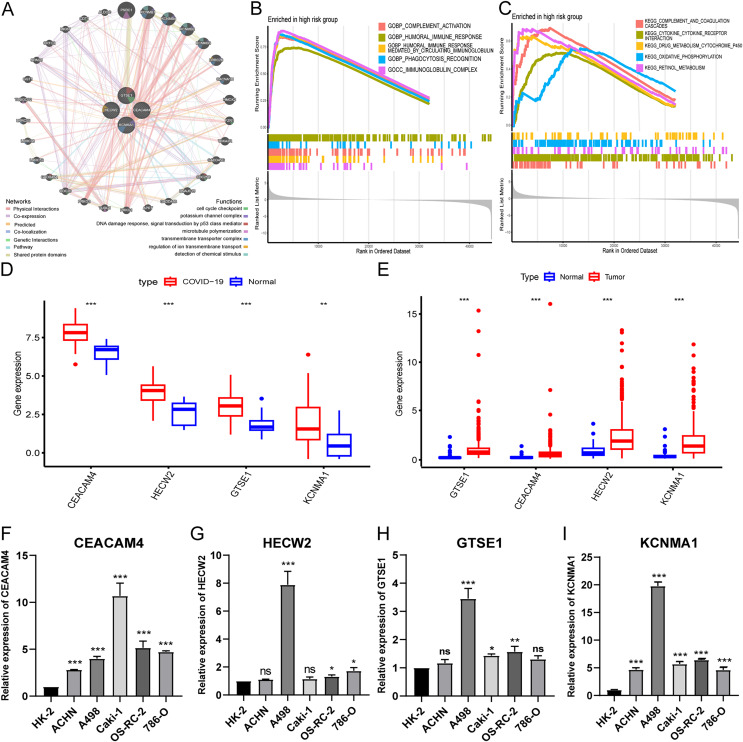
Methods: We obtained shared genes between these two diseases based on public datasets, constructed a prognostic risk model consisting of hub genes, and validated the accuracy of the model using internal and external validation sets. We further analyzed the immune landscape of the prognostic risk model, investigated the biological functions of the hub genes, and detected their expression in renal cell carcinoma cells using qPCR. Finally, we searched the candidate drugs associated with hub gene-related targets from DSigDB and CellMiner databases.
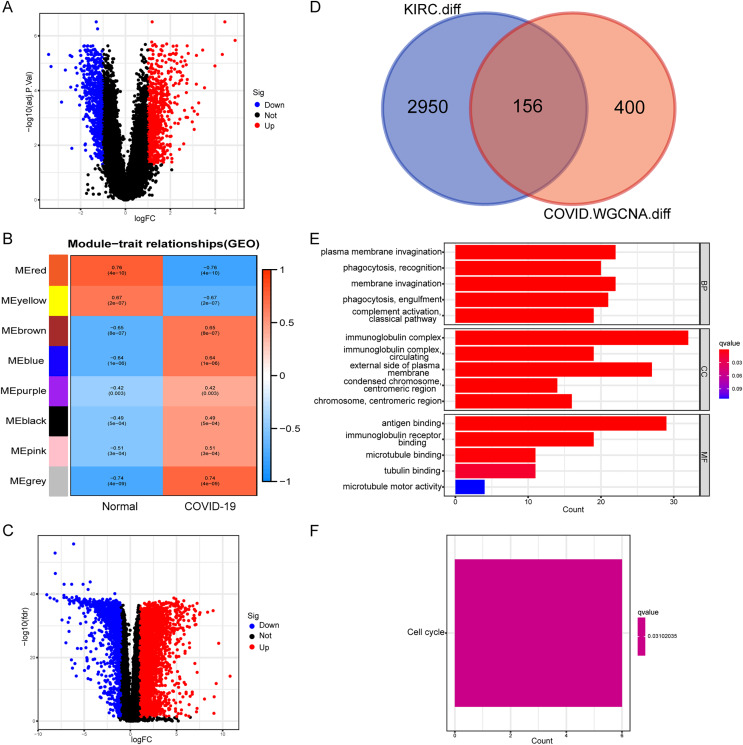
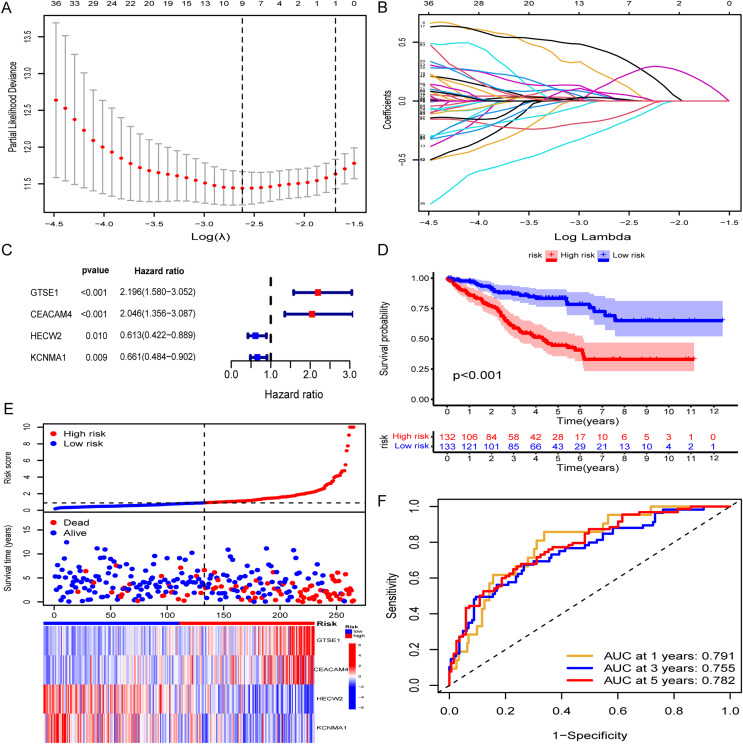
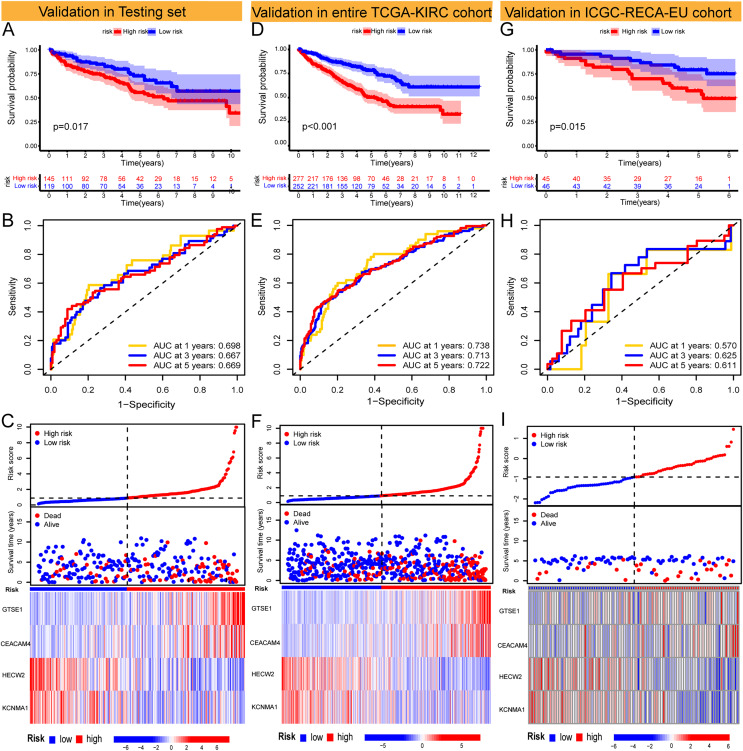
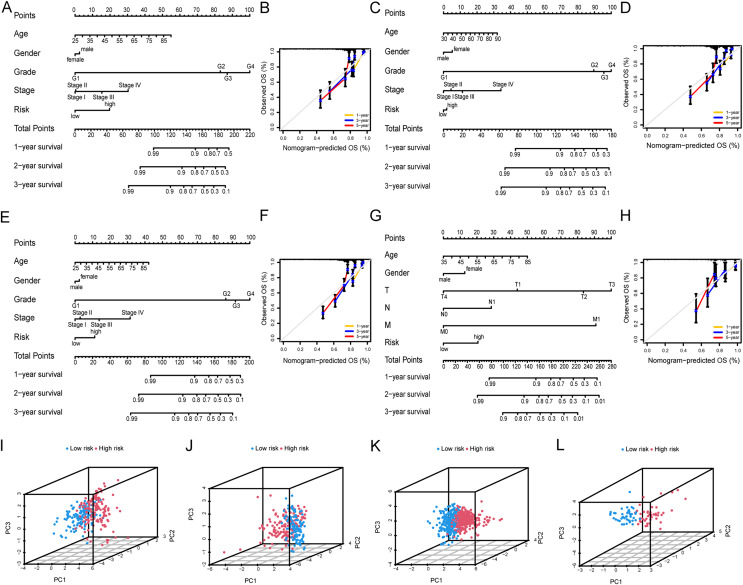
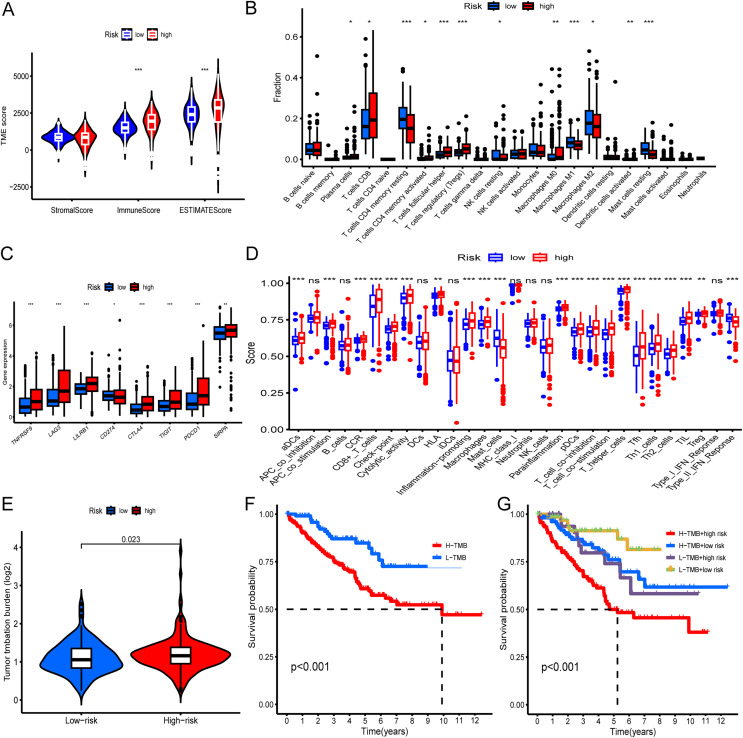
Results: We obtained 156 shared genes between KIRC and COVID-19 and constructed a prognostic risk model consisting of four hub genes. Both shared genes and hub genes were highly enriched in immune-related functions and pathways. Hub genes were significantly overexpressed in COVID-19 and KIRC. ROC curves, nomograms, etc., showed the reliability and robustness of the risk model, which was validated in both internal and external datasets. Moreover, patients in the high-risk group showed a higher proportion of immune cells, higher expression of immune checkpoint genes, and more active immune-related functions. Finally, we identified promising drugs for COVID-19 and KIRC, such as etoposide, fulvestrant, and topotecan.
Conclusion: This study identified and validated four shared genes for KIRC and COVID-19. These genes are associated with immune functions and may serve as potential prognostic biomarkers for KIRC. The shared pathways and genes may provide new insights for further mechanistic research and treatment of comorbidities.
Keywords: COVID-19; Co-pathogenesis; Comorbidity; KIRC; Shared gene.
© 2024 Nie et al.
Conflict of interest statement
The authors declare that they have no competing interests.
Figures
Similar articles
-
A Novel Prognostic Signature for Survival Prediction and Immune Implication Based on SARS-CoV-2-Related Genes in Kidney Renal Clear Cell Carcinoma.Front Bioeng Biotechnol. 2022 Jan 24;9:744659. doi: 10.3389/fbioe.2021.744659. eCollection 2021. Front Bioeng Biotechnol. 2022. PMID: 35141213 Free PMC article.
-
A novel prognostic signature of chemokines for survival and immune infiltration in kidney renal clear cell carcinoma.Int J Med Sci. 2023 Jun 19;20(8):1046-1059. doi: 10.7150/ijms.84940. eCollection 2023. Int J Med Sci. 2023. PMID: 37484803 Free PMC article.
-
Construction and validation of an autophagy-related long noncoding RNA signature for prognosis prediction in kidney renal clear cell carcinoma patients.Cancer Med. 2021 Apr;10(7):2359-2369. doi: 10.1002/cam4.3820. Epub 2021 Mar 2. Cancer Med. 2021. PMID: 33650306 Free PMC article.
-
Identification of berberine as a potential therapeutic strategy for kidney clear cell carcinoma and COVID-19 based on analysis of large-scale datasets.Front Immunol. 2023 Mar 23;14:1038651. doi: 10.3389/fimmu.2023.1038651. eCollection 2023. Front Immunol. 2023. PMID: 37033923 Free PMC article.
-
Deciphering key genes involved in cisplatin resistance in kidney renal clear cell carcinoma through a combined in silico and in vitro approach.Oncol Res. 2023 Sep 15;31(6):899-916. doi: 10.32604/or.2023.030760. eCollection 2023. Oncol Res. 2023. PMID: 37744271 Free PMC article.
References
-
- Bury M, Girault A, Mégalizzi V, Spiegl-Kreinecker S, Mathieu V, Berger W, Evidente A, Kornienko A, Gailly P, Vandier C, Kiss R. Ophiobolin a induces paraptosis-like cell death in human glioblastoma cells by decreasing BKCa channel activity. Cell Death & Disease. 2013;4(3):e561. doi: 10.1038/cddis.2013.85. - DOI - PMC - PubMed
MeSH terms
LinkOut - more resources
Full Text Sources
Medical
Miscellaneous
