. 2024 Feb 23:15:1325386.
doi: 10.3389/fendo.2024.1325386. eCollection 2024.

Ovaries of estrogen receptor 1-deficient mice show iron overload and signs of aging

Affiliations

Ovaries of estrogen receptor 1-deficient mice show iron overload and signs of aging

Sarah K Schröder et al. Front Endocrinol (Lausanne). .

Abstract

Introduction: Estrogens are crucial regulators of ovarian function, mediating their signaling through binding to estrogen receptors. The disruption of the estrogen receptor 1 (Esr1) provokes infertility associated with a hemorrhagic, cystic phenotype similar to that seen in diseased or aged ovaries. Our previous study indicated the possibility of altered iron metabolism in Esr1-deficient ovaries showing massive expression of lipocalin 2, a regulator of iron homeostasis.

Methods: Therefore, we examined the consequences of depleting Esr1 in mouse ovaries, focusing on iron metabolism. For that reason, we compared ovaries of adult Esr1-deficient animals and age-matched wild type littermates.

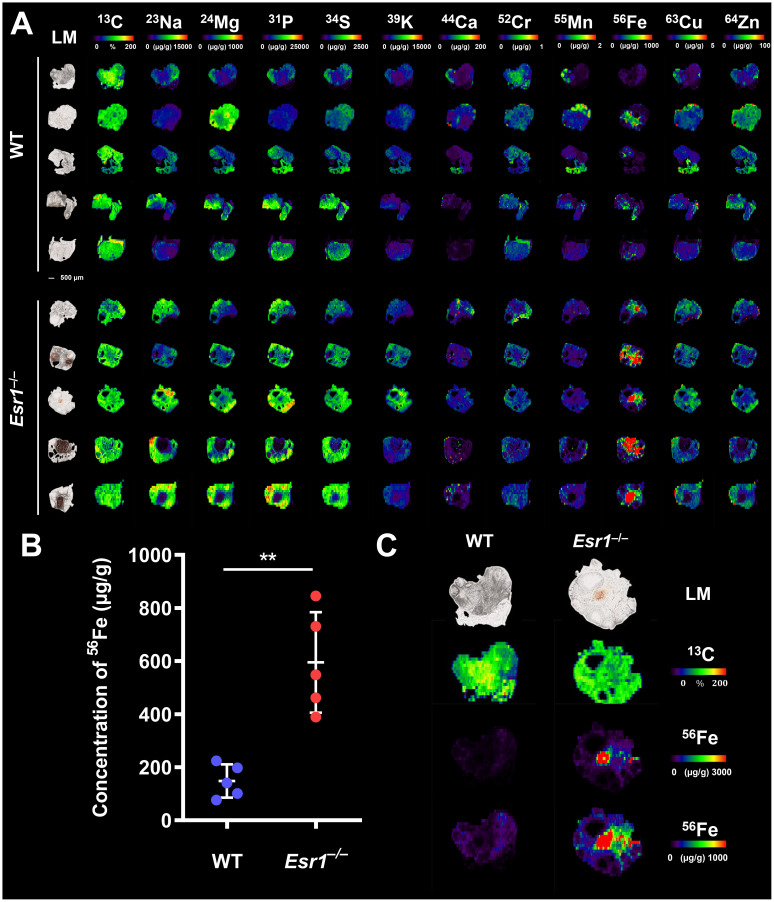
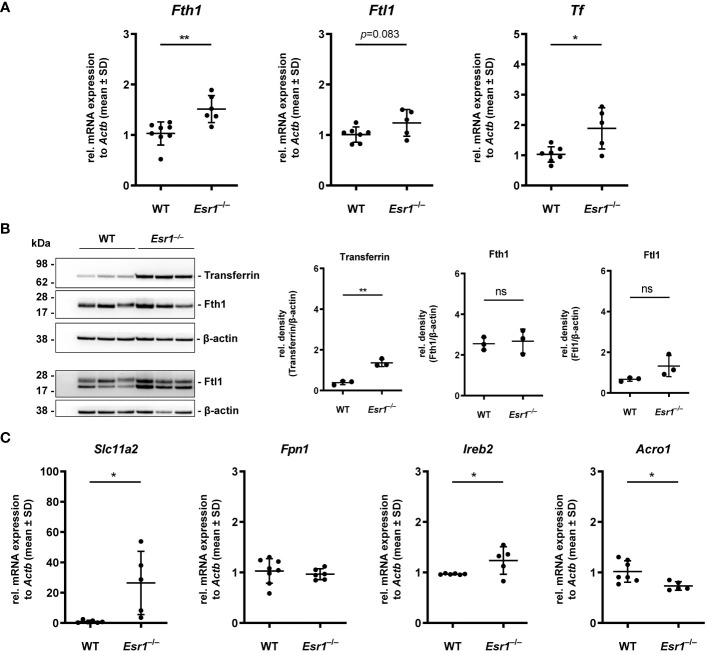
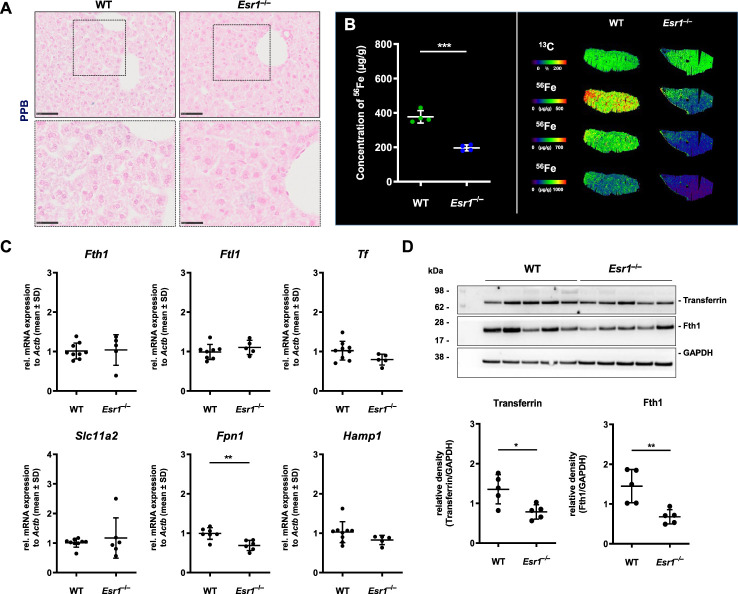
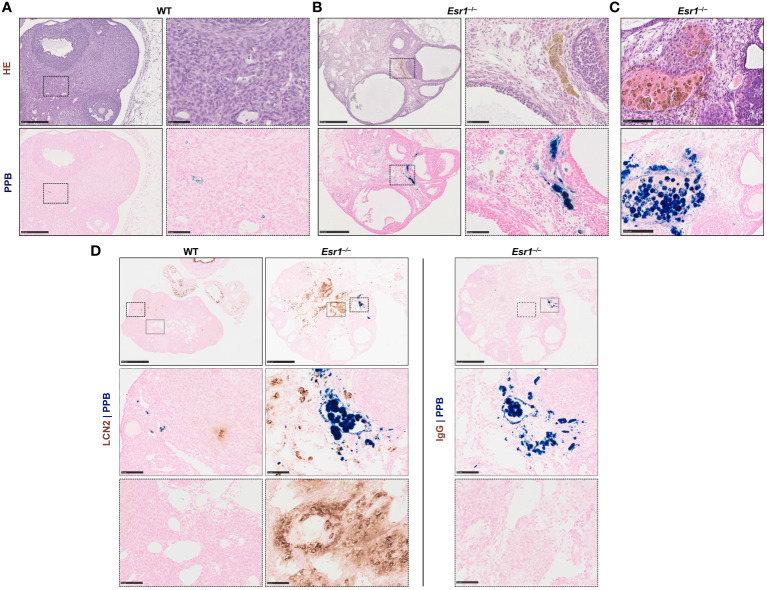
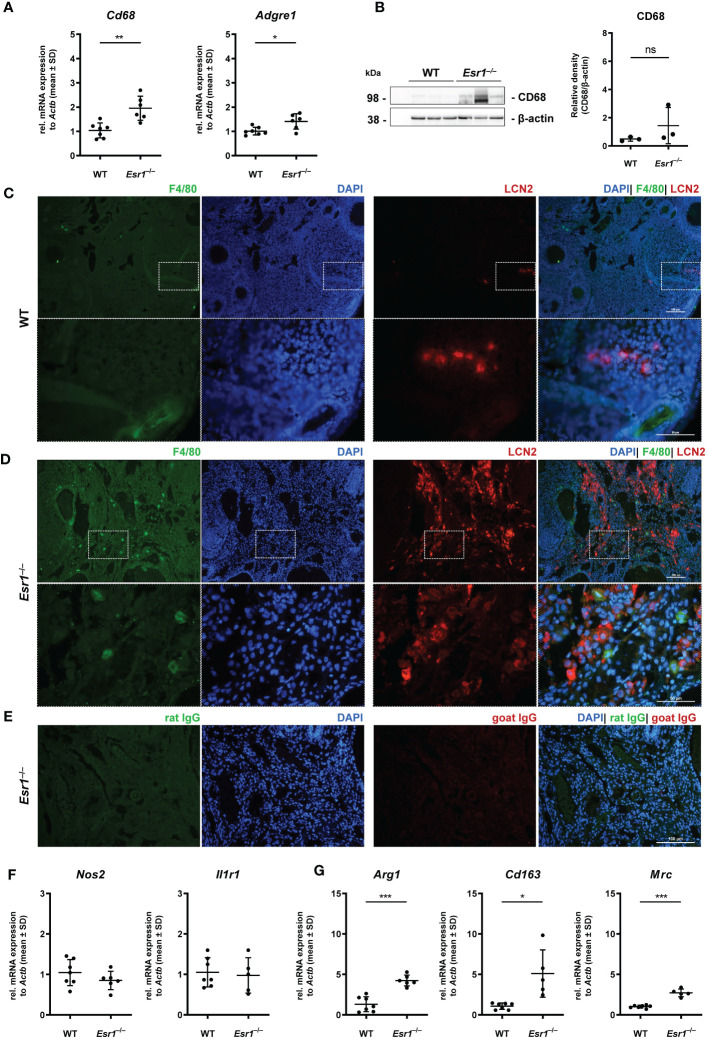
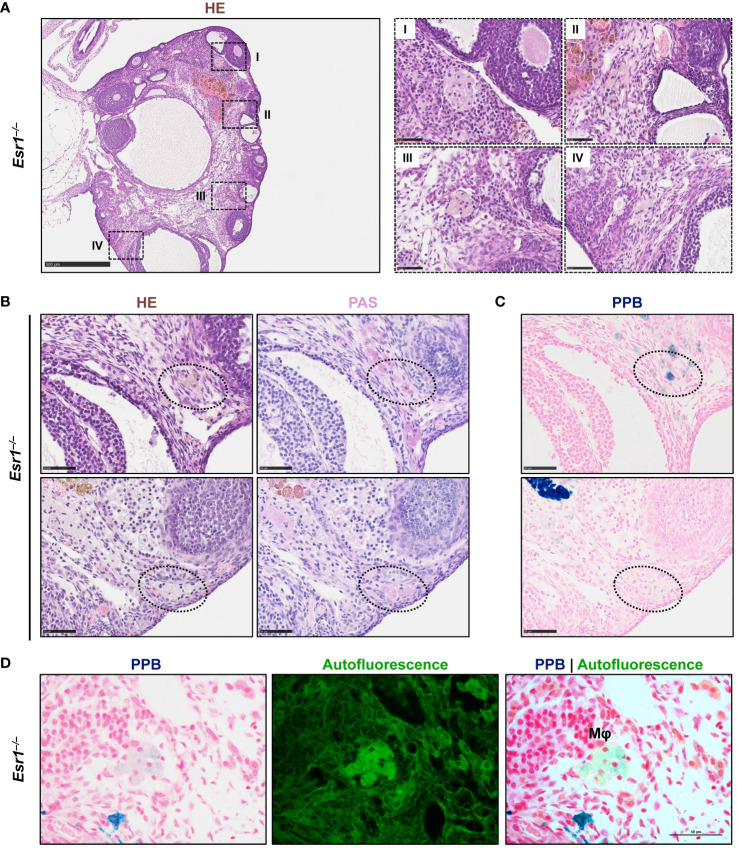
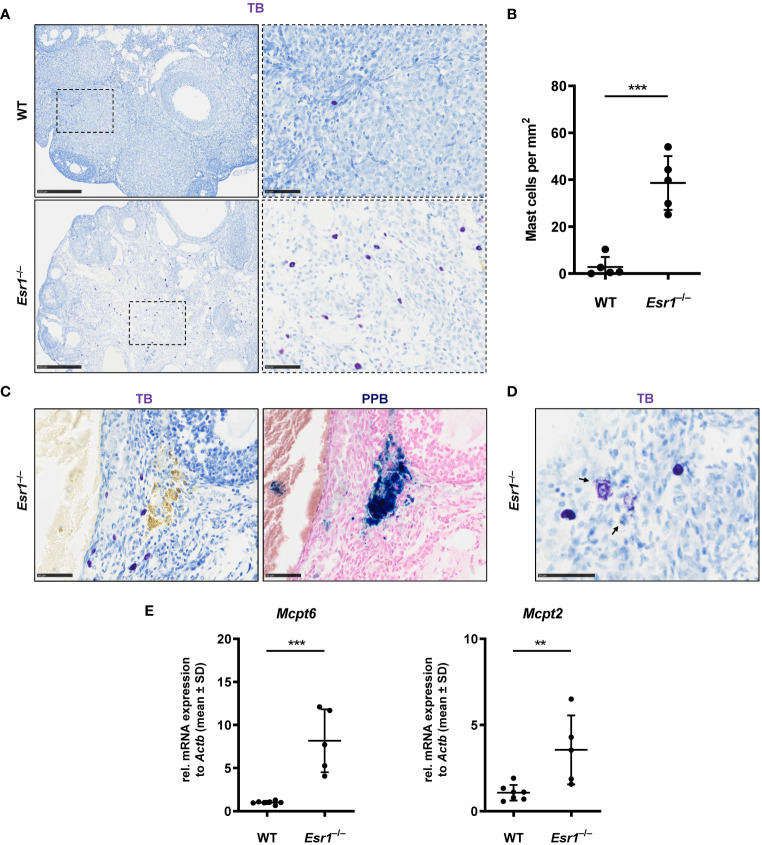
Results and discussion: We found increased iron accumulation in Esr1-deficient animals by using laser ablation inductively coupled plasma mass spectrometry. Western blot analysis and RT-qPCR confirmed that iron overload alters iron transport, storage and regulation. In addition, trivalent iron deposits in form of hemosiderin were detected in Esr1-deficient ovarian stroma. The depletion of Esr1 was further associated with an aberrant immune cell landscape characterized by the appearance of macrophage-derived multinucleated giant cells (MNGCs) and increased quantities of macrophages, particularly M2-like macrophages. Similar to reproductively aged animals, MNGCs in Esr1-deficient ovaries were characterized by iron accumulation and strong autofluorescence. Finally, deletion of Esr1 led to a significant increase in ovarian mast cells, involved in iron-mediated foam cell formation. Given that these findings are characteristics of ovarian aging, our data suggest that Esr1 deficiency triggers mechanisms similar to those associated with aging.

Keywords: ERα; Esr1; aging; estrogen receptor alpha; iron; macrophage; multinucleated giant cells; ovary.


Conflict of interest statement

The authors declare that the research was conducted in the absence of any commercial or financial relationships that could be construed as a potential conflict of interest. The author(s) declared that they were an editorial board member of Frontiers, at the time of submission. This had no impact on the peer review process and the final decision.

Figures

Figure 1
Figure 1
Laser ablation inductively coupled plasma mass spectrometry (LA-ICP-MS) imaging of wild type (WT) and Esr1-deficient ovaries. LA-ICP-MS imaging was performed on 30 µm-thick cryosections and the distribution of different isotopes was determined. Details are described in the Material and Methods section. (A) Overview of all analyzed isotopes in ovaries of WT (n=5) and Esr1-deficient (n=5) animals. Individual images were generated with the ELAI software tool. Light microscopy (LM) images of the cryosections of the individual ovaries are shown on the left side. Scale bar represents 500 µm. The content of 13C used for normalization is presented in %, while other isotope concentrations are shown in μg/g tissue. (B) The concentration of 56Fe (in µg/g) is significantly higher in Esr1-deficient ovaries compared to WT controls. For statistical analysis a Students t-test was performed. The significant difference between both groups is indicated by asterisks: **p<0.01. (C) Images of 56Fe distribution are shown at different concentration-based scales for a representative WT and Esr1-deficient ovary. The 56Fe isotope concentration-based scale was lowered from 0-3,000 µg/g to 0-1,000 µg/g to highlight 56Fe accumulation in Esr1-deficient animals.
Figure 2
Figure 2
Analysis of key players in cellular iron metabolism handling in ovarian tissue. Wild type (WT) and Esr1-deficient ovarian tissues were either used for mRNA (WT, n=7; Esr1 –/–, n=5) or protein analysis (WT, n=3; Esr1 –/–, n=3). Relative mRNA expression of Fth1, Ftl1 and Tf were measured by RT-qPCR and validated by (B) Western blot analysis. Protein expressions of Transferrin, Fth1 and Ftl1 were quantified densitometrically and plotted relative to β-actin expression. (C) mRNA expression of Slc11a2, Fpn1, Ireb2 and Aco1 were detected by RT-qPCR. All data (A-C) are displayed as mean ± SD. For statistical analysis a Students t-test was performed. Significant differences between groups are marked with asterisks: *p<0.05, **p<0.01, ns = not significant.
Figure 3
Figure 3
Analysis of cellular iron metabolism in liver tissue. Wild type (WT) and Esr1-deficient liver tissues were used for different analysis. (A) Formalin-fixated paraffin-embedded liver tissues sections (WT, n=4; Esr1 –/–, n=4) were stained for iron using Perls Prussian Blue (PPB). The scale bars equal to 50 µm (solid boarder) or 25 µm (dashed border). (B) Liver cryosections were subjected to LA-ICP-MS imaging. Concentration of elemental iron isotope (56Fe) (µg/g) is significantly lower in Esr1-deficient livers compared to WTs (left panel). 56Fe distribution is shown for both genotypes at different concentration-based scales for a representative WT and Esr1-deficient liver (left panel). (C) Regulators of cellular iron metabolism (Fth1, Ftl1, Tf, Dmt1, Fpn1, and Hamp1) were analyzed by RT-qPCR. (D) Protein expression of transferrin and Fth1 was investigated by Western blot analysis. Expression levels were quantified densitometrically and plotted relative to GAPDH expression. All data (B–D) are displayed as mean ± SD. For statistical analysis a Students t-test was done. Significant differences between groups are marked with asterisks: *p<0.05, **p<0.01, ***p<0.001.
Figure 4
Figure 4
Hemosiderin deposits in ovarian tissues. Formalin-fixated paraffin-embedded ovarian tissues section of wild type (WT, n=8) and Esr1-deficient (n=8) animals were used for staining. Serial tissue slices of WT (A) and Esr1-deficient (B) ovaries were stained with Hematoxylin-Eosin (HE) or Perls Prussian Blue (PPB) to detect iron in form of hemosiderin. Hemosiderin can be seen in HE staining as brown-gold deposits and turns blue with PPB. The scale bars equal to 250 µm (solid boarder) or 50 µm (dashed border). Hemosiderin accumulations were found in ovarian stroma of Esr1-deficient animals but not in WTs and were localized around hemorrhagic cysts (C). The scale bars equal to 100 µm. (D) Immunohistochemical localization of lipocalin 2 (LCN2) was combined with PPB staining to examine whether iron-positive cells co-localize with LCN2-positive cells. WT (n=3) and Esr1-deficient (n=4) ovaries were stained, showing no co-localization of iron and LCN2. Normal goat IgG was used as a negative control instead of the primary antibody. The scale bars equal to 500 µm (solid boarder) or 50 µm (dotted boarder and dashed border).
Figure 5
Figure 5
Macrophages in ovarian tissues. Wild type (WT) and Esr1-deficient ovarian tissues were either used for mRNA (WT, n=7; Esr1 –/–, n=5-6), protein analysis (WT, n=3; Esr1 –/–, n=3) or immunofluorescence staining (WT, n=3; Esr1 –/–, n=3). (A) Relative mRNA expression of pan-macrophage markers Cd68 and Adgre were detected by RT-qPCR. (B) Western blot analysis was used to detect CD68 protein expression, which was quantified densitometrically and plotted relative to β-actin expression. F4/80 (green) and LCN2 (red) protein expression was visualized by immunofluorescence staining with nuclear DAPI counterstaining in (C) WT and Esr1-deficient (D) ovaries. (E) Normal rat and goat IgG were used as a negative control instead of the primary antibodies. The scale bars equal to 100 µm (solid boarder) or 50 µm (dashed border). (F) Relative mRNA expression of Nos2 and Il1r1, as well as Arg1, Cd163 and Mrc (G) were determined by RT-qPCR. All data (A-B, F-G) are displayed as mean ± SD. For statistical analysis, Students t-test was done. Significant differences between groups are marked with asterisks: *p<0.05, **p<0.01, ***p<0.001, ns =not significant.
Figure 6
Figure 6
Multinucleated giant cells (MNGCs) are present in ovarian stroma of Esr1-deficient mice. Formaldehyde-fixated, paraffin-embedded serial ovarian tissue sections from Esr1-deficient mice (n=7) were used for different histological stainings. (A) Hematoxylin-Eosin (HE) staining shows pale cell clusters with a foamy appearance and multiple nuclei (I-IV) throughout the section of the Esr1-deficient ovary. (B) Cell clusters were identified as MNGCs by positive Periodic Acid-Schiff (PAS) reaction. (C) Perls Prussian Blue (PPB) staining revealed iron inclusions in the MNGCs. (D) PPB-stained MNGCs show strong autofluorescence. Scale bar equals 500 µm (solid boarder in (A)) or 50 µm (dashed boarder in (A) and in (B–D)). Mφ, macrophage.
Figure 7
Figure 7
Increased number of mast cells in Esr1-deficient ovaries. Ovaries from wild type (WT, n=5) and Esr1-deficient mice (Esr1 –/–, n=5) were dissected and formalin-fixed paraffin-embedded tissue section were prepared. Toluidine blue (TB) staining was performed on ovarian tissue sections to detect mast cells. (A) WT animals demonstrate lower number of (purple stained) mast cells in the ovary than Esr1 –/– animals. Scale bar correspond to 250 µm (solid boarder) or 50 µm (dashed boarder). (B) Evaluation of all female mice shows that Esr1 –/– animals have significantly more mast cells per mm2 in the ovary compared to WT controls. Each dot represents an individual mouse and horizontal lines indicate the mean (± SD). (C) Serial sections either stained with TB or Perls Prussian Blue (PPB) demonstrate that some mast cells in Esr1 –/– animals reside in the vicinity of iron-accumulated areas (blue precipitates). Scale bar corresponds to 50 µm. (D) Occasionally, degranulated mast cells were found in the Esr1 –/– ovary. Arrows indicate release of mast cell granules into surrounding ovarian tissue. Scale bar equals 50 µm. (E) RT-qPCR was performed to evaluate relative mRNA levels of mast cell specific markers (Mcpt6, Mcpt2). (B, D) Students t-test was used for statistical analysis. Significant differences between groups are marked with asterisks: **p<0.01,***p<0.001.

Similar articles

Cited by

References

    1. Hamilton KJ, Hewitt SC, Arao Y, Korach KS. Estrogen hormone biology. Curr Top Dev Biol (2017) 125:109–46. doi: 10.1016/bs.ctdb.2016.12.005 - DOI - PMC - PubMed
    1. Mahboobifard F, Pourgholami MH, Jorjani M, Dargahi L, Amiri M, Sadeghi S, et al. . Estrogen as a key regulator of energy homeostasis and metabolic health. BioMed Pharmacother (2022) 156:113808. doi: 10.1016/j.biopha.2022.113808 - DOI - PubMed
    1. Hewitt SC, Korach KS. Estrogen receptors: new directions in the new millennium. Endocrine Rev (2018) 39:664–75. doi: 10.1210/er.2018-00087 - DOI - PMC - PubMed
    1. Schroder SK, Tag CG, Kessel JC, Antonson P, Weiskirchen R. Immunohistochemical detection of estrogen receptor-beta (ERβ) with PPZ0506 antibody in murine tissue: from pitfalls to optimization. Biomedicines (2022) 10:3100. doi: 10.3390/biomedicines10123100 - DOI - PMC - PubMed
    1. Kuiper GG, Enmark E, Pelto-Huikko M, Nilsson S, Gustafsson JA. Cloning of a novel receptor expressed in rat prostate and ovary. Proc Natl Acad Sci U S A (1996) 93:5925–30. doi: 10.1073/pnas.93.12.5925 - DOI - PMC - PubMed

Publication types

LinkOut - more resources