. 2024 Mar 11:12:RP91218.
doi: 10.7554/eLife.91218.

A binding site for phosphoinositides described by multiscale simulations explains their modulation of voltage-gated sodium channels

Affiliations

A binding site for phosphoinositides described by multiscale simulations explains their modulation of voltage-gated sodium channels

Yiechang Lin et al. Elife. .

Abstract

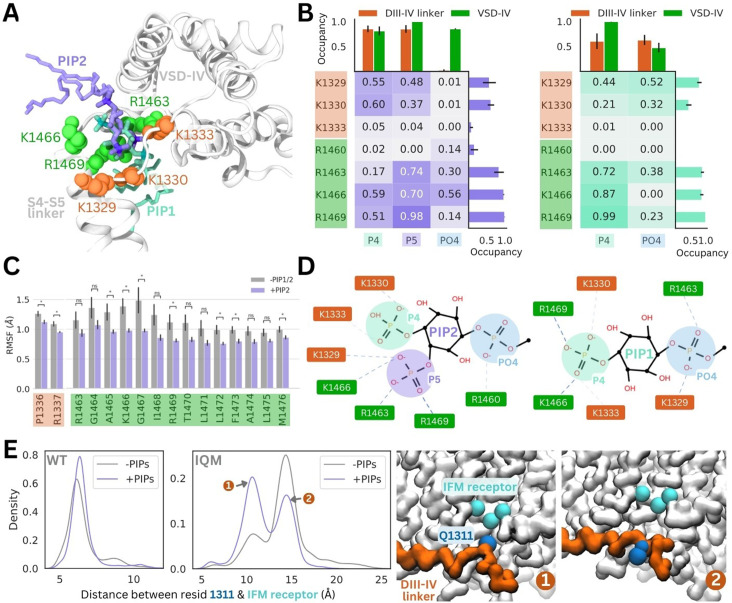
Voltage-gated sodium channels (Naᵥ) are membrane proteins which open to facilitate the inward flux of sodium ions into excitable cells. In response to stimuli, Naᵥ channels transition from the resting, closed state to an open, conductive state, before rapidly inactivating. Dysregulation of this functional cycle due to mutations causes diseases including epilepsy, pain conditions, and cardiac disorders, making Naᵥ channels a significant pharmacological target. Phosphoinositides are important lipid cofactors for ion channel function. The phosphoinositide PI(4,5)P2 decreases Naᵥ1.4 activity by increasing the difficulty of channel opening, accelerating fast inactivation and slowing recovery from fast inactivation. Using multiscale molecular dynamics simulations, we show that PI(4,5)P2 binds stably to inactivated Naᵥ at a conserved site within the DIV S4-S5 linker, which couples the voltage-sensing domain (VSD) to the pore. As the Naᵥ C-terminal domain is proposed to also bind here during recovery from inactivation, we hypothesize that PI(4,5)P2 prolongs inactivation by competitively binding to this site. In atomistic simulations, PI(4,5)P2 reduces the mobility of both the DIV S4-S5 linker and the DIII-IV linker, responsible for fast inactivation, slowing the conformational changes required for the channel to recover to the resting state. We further show that in a resting state Naᵥ model, phosphoinositides bind to VSD gating charges, which may anchor them and impede VSD activation. Our results provide a mechanism by which phosphoinositides alter the voltage dependence of activation and the rate of recovery from inactivation, an important step for the development of novel therapies to treat Naᵥ-related diseases.

Keywords: inactivation; ion channel; lipid-protein interaction; molecular biophysics; molecular dynamics; none; phosphoinositide; sodium channel; structural biology.


Conflict of interest statement

YL, ET, JC, BC No competing interests declared

Figures

Figure 1.
Figure 1.. Structure of Naᵥ and modulation by phosphoinositides.
(A) Naᵥ channel topology featuring transmembrane helices (S1–S6), the selectivity filter (SF), and the DIII–IV linker (containing the IFM motif) located between DIII and DIV. (B) Naᵥ1.4 structure (6agf) showing the four domain-swapped voltage-sensing domains (VSDs I–IV), pore, and DIII–IV linker on the intracellular side. (C) Summary of PI(4,5)P2 effects on transitions between Naᵥ channel functional states (Gada et al., 2023). (D) Structure of the PI(4,5)P2 headgroup with the 4’- and 5’-phosphates indicated.
Figure 2.
Figure 2.. Lipid fingerprint and binding of all phosphoinositide (PIP) types to Naᵥ1.4.
(A) Naᵥ1.4 embedded in a 360 Å × 360 Å model mammalian membrane containing 63 lipid species. (B) Lipid depletion enrichment index of lipids around Naᵥ1.4 grouped into 12 headgroup classes. (C) Naᵥ1.4, shown from the intracellular (left) and membrane (right) sides, colored by PIP occupancy (darker purple = greater PIP occupancy). (D) Distribution of PIP binding occupancies (left) and occupancy of lipid species at four residues with the highest PIP occupancy. Error bars show standard error, n = 3.
Figure 2—figure supplement 1.
Figure 2—figure supplement 1.. Lipid z-density maps (left) and contact occupancy structures (right) for all 12 lipid classes in the mammalian membrane.
Shows lipid species (LPC), glycosphingolipid (GM), ceramide (CER), phosphoinositide (PIP), phosphatidic acid (PA), and phosphotidylinositol (PI). Density maps for each lipid type are show on the right. Contact occupancy structures are visualized from the intracellular view, the voltage-sensing domain (VSD)-IV side view, the extracellular view and the VSD-II side view (left to right).
Figure 2—figure supplement 2.
Figure 2—figure supplement 2.. Lipid z-density maps (left) and contact occupancy structures (right) for all 12 lipid classes in the mammalian membrane.
Shows phosphatidylserine (PS), sphingomyelin (SM), phosphatidylethanolamine (PE), phosphatidylcholine (PC), cholesterol (CL), and diacylglycerol (DG). Density maps for each lipid type are show on the right. Contact occupancy structures are visualized from the intracellular view, the voltage-sensing domain (VSD)-IV side view, the extracellular view and the VSD-II side view (left to right).
Figure 2—figure supplement 3.
Figure 2—figure supplement 3.. Contact occupancy distributions (left) and outlying residues (right) for all 12 lipid classes in the mammalian membrane.
Error bars show standard error, n = 3.
Figure 3.
Figure 3.. Binding of different phosphoinositide (PIP) species in enriched PIP simulations.
(A) Enriched PIP simulation system, with Naᵥ1.4 embedded in a POPC membrane (transparent gray) and 5% each of PIP1 (blue), PIP2 (purple), and PIP3 (pink) added to the cytoplasmic leaflet. (B) Representative snapshots from the five longest binding events from different replicates, showing the three different PIP species (PIP1 in blue, PIP2 in purple, and PIP3 in pink) binding to voltage-sensing domain (VSD)-IV and the DIII–IV linker. Naᵥ1.4 is shown in white with interacting residues on the DIV S4–S5 linker and the DIII–IV linker colored in green and orange, respectively. (C) A frequency distribution showing interaction times for each PIP species, defined as the length of a continuous period in which a PIP was within 0.7 nm of two VSD-IV binding site residues. (D) Frequency plots showing number of positive residues interacting with bound PIP in the DIII–IV linker (vertical) and VSD-IV (horizontal). (E) Minimum distance between binding residues on Naᵥ1.4 and bound PIPs lipid across simulation time for the five longest binding events, colored by distance and the type of PIP bound.
Figure 3—figure supplement 1.
Figure 3—figure supplement 1.. Minimum distance between binding residues on Naᵥ1.4 and bound phosphoinositides (PIPs) lipid across 31 long duration binding events (>10 µs), colored by distance and the type of PIP bound: PIP1 (blue-green), PIP2 (purple), and PIP3 (pink).
Figure 3—figure supplement 2.
Figure 3—figure supplement 2.. Minimum distance between binding residues on Naᵥ1.4 and bound phosphoinositides (PIPs) lipid across 31 long duration binding events (>10 µs), colored by distance and the type of PIP bound: PIP1 (blue-green), PIP2 (purple), and PIP3 (pink).
Figure 3—figure supplement 3.
Figure 3—figure supplement 3.. Phosphoinositide (PIP) occupancy at putative binding site residues in WT (wild-type) (brown) and when all eight binding site residues are mutated to leucine (L8, light blue) or glutamate (E8, dark blue).
Error bars show standard error, n = 3.
Figure 4.
Figure 4.. PI(4,5)P2 and PI(4)P binding to Naᵥ1.4 stabilizes the DIII–IV linker in atomistic and flexible coarse-grained simulations.
(A) Representative snapshots of PI(4,5)P2 bound from the voltage-sensing domain (VSD)-I side (purple stick) and PI(4)P bound from the VSD-III side (cyan stick), with six basic residues forming the binding site located on the DIII–IV linker (orange VDW representation) and VSD-IV S4–S5 linker (shown in green VDW representation) visualized from the intracellular face of the protein. (B) Proportion of frames where each of the binding site residues were identified to be within 4.5 Å with the different headgroup regions, P4, P5, and PO4, for PI(4,5)P2 (left) and PI(4)P (right). Error bars show standard error, n = 5. (C) Comparison of RMSF per carbon-alpha for simulations with and without bound PI(4,5)P2, showing residues on the S4–S5 linker and DIV linker with significant differences in mobility (student’s t-test, p-value <0.05). (D) Interaction network plots between the phosphoinositide (PIP) headgroup and basic binding residues on DIII–IV linker (orange) and DIV S4–S5 linker (green), generated by ProLIF – showing the dominant interactions across simulations of PI(4,5)P2 and PI(4)P. (E) Density plots showing differences in the distributions of distance between IFM/IQM motif and its binding pocket in the presence and absence of PIPs for the Naᵥ1.4 wild-type (left) and IFM->IQM mutant (right); with representative snapshots showing the two distinct conformations of the IQM motif in the mutant.
Figure 4—figure supplement 1.
Figure 4—figure supplement 1.. Root mean square deviation (RMSD) of the Naᵥ1.4 backbone, voltage-sensing domain (VSD)-IV backbone, DIII–IV linker backbone, and S4–S5 backbone (and PI(4,5)P2/PI(4)P1 headgroup) over 1.5 µs of atomistic simulations without any phosphoinositide (PIP) (top row), with a single PI(4,5)P2 lipid bound (middle row) and with PI(4)P1 bound (bottom row).
Five replicates were simulated – rep1 (blue), rep2 (red), rep3 (green), rep4 (orange), rep5 (purple).
Figure 4—figure supplement 2.
Figure 4—figure supplement 2.. Electrostatic interactions between the PI(4,5)P2 headgroup and binding residues.
ProLIF bar charts describing the occurrence of anionic and hydrogen bond interactions between the PI(4,5)P2 headgroup and binding residues; error bars show standard error, n = 5 (top). Per replicate data, showing the number of electrostatic interactions detected between the PI(4,5)P2 headgroup and each of the binding residues (left); atomic interactions summarized in a ProLIF LigPlot (right).
Figure 4—figure supplement 3.
Figure 4—figure supplement 3.. Electrostatic interactions between the PI(4)P1 headgroup and binding residues.
ProLIF bar charts describing the occurrence of anionic and hydrogen bond interactions between the PI(4)P1 headgroup and binding residues; error bars show standard error, n = 5 (top). Per replicate data, showing the number of electrostatic interactions detected between the PI(4)P1 headgroup and each of the binding residues (left); atomic interactions summarized in a ProLIF LigPlot (right).
Figure 5.
Figure 5.. Comparison of the identified phosphoinositide binding site to Naᵥ subtypes and other ion channels.
(A) Binding poses of PI(4,5)P2 (in purple) and PI(4)P (in cyan) aligned with two other tetrameric channels structures Kᵥ7.1 (6v01, in yellow) and Caᵥ2.2 (7mix, in red) that were resolved with PI(4,5)P2 at their respective voltage-sensing domains (VSDs). (B) Sequence alignment of the S4 helix and S4–S5 linker of the four domains of Naᵥ1.4, compared to VSD-II of Caᵥ2.2 and one of the four identical VSDs of Kᵥ7.1; residues colored by amino acid class; purple boxes indicate PI(4,5)P2 binding residues (identified with 5 Å of the headgroup). (C) Sequence alignment of the nine human Naᵥ channel subtypes shows high sequence similarity in the S4 helix, S4–S5 linker, and DIII–IV linker regions.
Figure 6.
Figure 6.. Phosphoinositide (PIP) binding to Naᵥ1.7 with different voltage-sensing domain (VSD) states in coarse-grained simulations.
(A) Atomistic representation of the three different Naᵥ1.7 structures simulated: (1) the inactivated state (blue, PDB ID: 6j8g) with the VSDs all in the activated, up state, (2) the Naᵥ1.7-NaᵥPas chimera (pink, PDB ID: 6nt4) with the Naᵥ1.7 VSD-IV in the deactivated, down state and a bound NaᵥPas C-terminal domain (CTD), (3) a Naᵥ1.7 resting state model (orange, model generation detailed in Materials and methods) with all four VSDs in the deactivated, down state. Panel insets show the different conformations of VSD-IV (left) and VSD-II (right) across different structures. The inactivation switch formed by the CTD and VSD-IV S4–S5 linker proposed by Clairfeuille et al. is shown (middle). (B) Combined occupancy of all PIP species (PIP1, PIP2, PIP3) at binding site residues in the three systems; error bars show standard error, n = 3. (C) Distribution of PIP binding durations at the identified site. (D) Intracellular view of CTD covering the resting state VSD-IV. Representative snapshot of PIP binding at DIV S4–S5 linker in the Naᵥ1.7-NaᵥPas system. The CTD (dark pink) prevents PIP access to DIII–IV linker lysines, K1492 and K1495. (E) Combined PIP occupancy at the bottom three gating charges on VSD I–III in the inactivated (blue) and resting state model (orange) simulations. For VSD-IV, PIP occupancy in the Naᵥ1.7-NaᵥPas system (pink) is also shown. (F) Representative simulation snapshot showing PIP (purple) binding at the gating charges (orange) in the resting state model simulations.
Figure 6—figure supplement 1.
Figure 6—figure supplement 1.. Naᵥ1.7 resting state model validation.
Each of the four voltage-sensing domains (VSDs) aligned separately, comparing the inactivated structure (6j8g, in blue) to the resting state model. All the S4 gating charges and the PHE/TYR residue on S2 to indicate the hydrophobic constriction site (HCS) for each VSD (in stick representation). The templates that each corresponding VSD was modeled from are shown in translucent representation. S3 helix hidden for better visualization of gating charge positions.
Figure 6—figure supplement 2.
Figure 6—figure supplement 2.. Minimum distance between binding residues on Naᵥ1.7 and bound phosphoinositides (PIPs) shown for long duration binding events (>20 µs) in each system, colored by distance and the type of PIP bound: PIP1 (blue-green), PIP2 (purple), and PIP3 (pink).
Five long-term binding events for the inactivated structure of Naᵥ1.7 (PDB ID: 6j8g) are shown on the left. Naᵥ1.7-NaᵥPas chimera (top right, PDB ID: 6nt4) and Naᵥ1.7 resting state model (bottom right) have fewer longer term interactions with PIP at this site. These interactions do not involve residues belonging to the DIII–IV linker (K1147/1492 and K1150/1495).
Figure 6—figure supplement 3.
Figure 6—figure supplement 3.. Phosphoinositide (PIP) binding at S4 gating charges.
(A) Binding duration distributions for PIP binding events at residues belonging to the bottom three gating charges in the S4 helix of voltage-sensing domain (VSD) I–III are shown for the inactivated structure of Naᵥ1.7 (PDB ID: 6j8g, all VSDs up) and resting Naᵥ1.7 model (all VSDs down, C-terminal domain [CTD] not modeled). For VSD-IV, the distribution for the Naᵥ1.7-NaᵥPas chimera (VSD-IV down, CTD bound) is also shown. (B) Minimum distance between terminal three gating charges on each VSD and bound PIP for long duration (>20 µs) binding events shown for the resting Naᵥ1.7 model (top) and inactivated Naᵥ1.7 structure (bottom). (C) Combined PIP occupancy at the bottom three gating charges on VSD I–IV in the inactivated (blue) and resting state model (orange) simulations of a Naᵥ1.4 resting state model; error bars show standard error, n = 3.
Figure 7.
Figure 7.. Proposed mechanism of phosphoinositide (PIP) effects on the sodium channel functional cycle.

Update of

  • doi: 10.1101/2023.07.16.547149
  • doi: 10.7554/eLife.91218.1
  • doi: 10.7554/eLife.91218.2

Similar articles

Cited by

References

    1. Amsalem M, Poilbout C, Ferracci G, Delmas P, Padilla F. Membrane cholesterol depletion as a trigger of Nav1.9 channel-mediated inflammatory pain. The EMBO Journal. 2018;37:e97349. doi: 10.15252/embj.201797349. - DOI - PMC - PubMed
    1. Åqvist J, Wennerström P, Nervall M, Bjelic S, Brandsdal BO. Molecular dynamics simulations of water and biomolecules with a Monte Carlo constant pressure algorithm. Chemical Physics Letters. 2004;384:288–294. doi: 10.1016/j.cplett.2003.12.039. - DOI
    1. Bauer P, Hess B, Lindahl E. GROMACS 2022.5 manual (2022.5) 2022.5Gromacs. 2023 https://manual.gromacs.org/2022.5/index.html
    1. Bezanilla F, Armstrong CM. Inactivation of the sodium channel. I. Sodium current experiments. The Journal of General Physiology. 1977;70:549–566. doi: 10.1085/jgp.70.5.549. - DOI - PMC - PubMed
    1. Boiteux C, Vorobyov I, Allen TW. Ion conduction and conformational flexibility of a bacterial voltage-gated sodium channel. PNAS. 2014;111:3454–3459. doi: 10.1073/pnas.1320907111. - DOI - PMC - PubMed