The Dynamics of Locomotor Neuromuscular Fatigue during Ramp-Incremental Cycling to Intolerance
- PMID: 38465870
- PMCID: PMC11878584
- DOI: 10.1249/MSS.0000000000003414
The Dynamics of Locomotor Neuromuscular Fatigue during Ramp-Incremental Cycling to Intolerance
Abstract
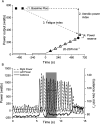
Introduction: Traditional neuromuscular fatigue assessments are not task-specific and are unable to characterize neuromuscular performance decline during dynamic whole-body exercise. This study used interleaved maximal isokinetic cycling efforts to characterize the dynamics of the decline in neuromuscular performance during ramp-incremental (RI) cycle ergometry exercise to intolerance.
Methods: Eleven young healthy participants (10 male/1 female) performed two RI cycle ergometry exercise tests to intolerance: 1) RI exercise with peak isokinetic power (Piso) at 80 rpm measured at baseline and immediately at intolerance from a maximal ~6 s effort, and 2) RI exercise where additional Piso measurements were interleaved every 90 s to characterize the decline in neuromuscular performance during the RI test. Muscle excitation was measured using EMG during all Piso assessments, and pulmonary gas exchange was measured throughout.
Results: Baseline Piso was 832 ± 140 W and RI exercise reduced Piso to 349 ± 96 W at intolerance ( P = 0.001), which was not different from flywheel power at intolerance (303 ± 96 W; P = 0.292). There was no reduction in Piso between baseline cycling and gas exchange threshold (GET; baseline Piso vs mean Piso below GET: 828 ± 146 vs 815 ± 149 W; P = 1.00). Piso fell progressively above GET until intolerance (Piso every 90 s above GET: 759 ± 139, 684 ± 141, 535 ± 144, 374 ± 117 W; each P < 0.05 vs baseline and mean Piso below GET). Peak muscle excitation (EMG) was also reduced only above GET (73% ± 14% of baseline, at intolerance; P < 0.05). However, the reduction in peak Piso preceded the reduction in peak muscle excitation.
Conclusions: The dynamics of the decline in neuromuscular performance (reduction in Piso and EMG) during RI exercise are consistent with known intensity-dependent metabolic and traditional pre-post neuromuscular fatigue responses to discrete bouts of constant-power exercise.
Copyright © 2025 The Author(s). Published by Wolters Kluwer Health, Inc. on behalf of the American College of Sports Medicine.
Figures


Similar articles
-
Power Reserve at Intolerance in Ramp-Incremental Exercise Is Dependent on Incrementation Rate.Med Sci Sports Exerc. 2021 Aug 1;53(8):1606-1614. doi: 10.1249/MSS.0000000000002645. Med Sci Sports Exerc. 2021. PMID: 34261991
-
Instantaneous quantification of skeletal muscle activation, power production, and fatigue during cycle ergometry.J Appl Physiol (1985). 2015 Mar 1;118(5):646-54. doi: 10.1152/japplphysiol.00948.2014. Epub 2014 Dec 24. J Appl Physiol (1985). 2015. PMID: 25539940
-
No reserve in isokinetic cycling power at intolerance during ramp incremental exercise in endurance-trained men.J Appl Physiol (1985). 2016 Jan 1;120(1):70-7. doi: 10.1152/japplphysiol.00662.2015. Epub 2015 Nov 12. J Appl Physiol (1985). 2016. PMID: 26565019
-
Dynamics of Locomotor Fatigue during Supra-critical Power Exercise.Med Sci Sports Exerc. 2019 Aug;51(8):1720-1726. doi: 10.1249/MSS.0000000000001965. Med Sci Sports Exerc. 2019. PMID: 30817712
-
Skeletal muscle fatigue and decreased efficiency: two sides of the same coin?Exerc Sport Sci Rev. 2015 Apr;43(2):75-83. doi: 10.1249/JES.0000000000000043. Exerc Sport Sci Rev. 2015. PMID: 25688762 Review.
References
-
- Iannetta D, Zhang J, Murias JM, Aboodarda SJ. Neuromuscular and perceptual mechanisms of fatigue accompanying task failure in response to moderate-, heavy-, severe-, and extreme-intensity cycling. J Appl Physiol (1985). 2022;133(2):323–34. - PubMed
-
- Brownstein CG, Pastor FS, Mira J, Murias JM, Millet GY. Power output manipulation from below to above the gas exchange threshold results in exacerbated performance fatigability. Med Sci Sports Exerc. 2022;54(11):1947–60. - PubMed

