Meta-Analysis
. 2024 Jun 7;75(11):3557-3578.
doi: 10.1093/jxb/erae106.

Plant ammonium sensitivity is associated with external pH adaptation, repertoire of nitrogen transporters, and nitrogen requirement

Affiliations
Meta-Analysis

Plant ammonium sensitivity is associated with external pH adaptation, repertoire of nitrogen transporters, and nitrogen requirement

Mikel Rivero-Marcos et al. J Exp Bot. .

Abstract

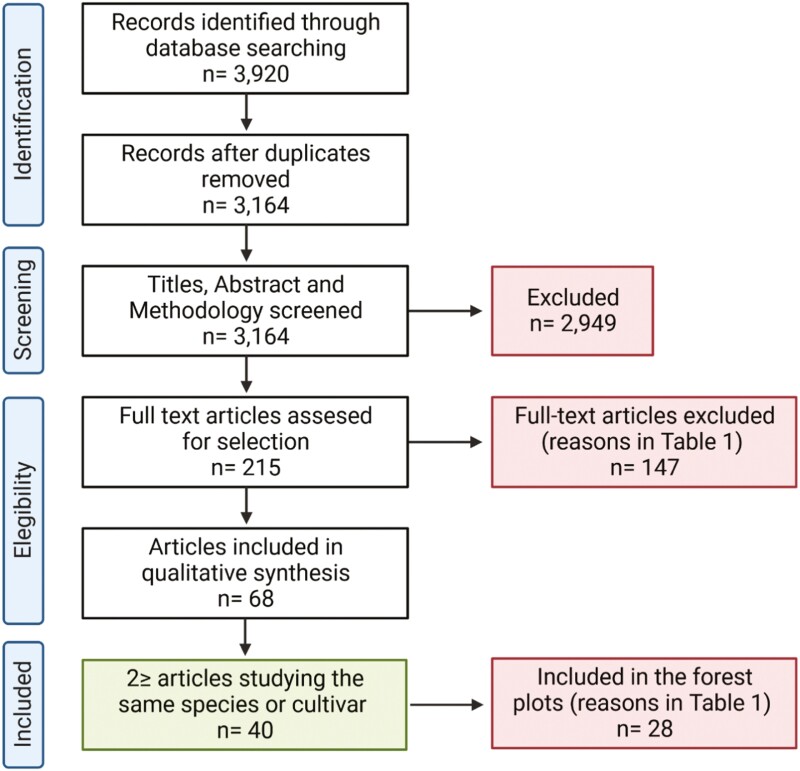
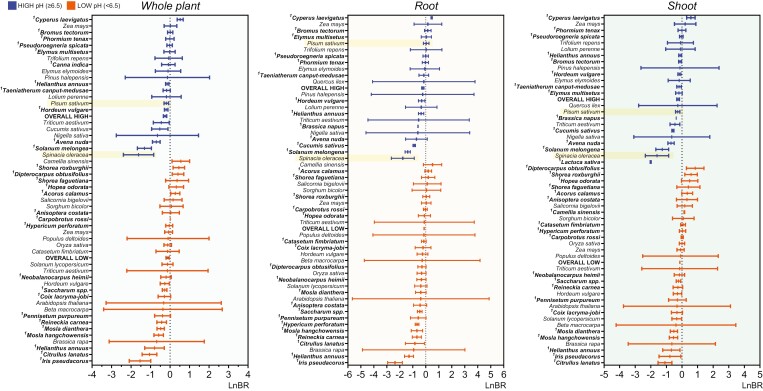
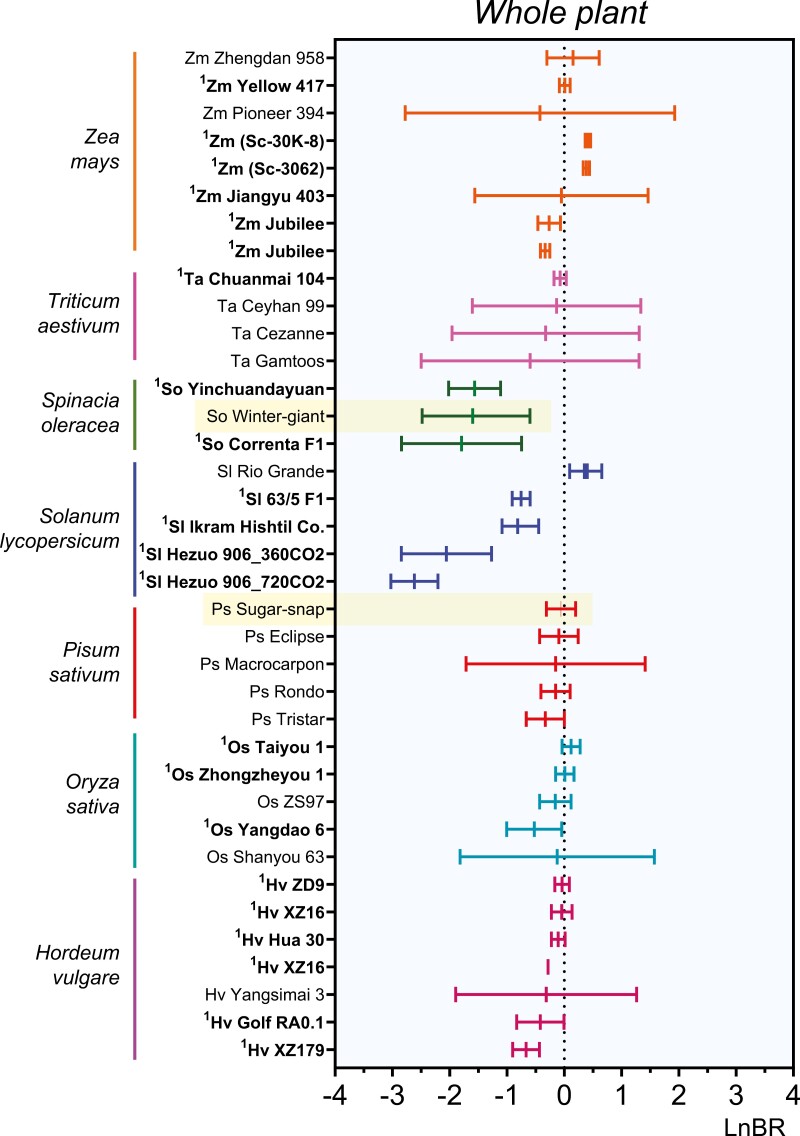
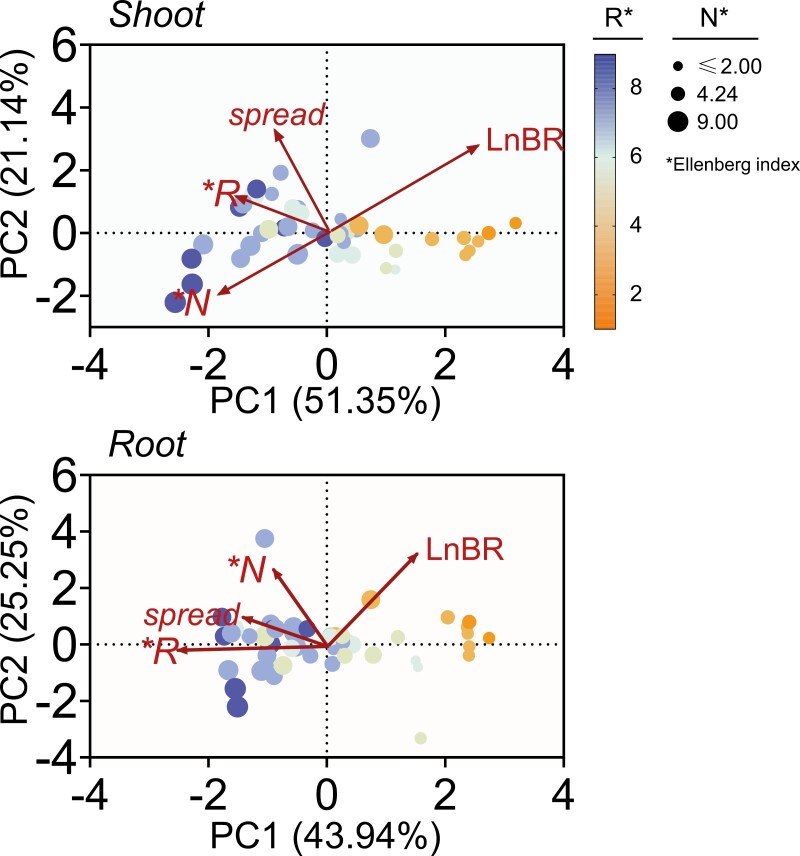
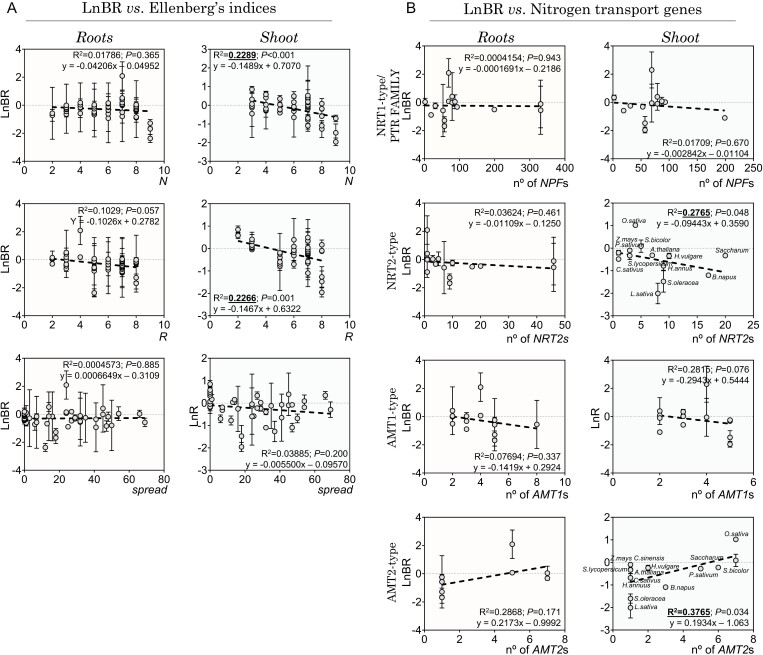
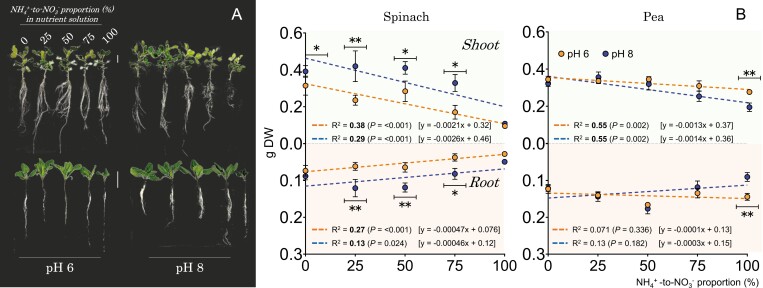
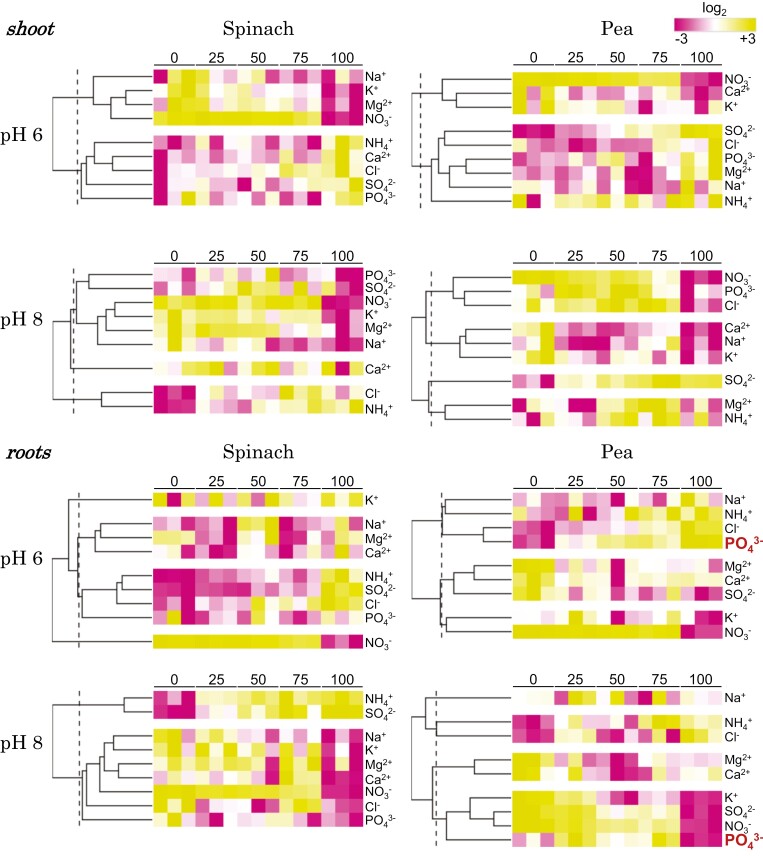
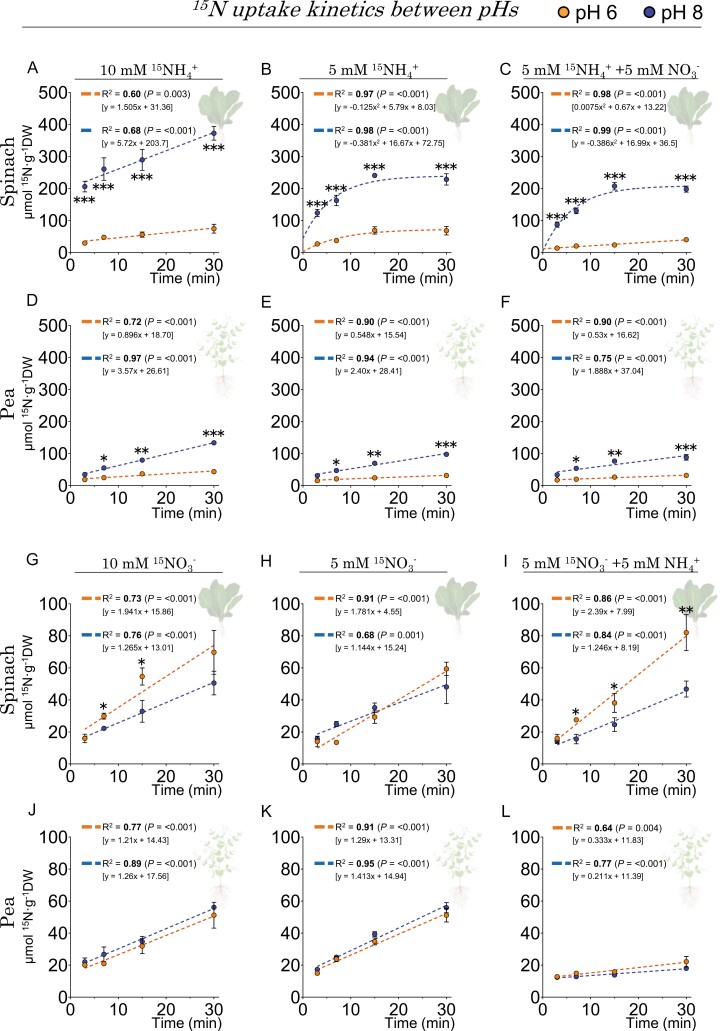
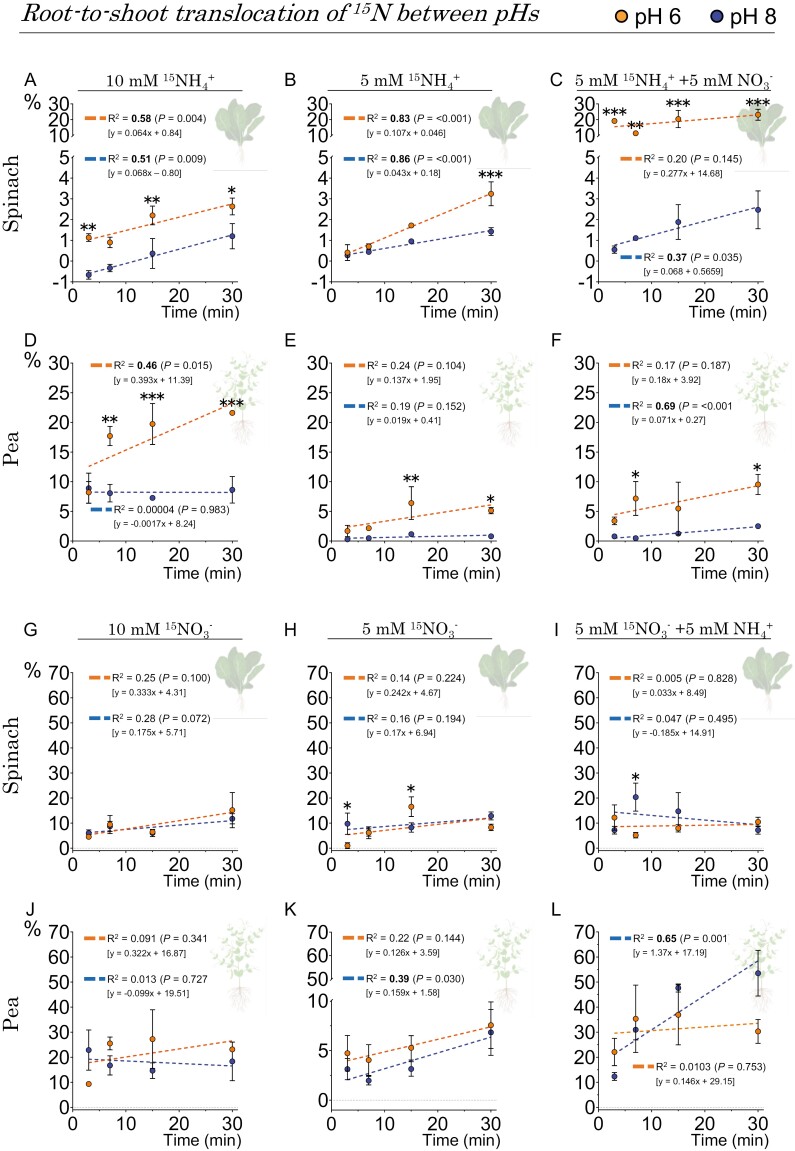
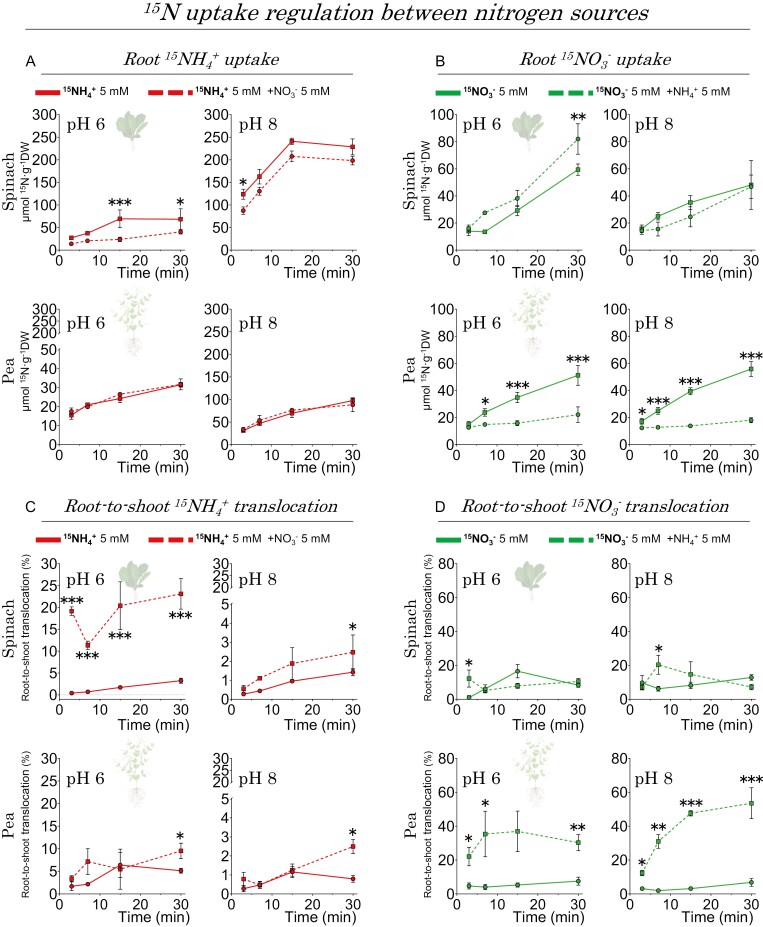
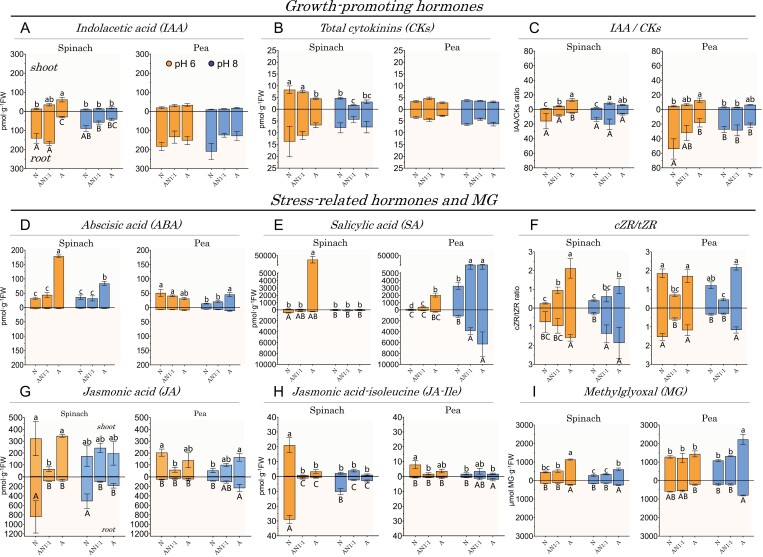
Modern crops exhibit diverse sensitivities to ammonium as the primary nitrogen source, influenced by environmental factors such as external pH and nutrient availability. Despite its significance, there is currently no systematic classification of plant species based on their ammonium sensitivity. We conducted a meta-analysis of 50 plant species and present a new classification method based on the comparison of fresh biomass obtained under ammonium and nitrate nutrition. The classification uses the natural logarithm of the biomass ratio as the size effect indicator of ammonium sensitivity. This numerical parameter is associated with critical factors for nitrogen demand and form preference, such as Ellenberg indicators and the repertoire of nitrogen transporters for ammonium and nitrate uptake. Finally, a comparative analysis of the developmental and metabolic responses, including hormonal balance, is conducted in two species with divergent ammonium sensitivity values in the classification. Results indicate that nitrate has a key role in counteracting ammonium toxicity in species with a higher abundance of genes encoding NRT2-type proteins and fewer of those encoding the AMT2-type proteins. Additionally, the study demonstrates the reliability of the phytohormone balance and methylglyoxal content as indicators for anticipating ammonium toxicity.

Keywords: Ammonium sensitivity; Ellenberg indicator; ammonium transporters (AMTs); high-affinity nitrate transporter (NRT2); methylglyoxal; nitrogen uptake; pH adaptation; phytohormonal balance.


Conflict of interest statement

The authors declare no conflict of interest.

Figures

Fig. 1.
Fig. 1.
Workflow performed for the selection of the number of studies to be retained and discarded at each stage of the systematic literature review.
Fig. 2.
Fig. 2.
Plants’ sensitivity to ammonium can be assessed using a biomass-based indicator. Forest plots graphs depict the standardized mean effect sizes and 95% confidence intervals of sole ammonium source versus nitrate (LnBR) under high or low empirical pH (represented by symbol color) on dry weight biomass of the whole plant (A), root (B), and shoot (C) in the 50 examined plant species. An effect size of zero is indicated by a dotted line. The LnBR shows different responses in spinach and pea (highlighted in yellow). The pooled effect sizes of LnBR for the low and high pH conditions of the hydroponic nutrient solutions used in the studies are represented by OVERALL LOW and HIGH, respectively. Species in bold with superscripts were manually included in the forest plots; however, due to a shortage of studies, they were not included in the meta-analysis. See Supplementary Table S1 for reference information on the selected studies.
Fig. 3.
Fig. 3.
Meta-analysis of the biomass-based indicator shows intraspecific variability in the response of cultivated plant species to ammonium nutrition. The effect size in biomass production of ammonium nutrition relative to nitrate, depicted in a forest plot graph. LnBR shows the different degree of ammonium sensitivity of plant cultivars within some relevant crops included in the meta-analysis. All data are standardized mean effect sizes and the 95% confidence interval. The dotted line illustrates an effect size of zero. The specific spinach and pea cultivars used in the subsequent analytical comparison are highlighted in yellow. The forest plot included certain varieties, shown in bold with superscript, which were manually added, because they were present in only one study (and thus excluded from the meta-analysis) Supplementary Table S1 contains references of selected studies for each species.
Fig. 4.
Fig. 4.
Nitrophily is the most influential ecological trait in defining the first component of the PCA. This attribute accounts for around half of the variation in data for plants’ LnBR values. Specifically, in the shoot and roots, this first component explains 51% and 44% of the variation, respectively, while the second component accounts for 21% and 25%. The soil pH (‘R’) is displayed through a color scale, while the plot size indicates fertility and nitrogen (‘N’) preferences based on the Ellenberg index.
Fig. 5.
Fig. 5.
LnBR values correlate with soil pH, nitrophily, and the number of genes coding for NRT2- and AMT2-type transporters. There is a significant correlation between the ammonium sensitivity indicator (LnBR) and some Ellenberg’s indices (A), as well as the number of nitrogen transporter genes present in the plant species examined (B). The presented data show the mean LnBR ±SD adjusted to linear correlation (R2 and P). The statistically significant correlation between LnR values and the number of NRT2- and AMT2-type genes is highlighted in bold. N indicates nitrophility/soil fertility and R indicates soil pH according to the Ellenberg indices. Additionally, the number of countries where the species can be invasive is reported as ‘spread’.
Fig. 6.
Fig. 6.
Nitrate in co-provision with ammonium promotes growth in both spinach, which shows a boost at pH 8, and pea, which is unaffected by pH levels. (A) The phenotype of hydroponically cultivated spinach and pea plants, with white vertical lines indicating a scale of 5 cm. (B) The connection between biomass of the shoot and root, the proportion of ammonium to nitrate, and pH levels. As the proportion of ammonium to nitrate in the nutrient solution increases, biomass decreases. The trend is quantified by R2 and is represented by the dashed lines. Statistical significance is shown in bold, with a significance level of P≤0.05. Asterisks indicate significant differences in pH as determined by Student t-test. *0.05>P>0.01, **0.01>P>0.001. Spinach and pea plants were grown for 3 weeks and 2 weeks, respectively, and were exposed to varying proportions of ammonium and nitrate, ranging from sole nitrate to sole ammonium continuously. The total nitrogen level was 5 mM for spinach and 10 mM for pea plants.
Fig. 7.
Fig. 7.
Mineral nutrition status was analyzed through a heatmap, utilizing Z-score values of average log2 soluble ions in replicates from both the shoot and root of spinach and pea plants at pH 6 and 8. The rows of the heatmap represent ions, and the columns display the percentage ratio of ammonium to nitrate (with 0 indicating only nitrate and 100 indicating only ammonium). Ions with significantly lower levels are highlighted in purple, while those with significantly higher levels are shown in yellow. The brightness of each color corresponds to the magnitude of the difference when compared with the average value. Individual samples and ions are separated using hierarchical clustering utilizing Ward’s algorithm. The dendrogram is scaled to represent the distance between each branch through a distance measure of Euclidean distance. Highlighted in red are the greatest differences found between pHs, which were the high and low phosphate contents in pea roots at pH 6 and 8, respectively. This visualization was produced utilizing the publicly available Morpheus software (Broad Institute). A total of 5 mM nitrogen was applied for spinach and 10 mM for pea plants.
Fig. 8.
Fig. 8.
Mutual modulation of nitrate and ammonium uptake occurred in spinach and pea plants when both nitrogen sources were co-supplied, with dependence on pH. 15N influx was recorded following a 30 min incubation of 15N-labeled concentrations of NH4+ (A–F) or NO3 (G–L) at levels of 5 mM and 10 mM, at pH 6 and 8. Data represent the means ±SE (n=3–5). The dashed lines indicate the trend in the 15N content during incubation, measured by R2, with statistical significance indicated in bold (P≤0.05). Asterisks represent differences between pHs at each time point (Student t-test). *0.05>P>0.01, **0.01>P>0.001; ***<0.001. The direct comparison of 15N influx between species is shown in Supplementary Fig. S8.
Fig. 9.
Fig. 9.
The translocation of nitrate and ammonium from the roots to the shoots in spinach and pea plants is influenced by their co-provision and pH levels. The percentage of translocated 15N-labeled NH4+ (A–F) or 15N-labeled NO3 (G–L) in the shoots was measured after a 30 min incubation at concentrations of 5 mM and 10 mM and pH values of 6 and 8. Data represent the means ±SE (n=3–5). The dashed lines indicate the trend in the 15N content in the shoot with respect to the total 15N in the plant over the incubation period. R2 quantifies this trend, and its statistical significance is indicated in bold (P≤0.05). pH differences at each time point are denoted by asterisks based on the Student t-test. Significance levels are indicated by *0.05>P>0.01, **0.01>P>0.001, and ***<0.001. The direct contrast of 15N translocation between species is available in Supplementary Fig. S9.
Fig. 10.
Fig. 10.
Differential transport patterns of inorganic nitrogen forms in spinach and pea, under co-provision of both nitrogen sources. The study measured 5 mM 15N-labeled NH4+ influx (A) and its root to shoot translocation (C), with and without 5 mM nitrate; and 5 mM 15N-labeled NO3 influx (B) and its root to shoot translocation (D), with and without 5 mM ammonium. The data represent the means ±SE (n=3–5). The dashed lines indicate the trend in 15N content in plants (A and B) or percentage of translocated labeled N (C and D) over the incubation period. These trends were quantified by R2, and statistical significance is denoted in bold (P≤0.05). Single and co-provisioned nitrogen sources are compared using Student t-tests, with asterisks indicating significant differences; specifically, *0.05>P>0.01, **0.01>P>0.001, and ***< 0.001.
Fig. 11.
Fig. 11.
The combined use of nitrate and ammonium induces varied effects on growth-promoting hormones as well as hormones and metabolites associated with stress response, depending on the pH and species involved. The content and ratio of growth-promoting hormones (A–C), hormones related to stress response (D–H), and methylglyoxal (I) were measured in the shoot and root of spinach and pea plants treated with nitrate (‘N’), ammonium (‘A’), or equimolar co-provisions of ammonium and nitrate (‘AN1:1’) at pH 6 and 8. The data represent means ±SE (n=3–5). Different letters indicate significant differences according to Tukey’s test (P<0.05) between treatments. Spinach and pea plants were grown for 3 and 2 weeks, respectively, with a continuous supply of nitrate [Ca(NO3)2], ammonium [(NH4)2SO4], or equimolar co-provision of both [Ca(NO3)2+(NH4)2SO4]. A total of 5 mM nitrogen was applied for spinach and 10 mM for pea plants.

Similar articles

Cited by

References

    1. Ariz I, Cruz C, Moran JF, González-Moro MB, García-Olaverri C, González-Murua C, Martins-Loução MA, Aparicio-Tejo PM. 2011. Depletion of the heaviest stable N isotope is associated with NH4+/NH3 toxicity in NH4+-fed plants. BMC Plant Biology 11, 83. - PMC - PubMed
    1. Aslam M, Travis RL, Huffaker RC. 1994. Stimulation of nitrate and nitrite efflux by ammonium in barley (Hordeum vulgare L.) seedlings. Plant Physiology 106, 1293–1301. - PMC - PubMed
    1. Bendall DS, Howe CJ, Nisbet EG, Nisbet RER. 2008. Introduction. Photosynthetic and atmospheric evolution. Philosophical Transactions of the Royal Society B: Biological Sciences 363, 2625–2628. - PMC - PubMed
    1. Borysiuk K, Ostaszewska-Bugajska M, Vaultier M-N, Hasenfratz-Sauder M-P, Szal B. 2018. Enhanced formation of methylglyoxal-derived advanced glycation end products in Arabidopsis under ammonium nutrition. Frontiers in Plant Science 9, 667. - PMC - PubMed
    1. Breuillin-Sessoms F, Floss DS, Karen Gomez S, et al.. 2015. Suppression of arbuscule degeneration in Medicago truncatula phosphate transporter4 mutants is dependent on the ammonium transporter 2 family protein AMT2;3. The Plant Cell 27, 1352–1366. - PMC - PubMed

Publication types

LinkOut - more resources