. 2024 Apr 1;223(4):e202209027.
doi: 10.1083/jcb.202209027. Epub 2024 Mar 11.

Paxillin phase separation promotes focal adhesion assembly and integrin signaling

Affiliations

Paxillin phase separation promotes focal adhesion assembly and integrin signaling

Peigang Liang et al. J Cell Biol. .

Abstract

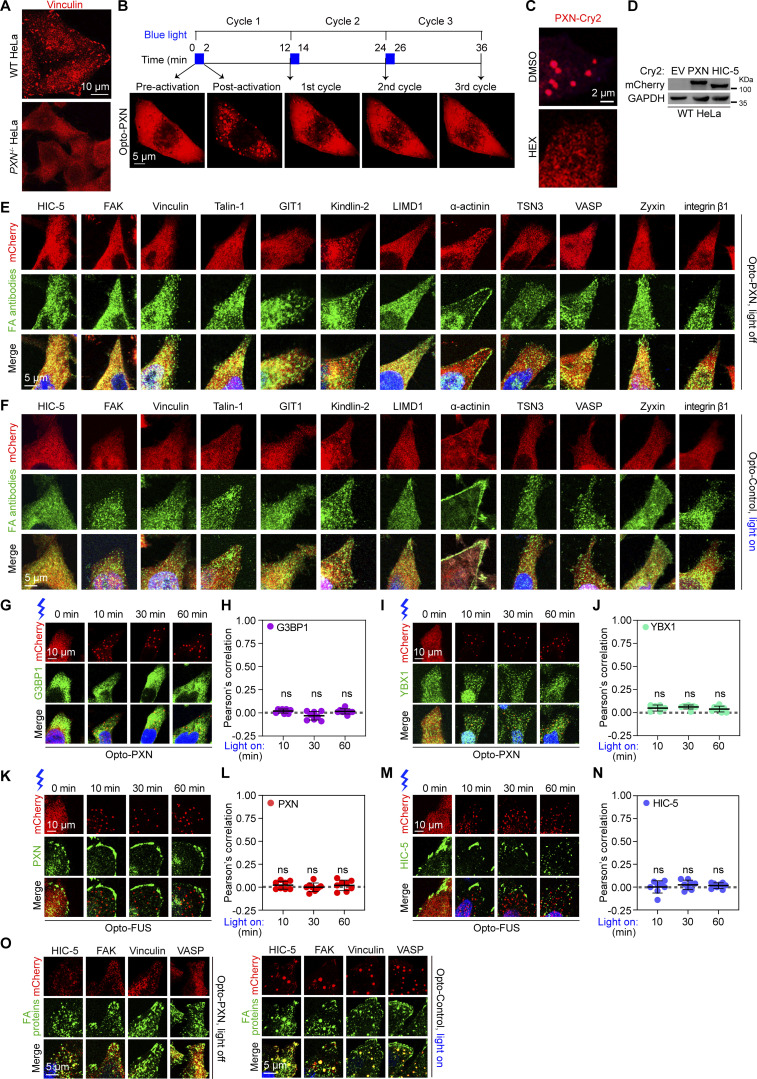
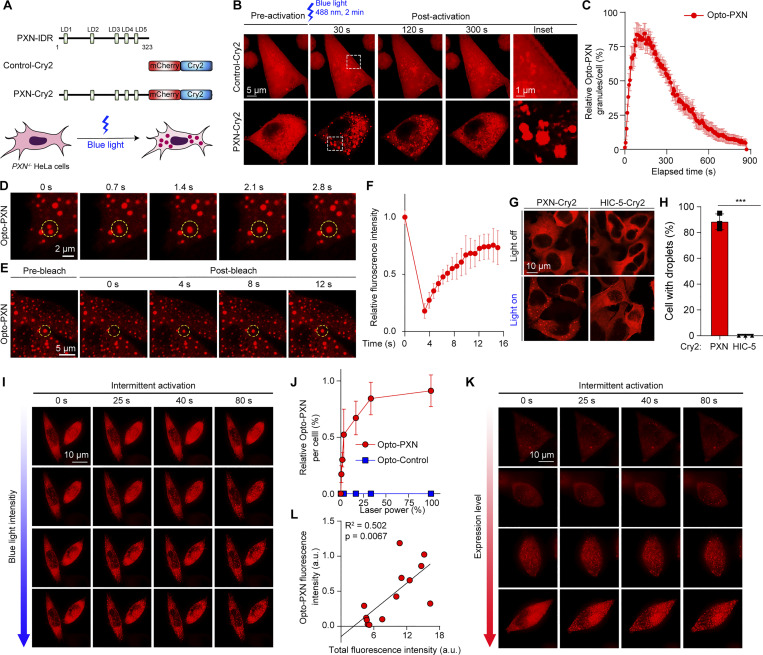
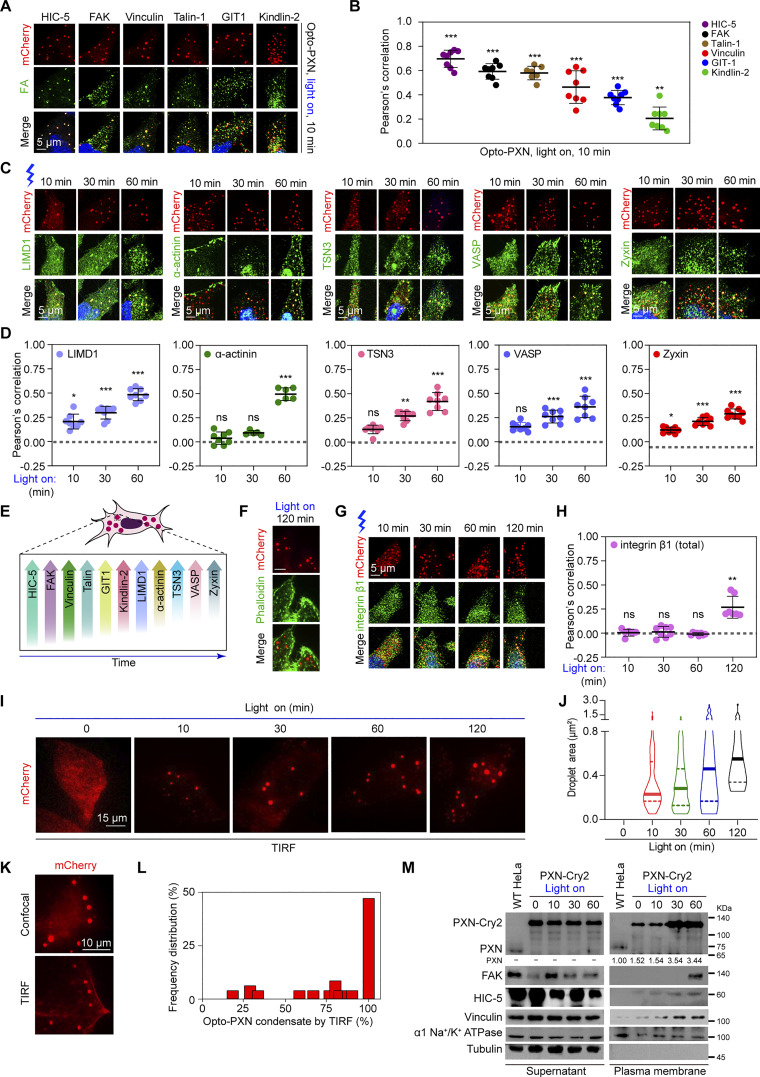
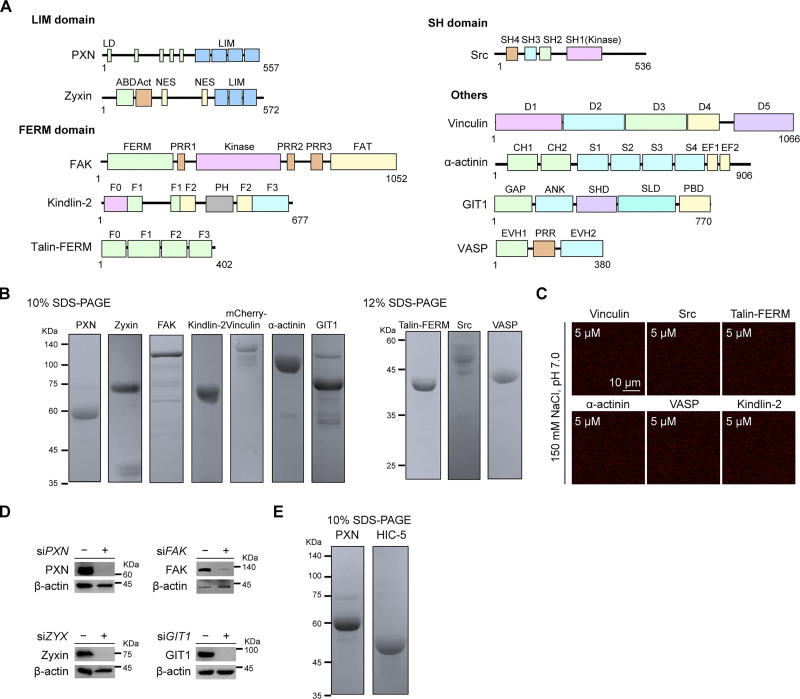
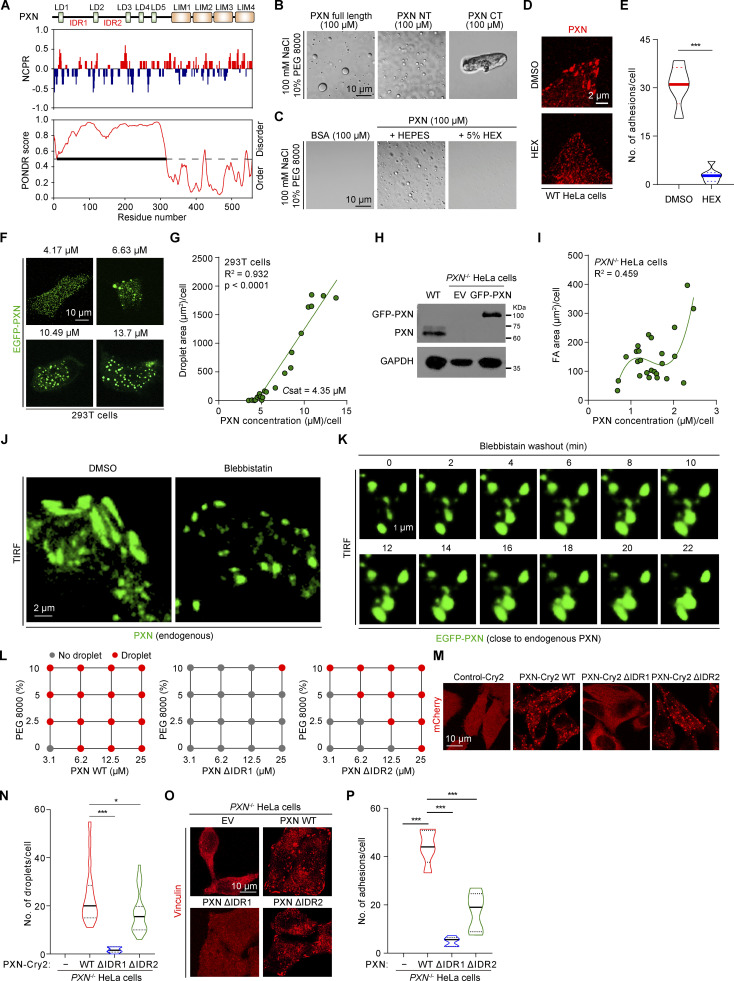
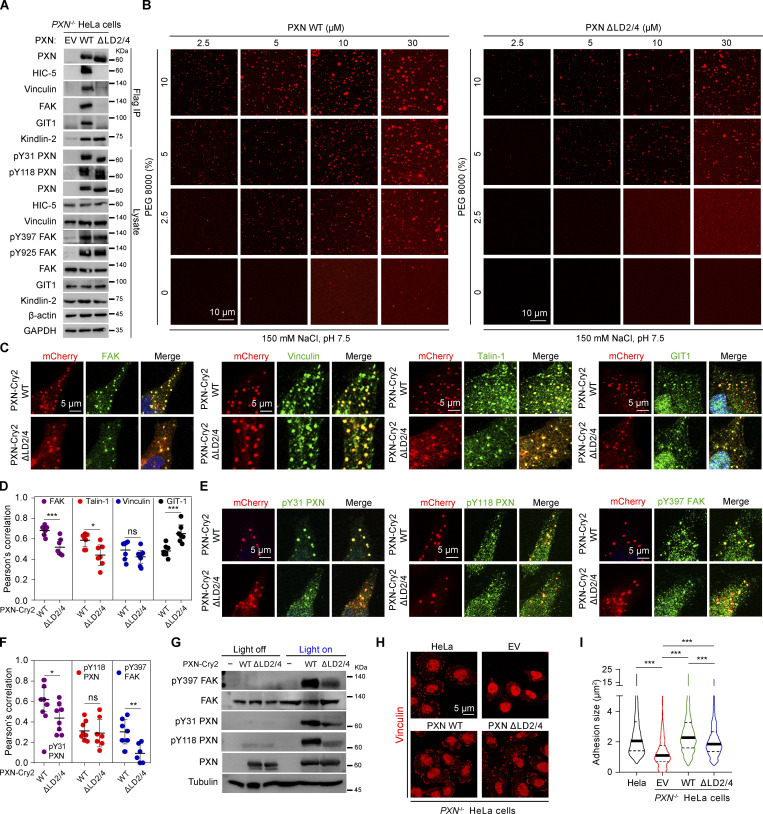
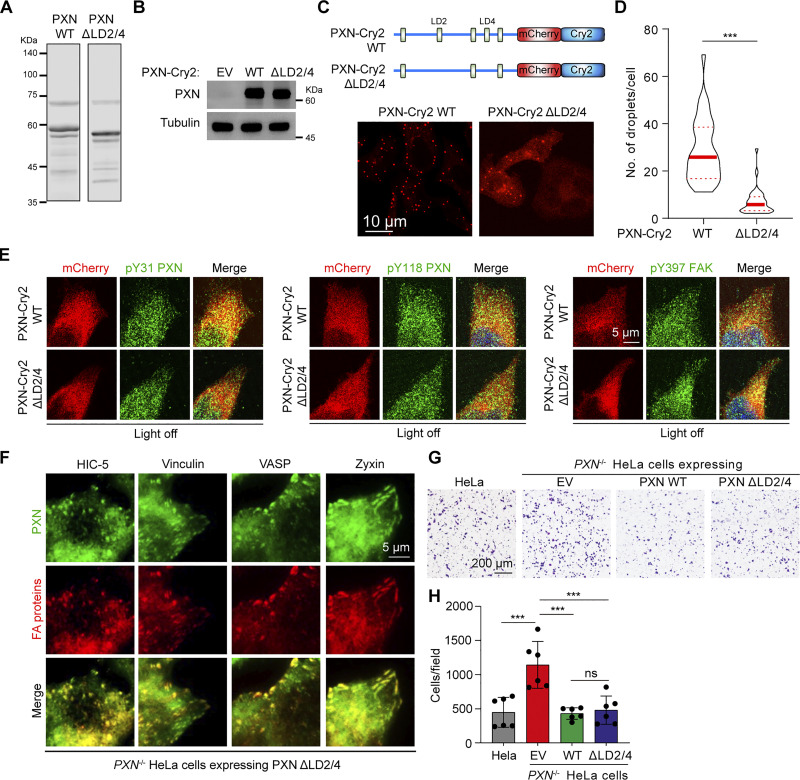
Focal adhesions (FAs) are transmembrane protein assemblies mediating cell-matrix connection. Although protein liquid-liquid phase separation (LLPS) has been tied to the organization and dynamics of FAs, the underlying mechanisms remain unclear. Here, we experimentally tune the LLPS of PXN/Paxillin, an essential scaffold protein of FAs, by utilizing a light-inducible Cry2 system in different cell types. In addition to nucleating FA components, light-triggered PXN LLPS potently activates integrin signaling and subsequently accelerates cell spreading. In contrast to the homotypic interaction-driven LLPS of PXN in vitro, PXN condensates in cells are associated with the plasma membrane and modulated by actomyosin contraction and client proteins of FAs. Interestingly, non-specific weak intermolecular interactions synergize with specific molecular interactions to mediate the multicomponent condensation of PXN and are efficient in promoting FA assembly and integrin signaling. Thus, our data establish an active role of the PXN phase transition into a condensed membrane-associated compartment in promoting the assembly/maturation of FAs.


Conflict of interest statement

Disclosures: The authors declare no competing interests exist.

Figures

Figure S1.
Figure S1.
Characterization of light-induced Opto-PXN condensates (related to Figs. 1 and 2). (A) Representative photographs of WT and PXN−/− HeLa cells stained with antibody against Vinculin. (B) PXN−/− HeLa cells stably expressing PXN-Cry2 were subjected to the indicated paradigm of blue light treatment. Representative images are shown from three independent experiments. (C) HeLa cells expressing PXN-Cry2 were pretreated with 5% 1,6-hexanediol for 10 min and then stimulated with blue light for 10 min. (D) Lysates prepared from WT HeLa cells stably expressing empty vector (EV), PXN-Cry2, or HIC-5-Cry2 were analyzed by immunoblotting against the indicated antibodies. (E and F) Representative images of PXN−/− HeLa cells expressing either PXN-Cry2 or Control-Cry2 immunostained with the indicated antibodies. (G–J) PXN−/− HeLa cells expressing PXN-Cry2 were activated with blue light for the indicated time and immunostained with antibodies against G3BP1 (G) and YBX1 (I), respectively. The Pearson’s correlation of G3BP1 and YBX1 with the Opto-PXN droplets were quantified and presented as mean ± SD in H and J. (K–N) WT HeLa cells transiently transfected with Opto-FUS were stimulated with blue light for the indicated time. The cells were then fixed and immunostained with antibodies against PXN or HIC-5. Representative confocal images are shown in K and M. And the Pearson’s correlation of PXN or HIC-5 with Opto-FUS condensates was quantified in L and N. ns, not significant by one-way ANOVA. (O) WT HeLa cells expressing PXN-Cry2 were immunostained with the indicated antibodies before and after blue light stimulation. Representative confocal images were shown. Source data are available for this figure: SourceData FS1.
Figure 1.
Figure 1.
Light-induced PXN LLPS. (A) Schematic illustrations of the Control-Cry2 and PXN-Cry2. (B) Representative images of PXN−/− HeLa cells stably expressing Control-Cry2 or PXN-Cry2 constructs treated with 2 min of 488 nm blue light. (C) Quantification of the Opto-PXN droplet formation over time from B. Data are shown as mean ± SD. n = 145. (D) Live images show the rapid fusion of Opto-PXN. (E and F) HeLa cells expressing PXN-Cry2 were first stimulated with a pulse of 488 blue light, and the circled areas were photobleached. The fluorescence intensity was monitored over time and quantified (F). Data are shown as mean ± SD. n = 9. (G) Representative images of WT HeLa cells stably expressing PXN-Cry2 or HIC-5-Cry2 stimulated with blue light for 30 min. (H) Percentage of cells with droplets was calculated from three independent experiments. Data are shown as mean ± SEM. ***P < 0.001 by unpaired Student’s t test. (I) HeLa cells expressing PXN-Cry2 were treated with an intermittent blue light laser for the indicated time. Blue light intensity was gradually augmented from top to bottom. (J) The correlation between relative blue light laser power and the formation of Opto-PXN condensates was determined in J. Data are shown as mean ± SD. n = 13. (K) Cells with different levels of PXN-Cry2 were treated with intermittent blue light for the indicated time followed by image acquisition using the 561 nm channel. (L) The correlation between the relative PXN-Cry2 protein level and the total fluorescence intensity of Opto-PXN condensates was determined. Data are shown as mean ± SD.
Figure 2.
Figure 2.
Light-induced PXN LLPS drives the nucleation of FA proteins. (A) PXN−/− HeLa cells expressing PXN-Cry2 were activated with blue light for 10 min and processed for immunostaining with the indicated antibodies. (B) The Pearson’s correlation of each protein with the Opto-PXN droplets was quantified (B). Data are presented as mean ± SD. (C and D) PXN−/− HeLa cells expressing PXN-Cry2 were activated with blue light for the indicated time and immunostained with antibodies against the indicated proteins (C). The Pearson’s correlation was quantified in D. Data are presented as mean ± SD. (E) Schematic summary of the results from A–D. (F) PXN−/− HeLa cells expressing PXN-Cry2 were treated with blue light for 120 min and stained with Phalloidin to visualize F-actin. (G and H) PXN−/− HeLa cells expressing PXN-Cry2 were activated with blue light for the indicated time and immunostained with antibodies against integrin β1 (G). The Pearson’s correlation was quantified in H. (I and J) PXN−/− HeLa cells expressing PXN-Cry2 were activated with blue light for the indicated time and were imaged with TIRF microscopy. Droplet area was determined and shown in J. (K and L) PXN−/− HeLa cells expressing PXN-Cry2 were activated with blue light and imaged by confocal and TIRF microscopy, respectively. The percentage of Opto-PXN condensates visible by TIRF was determined (L). n = 44 cells. (M) PXN−/− HeLa cells expressing PXN-Cry2 were activated with blue light for the indicated time and then subjected to plasma membrane fractionation. The samples were analyzed by immunoblotting with the indicated antibodies. The experiment was repeated two independent times with similar observations. ns, not significant; *P < 0.05; **P < 0.01; ***P < 0.001 by one-way ANOVA. Source data are available for this figure: SourceData F2.
Figure 3.
Figure 3.
Light-induced PXN LLPS activates integrin signaling and accelerates cell spreading. (A) Lysates extracted from HeLa cells expressing either Control-Cry2 or PXN-Cry2 treated with blue light at different time points were separated on SDS-PAGE gels and analyzed by immunoblotting with the indicated antibodies. The experiments were repeated three independent times. (B–I) HeLa cells expressing PXN-Cry2 were stimulated with blue light for different time periods. The cells were stained with the indicated antibodies in B, D, F, and H. The relative fluorescence intensities of individual staining were quantified in C, E, G, and I. Data are presented as mean ± SD. n = 8. ns, not significant; *P < 0.05; **P < 0.01; ***P < 0.001 by one-way ANOVA. (J) PXN−/− HeLa cells expressing Control-Cry2 or PXN-Cry2 were stimulated with blue light for different time periods and stained with antibody specifically against active integrin β1. The mean fluorescence intensity (MFI) was determined by flow cytometry. Data are shown as mean ± SEM. (K) Representative confocal images of HeLa cells expressing PXN-Cry2 that were digested and plated on fibronectin-coated (5 µg/ml) coverslips in the absence (light off) or presence (light on) of blue light illumination for the indicated time. The cells were stained with Phalloidin to highlight morphology. (L) Quantification of the cell area from K. ns, not significant; *P < 0.05; ***P < 0.001 by unpaired Student’s t test. (M) Schematic summary of the results from A–L. Source data are available for this figure: SourceData F3.
Figure S2.
Figure S2.
Light-induced PXN LLPS activates integrin signaling (related to Fig. 3). (A) The relative band intensities of Fig. 3 A were quantified by densitometry. Data are presented as mean ± SEM, n = 3 independent experiments. (B and C) HeLa cells expressing PXN-Cry2 were illuminated with blue light for the indicated time and immunostained with antibodies against inactive integrin β1. The Pearson’s correlation of inactive integrin β1 and Opto-PXN was quantified in C. Data are presented as mean ± SD. ns, not significant by one-way ANOVA. (D) Pxn−/− MEFs expressing PXN-Cry2 were activated with blue light for the indicated time and immunostained with the indicated antibodies. (E) Pxn−/− MEFs expressing Control-Cry2 or PXN-Cry2 were treated with blue light for 2 h. The cells were harvested and analyzed by immunoblotting using the indicated antibodies. (F) Representative confocal images of HeLa cells expressing Control-Cry2 that were digested and plated on fibronectin-coated (5 µg/ml) coverslips in the absence (light off) or presence (light on) of blue light for the indicated time. The cells were stained with Phalloidin to highlight morphology. (G) Quantification of the cell area from F. ns, not significant by unpaired Student’s t test. (H) MEFs expressing Control-Cry2 or PXN-Cry2 were digested and allowed to spread for the indicated time with or without blue light treatment. The area of at least 80 cells at each condition was quantified. ns, not significant; *P < 0.05 by one-way ANOVA. Source data are available for this figure: SourceData FS2.
Figure S3.
Figure S3.
PXN undergoes LLPS and is required for FA assembly (related to Fig. 4). (A) Domain organization of representative adhesion proteins. (B) Recombinant FA proteins were separated by 10% and 12% SDS-PAGE gels and visualized by Coomassie Blue. (C) LLPS of representative adhesion proteins at the indicated concentration in physiological buffer (150 mM NaCl, pH 7.5) in the absence of a crowding agent. (D) HeLa cells were transiently transfected with siRNA against PXN, FAK, ZYX, or GIT1. Cell lysates were analyzed by immunoblotting against the indicated antibodies. (E) Full-length PXN and HIC-5 recombinant proteins were separated on 10% SDS-PAGE gels and stained with Coomassie Blue. Source data are available for this figure: SourceData FS3.
Figure 4.
Figure 4.
PXN undergoes LLPS and is required for FA formation. (A) LLPS of PXN, FAK, Zyxin, and GIT1 at the indicated concentrations in physiological buffer (150 mM NaCl, pH 7.5) in the absence of crowding agents. All the proteins were labeled with Cy3 NHS ester. (B) The droplet size of each individual protein formed at various concentrations was quantified in B. (C) HeLa cells transfected with the indicated siRNA were fixed and stained with antibodies against Vinculin. Representative images were shown from two independent experiments. (D and E) Adhesion size and number were quantified and shown in D and E, respectively. ns, not significant; *P < 0.05; ***P < 0.001 by one-way ANOVA. (F) PXN−/− HeLa cells were transiently transfected with Flag-GFP, Flag-PXN, or Flag-HIC-5 constructs. The cells were stained with Phalloidin and antibody against Vinculin. (G) The FA size under each experimental condition was quantified in G. ***P < 0.001 by one-way ANOVA. (H) Representative images of LLPS of PXN and HIC-5 at the indicated protein concentrations.
Figure 5.
Figure 5.
PXN LLPS promotes FA assembly. (A) Prediction of disordered regions (PONDR) and charge distribution (NCPR) were aligned with PXN domains. (B) Representative DIC images of LLPS of PXN full length, N-terminus (NT), and C-terminus (CT) in vitro (150 mM NaCl, pH 7.5, 10% PEG 8000). (C) Representative DIC images of PXN in the presence or absence of 5% 1,6-hexanediol. (D) WT HeLa cells were treated with 5% 1,6-hexanediol and stained with antibody against PXN. (E) The number of PXN+ adhesions was quantified. ***P < 0.001 by unpaired Student’s t test. (F) Representative confocal images of EGFP-PXN expression at different concentrations in the 293T cells. (G) The correlation between the protein concentration of EGFP-PXN and the condensate area is shown in G. (H) Protein samples prepared from WT HeLa and PXN−/− HeLa cells reconstituted with empty vector (EV) or GFP-PXN were analyzed by immunoblotting against the indicated antibodies. (I) EGFP-PXN was reconstituted into PXN−/− HeLa cells to near endogenous PXN level. The correlation between PXN concentration and FA area was determined. The graph was modeled with polynomial regression. (J) WT HeLa cells treated with DMSO or blebbistatin were stained with an antibody against PXN and imaged with TIRF microscopy. (K) HeLa cells expressing EGFP-PXN close to the endogenous PXN expression were recovered from blebbistatin treatment and subjected to live cell imaging with TIRF microscopy. (L) Phase diagrams of PXN WT, ΔIDR1, and ΔIDR2 with increasing concentrations of PEG 8000. (M) Representative images of PXN−/− HeLa cells expressing PXN-Cry2 WT, ΔIDR1, or ΔIDR2 stimulated with blue light for 10 min. (N) Number of Opto-PXN droplets was quantified in N. *P < 0.05; ***P < 0.001 by one-way ANOVA. (O and P) Representative images of PXN−/− HeLa cells reconstituted with EV, PXN WT, ΔIDR1, or ΔIDR2 immunostained with antibody against Vinculin. FA size was quantified and presented in P. ***P < 0.001 by one-way ANOVA. Source data are available for this figure: SourceData F5.
Figure S4.
Figure S4.
Characterization of PXN LLPS (related to Fig. 5). (A) Purified PXN N-terminus (NT) and C-terminus (CT) were separated on 12% SDS-PAGE and stained with Coomassie Blue. (B) Phase diagram of PXN at different protein concentrations and salt concentrations in the presence of 10% PEG 8000. (C) Representative images of PXN LLPS at salt concentrations ranging from 100 to 500 mM. PXN was labeled with 488 NHS ester. (D) Representative images at different time points showing the fusion event of PXN droplets. (E and F) The PXN droplets were analyzed by FRAP. The relative fluorescence intensity at different time points were quantified in F. Data are shown as mean ± SD, n = 9. (G) MEFs stably expressing EGFP-PXN were analyzed by live cell imaging. Representative images captured the fusion of EGFP-PXN condensates. (H) FRAP analyses of EGFP-PXN condensates in the MEFs. (I) The relative fluorescence intensity of the circled area was quantified. Data are shown as mean ± SD. n = 9. (J) In vitro co-phase separation of PXN with different FA proteins. PXN was labeled with 488 NHS ester and the other adhesion proteins were labeled with Cy3 NHS ester. The reactions were in 150 mM NaCl, pH 7.5 in the presence of 10% PEG 8000. (K) Recombinant proteins of PXN WT, ΔIDR1, and ΔIDR2 were separated on 8% SDS-PAGE, and stained with Coomassie Blue. (L) In vitro pull-down assays using the indicated purified proteins. Source data are available for this figure: SourceData FS4.
Figure 6.
Figure 6.
Specific and non-specific molecular interactions cooperatively regulate FA assembly and integrin signaling. (A) PXN−/− HeLa cells reconstituted with EV, Flag-tagged PXN WT, or ΔLD2/4 were subjected to immunoprecipitation with antibody against Flag. The protein samples were then analyzed by immunoblotting against the indicated antibodies. (B) Representative images of LLPS of PXN WT and ΔLD2/4 with increasing concentrations of PEG 8000. (C–F) HeLa cells expressing PXN-Cry2 WT or ΔLD2/4 were activated with blue light, fixed, and immunostained with the indicated antibodies. Representative confocal images are shown in C and E. Quantification of Pearson’s correlation of each individual protein with the Opto-PXN droplets formed by PXN-Cry2 WT or ΔLD2/4 were shown in D and F. Data are shown as mean ± SD. ns, not significant; *P < 0.05; **P < 0.01; ***P < 0.001 by unpaired Student’s t test. (G) HeLa cells expressing with PXN-Cry2 WT or ΔLD2/4 were treated with blue light for 60 min and harvested. Lysates were analyzed by immunoblotting with the indicated antibodies. (H) Representative confocal images of PXN−/− HeLa cells reconstituted with EV, Flag-tagged PXN WT, or ΔLD2/4 immunostained with antibody against Vinculin. (I) FA size was quantified and presented. ***P < 0.001 by one-way ANOVA. Source data are available for this figure: SourceData F6.
Figure S5.
Figure S5.
Specific and non-specific molecular interactions cooperatively regulate FA assembly and integrin signaling (related to Fig. 6). (A) Purified PXN WT and ΔLD2/4 proteins were run on SDS-PAGE gel, stained with Coomassie Blue. (B) Lysates prepared from PXN−/− HeLa cells expressing EV, PXN-Cry2 WT or ΔLD2/4 were analyzed by immunoblotting with the indicated antibodies. (C) Top: schematic illustration of PXN-Cry2 WT and ΔLD2/4. Bottom: representative images of PXN−/− HeLa cells expressing PXN-Cry2 WT or ΔLD2/4 stimulated with blue light for 10 min. (D) Number of Opto-PXN droplets was quantified in D. ***P < 0.001 by unpaired Student’s t test. (E) Representative images of PXN−/− HeLa cells expressing PXN-Cry2 WT or ΔLD2/4 immunostained with antibodies against phospho-FAK (Tyr397), phospho-PXN (Tyr31 and Tyr118). (F) Representative images of PXN−/− HeLa cells expressing PXN-Cry2 ΔLD2/4 immunostained with the indicated antibodies. (G and H) PXN−/− HeLa cells reconstituted with EV, PXN WT, or ΔLD2/4 were subjected to transwell assay. Representative images of cells stained with crystal violet are shown in G from three independent experiments. (H) Quantification of cells migrated to the lower chambers is shown. Data are presented as mean ± SEM. ***P < 0.001 by one-way ANOVA. Source data are available for this figure: SourceData FS5.

Similar articles

Cited by

References

    1. Alberti, S., Gladfelter A., and Mittag T.. 2019. Considerations and challenges in studying liquid-liquid phase separation and biomolecular condensates. Cell. 176:419–434. 10.1016/j.cell.2018.12.035 - DOI - PMC - PubMed
    1. Alberti, S., and Hyman A.A.. 2021. Biomolecular condensates at the nexus of cellular stress, protein aggregation disease and ageing. Nat. Rev. Mol. Cell Biol. 22:196–213. 10.1038/s41580-020-00326-6 - DOI - PubMed
    1. Alpha, K.M., Xu W., and Turner C.E.. 2020. Paxillin family of focal adhesion adaptor proteins and regulation of cancer cell invasion. Int. Rev. Cell Mol. Biol. 355:1–52. 10.1016/bs.ircmb.2020.05.003 - DOI - PMC - PubMed
    1. Bracha, D., Walls M.T., and Brangwynne C.P.. 2019. Probing and engineering liquid-phase organelles. Nat. Biotechnol. 37:1435–1445. 10.1038/s41587-019-0341-6 - DOI - PubMed
    1. Bracha, D., Walls M.T., Wei M.T., Zhu L., Kurian M., Avalos J.L., Toettcher J.E., and Brangwynne C.P.. 2018. Mapping local and global liquid phase behavior in living cells using photo-oligomerizable seeds. Cell. 175:1467–1480.e13. 10.1016/j.cell.2018.10.048 - DOI - PMC - PubMed

Publication types