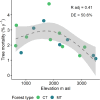
Tree mortality and recruitment in secondary Andean tropical mountain forests along a 3000 m elevation gradient
- PMID: 38466663
- PMCID: PMC10927132
- DOI: 10.1371/journal.pone.0300114
Tree mortality and recruitment in secondary Andean tropical mountain forests along a 3000 m elevation gradient
Abstract
This study addresses the understudied dynamics of mortality and recruitment in Tropical Mountain forests, critical determinants of forest structural processes and biomass turnover. We examine how these demographic processes change with elevation and varying degrees of forest recovery by utilizing two forest censuses (2015 and 2019) from 16 plots (0.36 ha) across a 600-3500 m asl elevation gradient in the Ecuadorian Andes. Employing multivariate PCA analyses, we characterize successional forest dynamics and explore relationships between demographic rates, elevation, and indicators of forest recovery using standard linear regression and generalized additive models (GAMs). Contrary to our hypothesis, mortality exhibits a unimodal response, peaking at mid-elevations, with no significant relationship to above-ground biomass productivity (AGBp). In our successional forests, dominance by fast-growing species alters expected patterns, leading to increased mortality rates and AGBp, particularly at low-mid elevations. Forest recovery emerges as a significant driver of mortality and the sole predictor of recruitment, especially across different recovery statuses. Although forest recovery doesn't impact mortality rates, it elucidates the identity of declining species in forests with varying recovery degrees. Our findings underscore that while forest recovery does not alter mortality rates, it provides critical insights into understanding which species are affected under varying recovery conditions. Recruitment, primarily driven by successional dynamics, exhibits higher rates in sites with less recovery. Furthermore, we demonstrate the utility of forest structure indicators, such as above-ground biomass, in inferring successional dynamics when the time since the last disturbance is unknown. The study emphasizes the importance of considering disturbances in comprehending the intricate interplay between the environment and forest dynamics in secondary forests.
Copyright: © 2024 Ordoñez et al. This is an open access article distributed under the terms of the Creative Commons Attribution License, which permits unrestricted use, distribution, and reproduction in any medium, provided the original author and source are credited.
Conflict of interest statement
All authors declare that they have no conflicts of interest.
Figures


Similar articles
-
The legacy of biogeographic history on the composition and structure of Andean forests.Ecology. 2020 Oct;101(10):e03131. doi: 10.1002/ecy.3131. Epub 2020 Sep 21. Ecology. 2020. PMID: 32629538
-
Effects of thinning on the demography and functional community structure of a secondary tropical lowland rain forest.J Environ Manage. 2021 Feb 1;279:111805. doi: 10.1016/j.jenvman.2020.111805. Epub 2020 Dec 11. J Environ Manage. 2021. PMID: 33316643
-
Large-scale patterns of turnover and Basal area change in Andean forests.PLoS One. 2015 May 14;10(5):e0126594. doi: 10.1371/journal.pone.0126594. eCollection 2015. PLoS One. 2015. PMID: 25973977 Free PMC article.
-
Patterns and mechanisms of spatial variation in tropical forest productivity, woody residence time, and biomass.New Phytol. 2021 Mar;229(6):3065-3087. doi: 10.1111/nph.17084. Epub 2020 Dec 19. New Phytol. 2021. PMID: 33207007 Review.
-
Implications of size-dependent tree mortality for tropical forest carbon dynamics.Nat Plants. 2021 Apr;7(4):384-391. doi: 10.1038/s41477-021-00879-0. Epub 2021 Mar 29. Nat Plants. 2021. PMID: 33782580 Review.
References
-
- Stephenson NL, van Mantgem PJ, Bunn AG, Bruner H, Harmon ME, O’Connell KB, et al.. Causes and implications of the correlation between forest productivity and tree mortality rates. Ecological Monographs. 2011;81(4):527–55. 10.1890/10-1077.1. - DOI
MeSH terms
LinkOut - more resources
Full Text Sources

