

A quantitative analysis of Final Palaeolithic/earliest Mesolithic cultural taxonomy and evolution in Europe
- PMID: 38466685
- PMCID: PMC10927100
- DOI: 10.1371/journal.pone.0299512
A quantitative analysis of Final Palaeolithic/earliest Mesolithic cultural taxonomy and evolution in Europe
Erratum in
-
Correction: A quantitative analysis of Final Palaeolithic/earliest Mesolithic cultural taxonomy and evolution in Europe.PLoS One. 2024 Dec 12;19(12):e0315964. doi: 10.1371/journal.pone.0315964. eCollection 2024. PLoS One. 2024. PMID: 39666723 Free PMC article.
Abstract
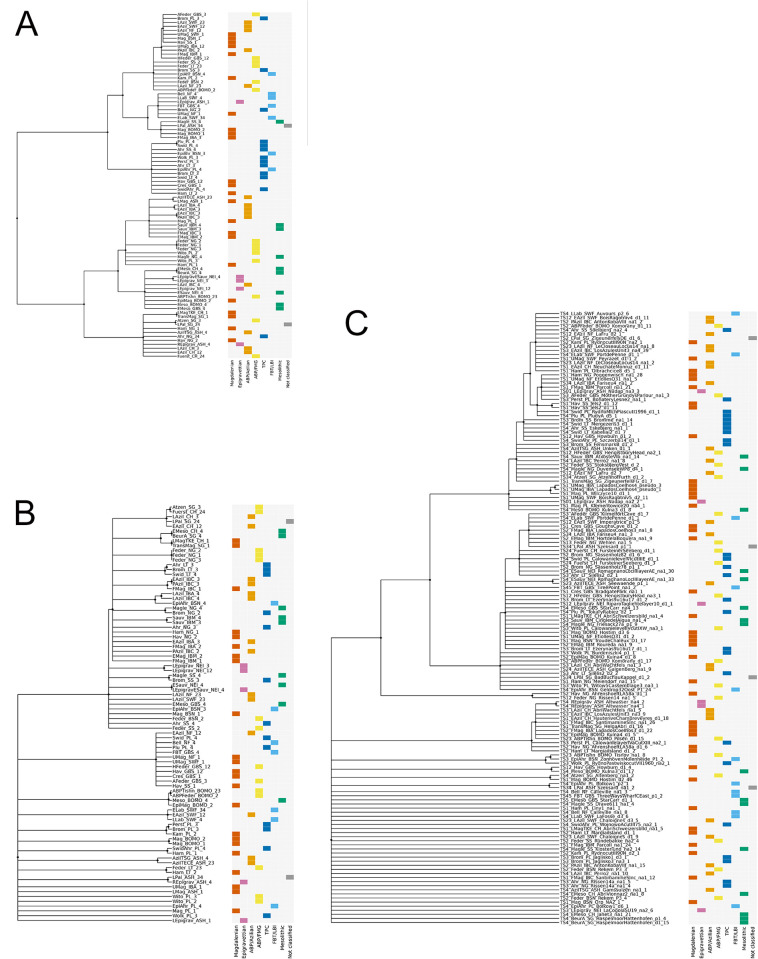
Archaeological systematics, together with spatial and chronological information, are commonly used to infer cultural evolutionary dynamics in the past. For the study of the Palaeolithic, and particularly the European Final Palaeolithic and earliest Mesolithic, proposed changes in material culture are often interpreted as reflecting historical processes, migration, or cultural adaptation to climate change and resource availability. Yet, cultural taxonomic practice is known to be variable across research history and academic traditions, and few large-scale replicable analyses across such traditions have been undertaken. Drawing on recent developments in computational archaeology, we here present a data-driven assessment of the existing Final Palaeolithic/earliest Mesolithic cultural taxonomy in Europe. Our dataset consists of a large expert-sourced compendium of key sites, lithic toolkit composition, blade and bladelet production technology, as well as lithic armatures. The dataset comprises 16 regions and 86 individually named archaeological taxa ('cultures'), covering the period between ca. 15,000 and 11,000 years ago (cal BP). Using these data, we use geometric morphometric and multivariate statistical techniques to explore to what extent the dynamics observed in different lithic data domains (toolkits, technologies, armature shapes) correspond to each other and to the culture-historical relations of taxonomic units implied by traditional naming practice. Our analyses support the widespread conception that some dimensions of material culture became more diverse towards the end of the Pleistocene and the very beginning of the Holocene. At the same time, cultural taxonomic unit coherence and efficacy appear variable, leading us to explore potential biases introduced by regional research traditions, inter-analyst variation, and the role of disjunct macroevolutionary processes. In discussing the implications of these findings for narratives of cultural change and diversification across the Pleistocene-Holocene transition, we emphasize the increasing need for cooperative research and systematic archaeological analyses that reach across research traditions.
Copyright: © 2024 Riede et al. This is an open access article distributed under the terms of the Creative Commons Attribution License, which permits unrestricted use, distribution, and reproduction in any medium, provided the original author and source are credited.
Conflict of interest statement
We declare no competing interests.
Figures


References
-
- Bon F. Préhistoire. La fabrique de l’homme. Paris: Éditions du Seuil; 2009.
-
- Clark GA. Accidents of History: Conceptual Frameworks in Paleoarchaeology. In: Camps M, Chauhan P, editors. Sourcebook of Paleolithic Transitions: Methods, Theories, and Interpretations. New York, NY: Springer New York; 2009. pp. 19–41.
-
- Sackett JR. Straight Archaeology French Style: The Phylogenetic Paradigm in Historic Perspective. In: Clark GA, editor. Perspectives on the Past Theoretical Biases in Mediterranean Hunter-Gatherer Research. Philadelphia, PE.: University of Pennsylvania Press; 1991. pp. 109–139.
-
- Bocquet-Appel J-P, Demars P-Y, Noiret L, Dobrowsky D. Estimates of Upper Palaeolithic meta-population size in Europe from archaeological data. Journal of Archaeological Science. 2005;32: 1656–1668. doi: http%3A//dx.doi.org/10.1016/j.jas.2005.05.006
-
- Clark JGD. The Mesolithic Settlement of Northern Europe. New York: Greenwood; 1936.
MeSH terms
LinkOut - more resources
Full Text Sources
Miscellaneous
