Prognostic risk models for incident hypertension: A PRISMA systematic review and meta-analysis
- PMID: 38466745
- PMCID: PMC10927109
- DOI: 10.1371/journal.pone.0294148
Prognostic risk models for incident hypertension: A PRISMA systematic review and meta-analysis
Abstract
Objective: Our goal was to review the available literature on prognostic risk prediction for incident hypertension, synthesize performance, and provide suggestions for future work on the topic.
Methods: A systematic search on PUBMED and Web of Science databases was conducted for studies on prognostic risk prediction models for incident hypertension in generally healthy individuals. Study-quality was assessed using the Prediction model Risk of Bias Assessment Tool (PROBAST) checklist. Three-level meta-analyses were used to obtain pooled AUC/C-statistic estimates. Heterogeneity was explored using study and cohort characteristics in meta-regressions.
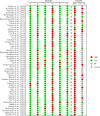
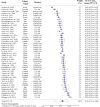
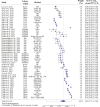
Results: From 5090 hits, we found 53 eligible studies, and included 47 in meta-analyses. Only four studies were assessed to have results with low risk of bias. Few models had been externally validated, with only the Framingham risk model validated more than thrice. The pooled AUC/C-statistics were 0.82 (0.77-0.86) for machine learning models and 0.78 (0.76-0.80) for traditional models, with high heterogeneity in both groups (I2 > 99%). Intra-class correlations within studies were 60% and 90%, respectively. Follow-up time (P = 0.0405) was significant for ML models and age (P = 0.0271) for traditional models in explaining heterogeneity. Validations of the Framingham risk model had high heterogeneity (I2 > 99%).
Conclusion: Overall, the quality of included studies was assessed as poor. AUC/C-statistic were mostly acceptable or good, and higher for ML models than traditional models. High heterogeneity implies large variability in the performance of new risk models. Further, large heterogeneity in validations of the Framingham risk model indicate variability in model performance on new populations. To enable researchers to assess hypertension risk models, we encourage adherence to existing guidelines for reporting and developing risk models, specifically reporting appropriate performance measures. Further, we recommend a stronger focus on validation of models by considering reasonable baseline models and performing external validations of existing models. Hence, developed risk models must be made available for external researchers.
Copyright: © 2024 Schjerven et al. This is an open access article distributed under the terms of the Creative Commons Attribution License, which permits unrestricted use, distribution, and reproduction in any medium, provided the original author and source are credited.
Conflict of interest statement
The authors have declared that no competing interests exist.
Figures


Similar articles
-
Prognostic models for newly-diagnosed chronic lymphocytic leukaemia in adults: a systematic review and meta-analysis.Cochrane Database Syst Rev. 2020 Jul 31;7(7):CD012022. doi: 10.1002/14651858.CD012022.pub2. Cochrane Database Syst Rev. 2020. PMID: 32735048 Free PMC article.
-
Prediction of hypertension using traditional regression and machine learning models: A systematic review and meta-analysis.PLoS One. 2022 Apr 7;17(4):e0266334. doi: 10.1371/journal.pone.0266334. eCollection 2022. PLoS One. 2022. PMID: 35390039 Free PMC article.
-
Performance of the Framingham risk models and pooled cohort equations for predicting 10-year risk of cardiovascular disease: a systematic review and meta-analysis.BMC Med. 2019 Jun 13;17(1):109. doi: 10.1186/s12916-019-1340-7. BMC Med. 2019. PMID: 31189462 Free PMC article.
-
Machine learning and deep learning predictive models for long-term prognosis in patients with chronic obstructive pulmonary disease: a systematic review and meta-analysis.Lancet Digit Health. 2023 Dec;5(12):e872-e881. doi: 10.1016/S2589-7500(23)00177-2. Lancet Digit Health. 2023. PMID: 38000872
-
Prediction of incident atrial fibrillation in community-based electronic health records: a systematic review with meta-analysis.Heart. 2022 Jun 10;108(13):1020-1029. doi: 10.1136/heartjnl-2021-320036. Heart. 2022. PMID: 34607811 Free PMC article.
Cited by
-
Vascular ageing manifestations and hypertension in the community.Am J Prev Cardiol. 2024 Dec 13;21:100918. doi: 10.1016/j.ajpc.2024.100918. eCollection 2025 Mar. Am J Prev Cardiol. 2024. PMID: 39807445 Free PMC article.
-
Development of risk models of incident hypertension using machine learning on the HUNT study data.Sci Rep. 2024 Mar 7;14(1):5609. doi: 10.1038/s41598-024-56170-7. Sci Rep. 2024. PMID: 38454041 Free PMC article.
-
Controversy in Hypertension: Pro-Side of the Argument Using Artificial Intelligence for Hypertension Diagnosis and Management.Hypertension. 2025 Jun;82(6):929-944. doi: 10.1161/HYPERTENSIONAHA.124.22349. Epub 2025 Mar 17. Hypertension. 2025. PMID: 40091745 Review.
References
-
- Zhou B, Carrillo-Larco RM, Danaei G, Riley LM, Paciorek CJ, Stevens GA, et al.. Worldwide trends in hypertension prevalence and progress in treatment and control from 1990 to 2019: a pooled analysis of 1201 population-representative studies with 104 million participants. The Lancet. 2021;398: 957–980. doi: 10.1016/S0140-6736(21)01330-1 - DOI - PMC - PubMed
Publication types
MeSH terms
LinkOut - more resources
Full Text Sources
Medical

