. 2024 Mar 11;20(3):e1011059.
doi: 10.1371/journal.pgen.1011059. eCollection 2024 Mar.

A negative feedback loop is critical for recovery of RpoS after stress in Escherichia coli

Affiliations

A negative feedback loop is critical for recovery of RpoS after stress in Escherichia coli

Sophie Bouillet et al. PLoS Genet. .

Abstract

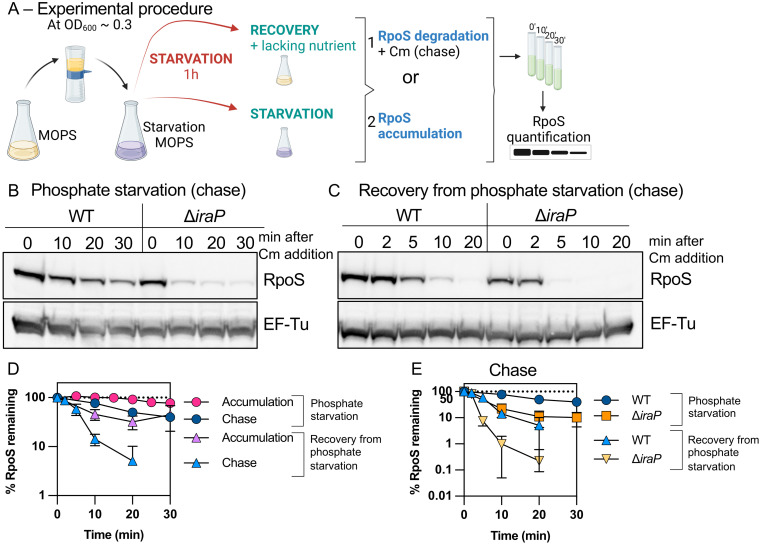
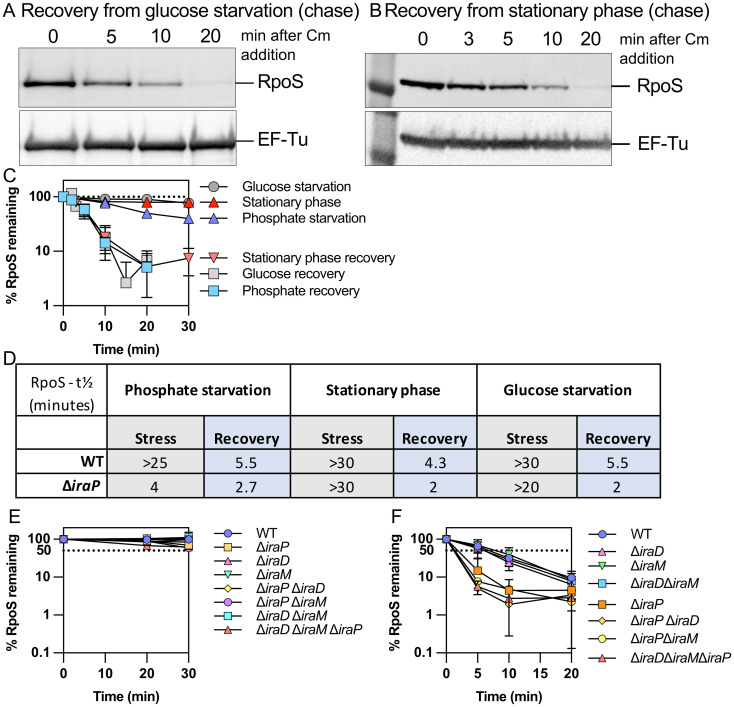
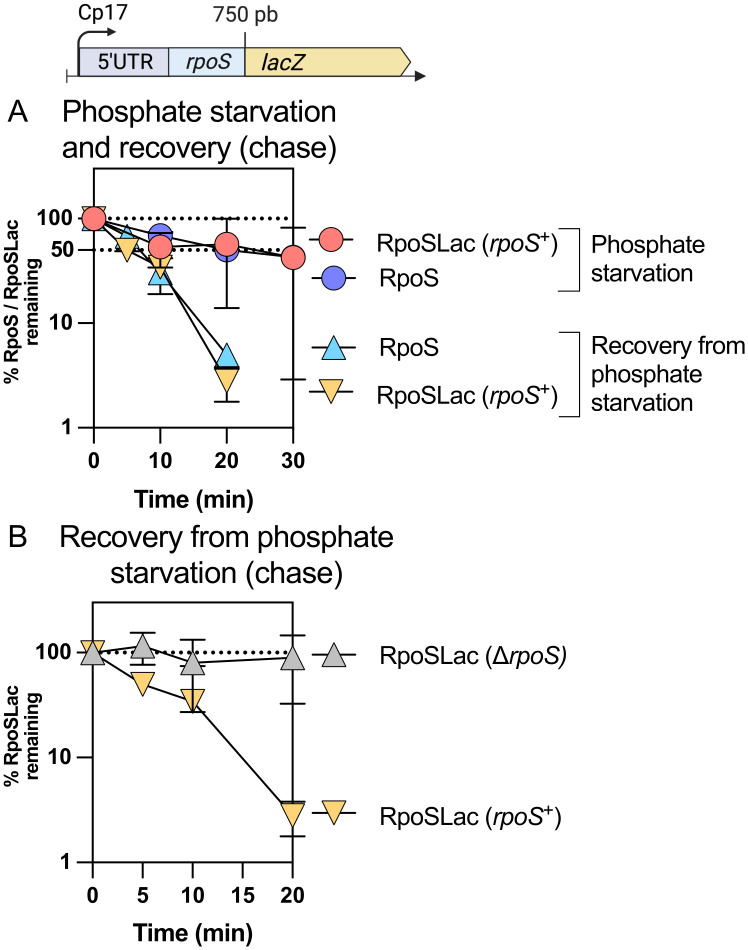
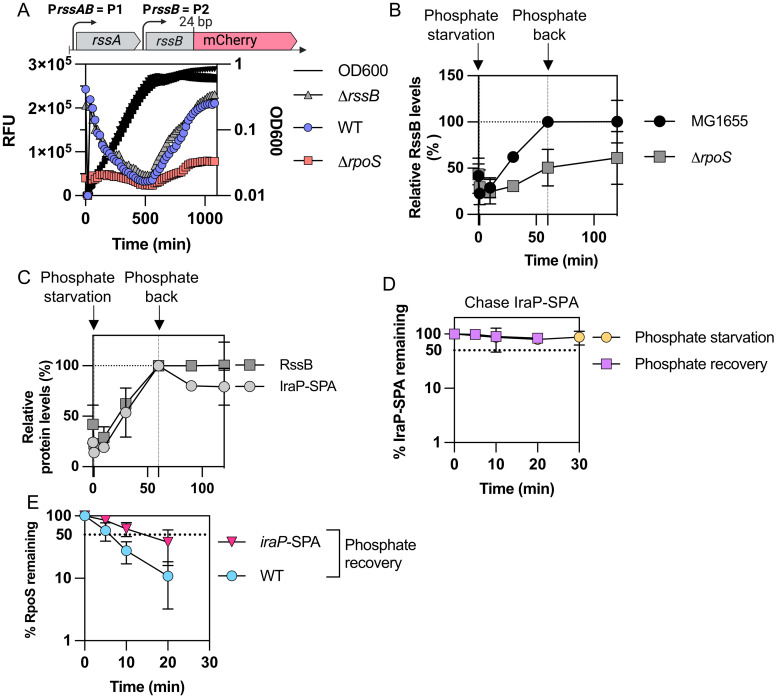
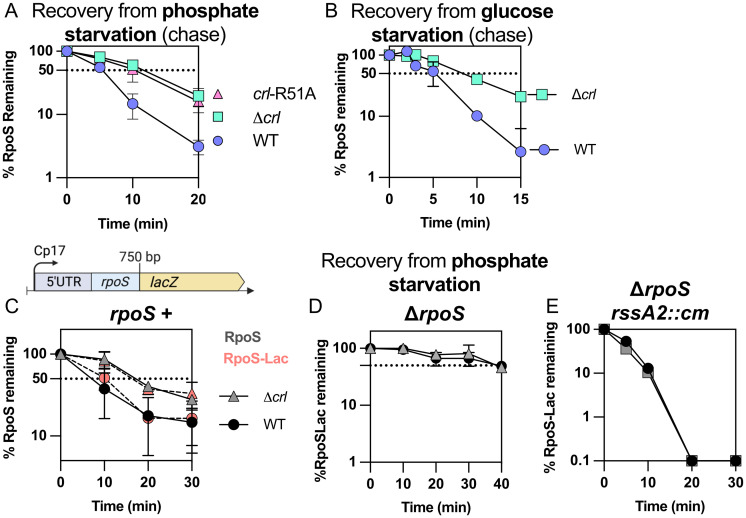
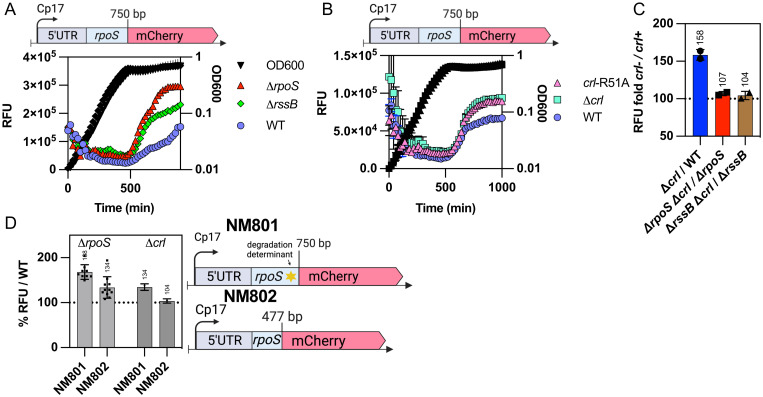
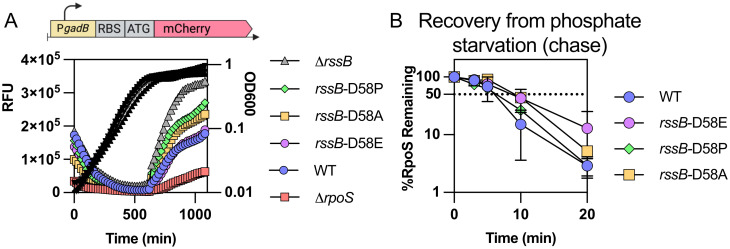
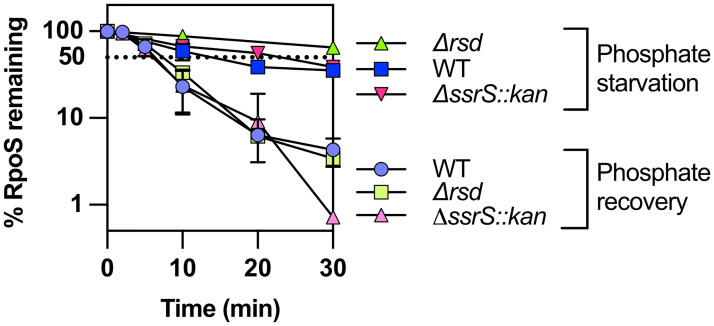
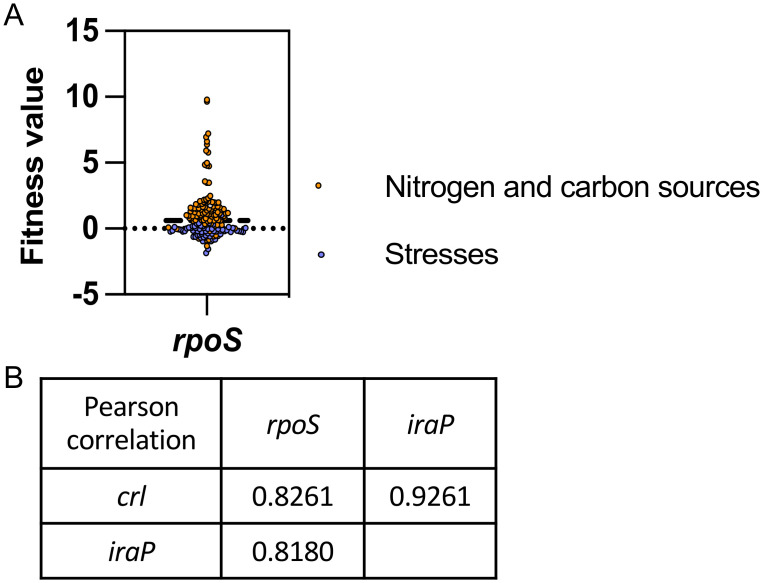
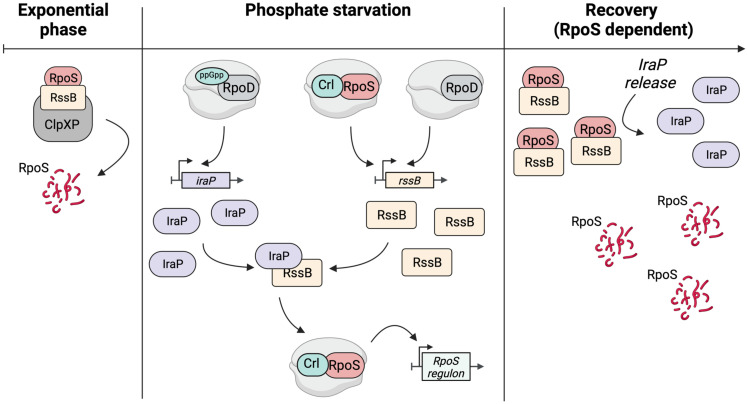
RpoS is an alternative sigma factor needed for the induction of the general stress response in many gammaproteobacteria. Tight regulation of RpoS levels and activity is required for bacterial growth and survival under stress. In Escherichia coli, various stresses lead to higher levels of RpoS due to increased translation and decreased degradation. During non-stress conditions, RpoS is unstable, because the adaptor protein RssB delivers RpoS to the ClpXP protease. RpoS degradation is prevented during stress by the sequestration of RssB by anti-adaptors, each of which is induced in response to specific stresses. Here, we examined how the stabilization of RpoS is reversed during recovery of the cell from stress. We found that RpoS degradation quickly resumes after recovery from phosphate starvation, carbon starvation, and when transitioning from stationary phase back to exponential phase. This process is in part mediated by the anti-adaptor IraP, known to promote RpoS stabilization during phosphate starvation via the sequestration of adaptor RssB. The rapid recovery from phosphate starvation is dependent upon a feedback loop in which RpoS transcription of rssB, encoding the adaptor protein, plays a critical role. Crl, an activator of RpoS that specifically binds to and stabilizes the complex between the RNA polymerase and RpoS, is also required for the feedback loop to function efficiently, highlighting a critical role for Crl in restoring RpoS basal levels.


Conflict of interest statement

The authors have declared that no competing interests exist.

Figures

Fig 1
Fig 1. RpoS degradation quickly resumes after phosphate starvation.
A) Experimental protocol. RpoS levels and degradation during and after phosphate starvation were determined as outlined here. Cells were grown in MOPS minimal medium containing 0.2% glucose and 2mM KPO4 until mid-exponential phase (OD600 ≈ 0.3). The medium was then filtered, and cells were resuspended in MOPS medium without phosphate and incubated for one hour (starvation). RpoS degradation during phosphate starvation was monitored by adding chloramphenicol and aliquots were taken right before (0 minute) and at appropriate time points afterwards (chase). RpoS recovery was measured in two ways. After one hour of starvation, PO4 was restored to a portion of the culture (recovery), while another portion was further incubated under the starvation condition. Samples were taken from both cultures and analyzed either by monitoring RpoS levels with time (RpoS accumulation) or by determining RpoS half-life (RpoS degradation) by a chase after adding chloramphenicol 2 minutes after phosphate was restored and taking aliquots at different time points. After TCA precipitation, samples were loaded onto an SDS-PAGE gel and a Western Blot against RpoS, using EF-Tu as a loading control. Note that in this work, an antibiotic chase to block new protein synthesis is used to follow the half-life of proteins, rather than a radioactive or other label followed by a chase. One difference for such an antibiotic chase, as compared to a pulse-chase, will be that the protein followed during the chase is not necessarily newly synthesized, but both should provide similar estimates of degradation. This figure was created using clipart from BioRender.com. B) Western blot showing RpoS degradation (chase) during phosphate starvation in WT (MG1655) and ΔiraP (SB151) as described in Fig 1A. C) Western blot against RpoS and the loading control EF-Tu showing RpoS degradation (chase) during recovery from phosphate starvation in WT (MG1655) and ΔiraP (SB151) strains following the protocol as described in Fig 1A. D) RpoS levels in WT (MG1655) during and after phosphate starvation, with (chase) and without (accumulation) chloramphenicol, measuring RpoS degradation and overall RpoS levels, respectively (quantitation of WT data from experiments as shown in Fig 1B and 1C for the RpoS chase data and S1A Fig for the RpoS accumulation data). Shown are means with SD, n = 3. E) Effect of IraP on RpoS stabilization during and recovery after phosphate starvation. Quantification of RpoS degradation (chase) during and after phosphate starvation in WT (MG1655) and ΔiraP (SB151) strains (quantitation of Fig 1B and 1C; n > 3; note that data for WT is the same as in Fig 1D).
Fig 2
Fig 2. RpoS levels recover quickly after glucose starvation and after stationary phase.
A) Western blot showing RpoS degradation after recovery from glucose starvation in MG1655 following the protocol described in Fig 1A. B) Western blot showing RpoS degradation after recovery from stationary phase in MG1655. Stationary phase cells were diluted back into fresh medium and chloramphenicol was added after 2 minutes. Samples were taken and treated as described for Fig 1. C) Quantification of RpoS degradation during and after phosphate starvation, glucose starvation and stationary phase (n > 3). Data collected from Western blots as in Figs 1B, 1C, 2A, 2B, S1B and S1C. D) RpoS half-lives in MG1655 and ΔiraP (SB151) strains during (stress) and after (recovery) phosphate starvation, glucose starvation and stationary phase as determined in experiments shown in Figs 1, 2 and S1. RpoS half-lives correspond to the time at which half of the t0 RpoS protein disappears in a chase assay. E) Quantification of RpoS degradation during stationary phase (n > 3) in isogenic derivatives of MG1655 carrying various ira mutants. Strains assayed are listed in legend to S1 Fig. F) Quantification of RpoS degradation after stationary phase (n > 3) in isogenic derivatives of MG1655 carrying various iraP mutants. Strains assayed in 2E and 2F are listed in legend to S1 Fig.
Fig 3
Fig 3. RpoS-Lac recovery from phosphate starvation depends on RpoS.
A) RpoS and RpoS-Lac stabilization during phosphate starvation in the strain SG30013, a derivative of MG1655 containing both rpoS+ in the chromosome and the RpoS-Lac translational fusion at the lacZ site. The fusion contains the full 5’ UTR of rpoS as well as 750 bp of the rpoS coding region, fused in frame to lacZ and expressed from a synthetic (Cp17) promoter. The protocol was as described in Fig 1A, a chase in which chloramphenicol was added to stop new translation. B) RpoS and RpoS-Lac degradation during recovery from phosphate starvation in the strains containing the RpoS-Lac translational fusion in the presence of RpoS (SG30013, yellow triangles), or in a strain deleted for RpoS (INH28, grey triangles); samples were taken as a function of time after chloramphenicol was added to stop translation.
Fig 4
Fig 4. RssB is produced during phosphate starvation dependent upon RpoS.
A) The upstream region of rssB that includes both rssB promoters P1 and P2 was translationally fused to mCherry contained on a pQE80L-derived vector (pSB37, S4A Fig). The fusion includes 24 bp of rssB (encoding 8 amino acids), fused in frame to mCherry. Expression of mCherry was measured during growth in MOPS glucose minimal medium at 37°C in WT, ΔrpoS (AB165) and ΔrssB (SB94) strains carrying the fusion on plasmid pSB37. The RFU (relative fluorescence units) were calculated by dividing the fluorescence values by the OD600 at each time point. B) RssB levels measured in WT and ΔrpoS during and after phosphate starvation. The experiment was performed as described in Fig 1 with the exception that samples were probed for RssB in the Western blot (see S3 Fig for Western blots; n >2). RssB levels in MG1655 at the end of one hour of phosphate starvation were set at 100 and other samples are plotted compared to that. C) RssB and IraP-SPA tagged levels over the course of phosphate starvation and recovery. Strains MG1655 and SB212 (MG1655 containing iraP C-terminally tagged with SPA) were grown in MOPS minimal medium and subjected to phosphate starvation and recovery as described in Fig 1A. Samples were taken before starvation (0’), at 10, 30, and 60 minutes during starvation and after 30 and 60 minutes of recovery (corresponding to 90 and 120 minutes on the graph). Samples were subjected to a Western Blot using anti-Flag to detect the SPA C-terminal tag of IraP-SPA, and the bands were quantified. To compare RssB to IraP-SPA during starvation and recovery, levels of both proteins after 60’ of starvation were set at 100% (N = 3). D) IraP-SPA chase after one hour of phosphate starvation and phosphate recovery, following a similar procedure as described in Fig 1A. Western Blot using anti-Flag antibody was performed to detect IraP-SPA (quantitation from Western Blot as shown in S3E Fig). E) RpoS chase during recovery from phosphate starvation in strains WT (MG1655) and SB212 containing iraP-SPA at the iraP locus (quantitation from Western blot as shown in S3F Fig).
Fig 5
Fig 5. Rapid RpoS recovery from phosphate and glucose starvation requires Crl.
A) RpoS degradation during recovery from phosphate starvation in the WT, Δcrl (SB147) and crl-R51A (SB148) strains (quantitation from Western Blot as shown in S5A Fig). Experiment was performed as described in Fig 1A. B) RpoS degradation during recovery from glucose starvation in the WT and Δcrl (SB147) strains (quantitation from Western Blot as shown in S5B Fig). Experiment was performed as described in Fig 1A. C) RpoS and RpoS-Lac accumulation experiments (no chloramphenicol added) during recovery from phosphate starvation in strains SG30013 (crl+) and SB180 (Δcrl), both containing the RpoS-Lac fusion; quantitation is from Western Blot as shown in S6C Fig. D) RpoS and RpoS-Lac accumulation experiments (no chloramphenicol added) during recovery from phosphate starvation in WT (crl+; circles) and Δcrl (triangles) strains containing the RpoS-Lac fusion but lacking rpoS (INH28 (crl+) and SB176 (Δcrl); quantitation is from Western Blot as shown in S6C Fig. E) RpoS and RpoS-Lac accumulation experiments during recovery from phosphate starvation in strains lacking rpoS and carrying rssA2::cm, which overproduces RssB, SB150 (crl+) and SB174 (Δcrl), both containing the RpoS-Lac; quantitation is from Western Blot as shown in S6C Fig.
Fig 6
Fig 6. Crl-dependence for RpoS-mCherry levels depends on RpoS.
A) The WT (NM801), ΔrpoS::tet (SB238) and ΔrssB::tet (SB225) strains containing the RpoS-mCherry translational fusion were grown and mCherry fluorescence measured over time as described in Fig 4A. B) The WT (NM801), crl-R51A (SB341) and Δcrl::kan (SB228) strains containing the RpoS-mCherry translational fusion were grown and mCherry fluorescence measured over time. C) The effect of the absence of Crl on RpoS-mCherry in the absence of RpoS or in the absence of RssB (high levels of RpoS) was determined by measuring mCherry fluorescence of the WT (NM801), ΔrpoS::tet (SB238), ΔrssB::tet (SB225), Δcrl::kan (SB228), Δcrl::kan ΔrpoS::tet (SB239) and Δcrl::kan ΔrssB::tet (SB283) strains, all containing the RpoS-mCherry fusion, over time as described in Fig 4A. RFU ratios between the strains containing the deletion of crl and the corresponding single ΔrpoS and ΔrssB mutant or WT were calculated from the data shown in S7B Fig (see S7C Fig for full graph). Ratios shown here are from stationary phase (t = 800 minutes). D) The negative feedback loops involved in RpoS regulation were compared in RpoS-mCherry fusions that are subject to both translational and proteolytic regulation (derivatives of NM801 containing RpoS750-mCherry, with 250 amino acids from RpoS, including the degradation determinant around amino acid K173), or fusions unable to be degraded (derivatives of NM802, containing RpoS477-mCherry, with 159 aa from RpoS). mCherry fluorescence was measured over time as described in Fig 4A and the RFU ratios at 800 minutes (during stationary phase) were calculated for rpoS- or crl- derivatives of each fusion compared to WT (from data shown in S7E Fig). RpoS-mCherry strains: WT (NM801), ΔrpoS::tet (SB238) and Δcrl::kan (SB228); RpoS477-mCherry strains: WT (NM802), ΔrpoS::tet (SB439) and Δcrl::kan (SB437).
Fig 7
Fig 7. The phosphorylation status of RssB does not impact RpoS recovery from phosphate starvation.
A) The unphosphorylatable RssB-D58 alleles D58P and D58A and the phosphomimic allele D58E were tested for RpoS activity by following the expression of the transcriptional fusion between gadBp and mCherry expressed on a vector (pSB23) in the strains MG1655, ΔrpoS::tet (AB165), ΔrssB::tet (SB94), rssB-D58E (SB192), rssB-D58A (SB190) and rssB-D58P (SB198). B) RpoS degradation after phosphate starvation of MG1655, rssB-D58E (SB192), rssB-D58A (SB190) and rssB-D58P (SB198). Shown are means with SD, n = 2. Example western blots are shown in S8 Fig.
Fig 8
Fig 8. RpoD activity regulators Rsd and 6S RNA do not impact RpoS degradation after phosphate starvation.
RpoS stability evaluated by adding chloramphenicol to stop translation after 1 hour of phosphate starvation and during recovery from phosphate starvation as described in Fig 1A in WT, Δrsd (SB505) and ΔssrS::kan (SB470) strains (quantitation from Western Blot as shown in S9A and S9B Fig).
Fig 9
Fig 9. Fitness analysis of rpoS gene.
A) Fitness values (log2 ratios) for an rpoS mutant from the fitness browser database (https://fit.genomics.lbl.gov/cgi-bin/myFrontPage.cgi). Positive values mean the gene is detrimental while negative values mean the gene is beneficial for fitness. B) Pearson correlation of fitness values for all conditions tested (168) of rpoS, crl and iraP.
Fig 10
Fig 10. Model for RpoS degradation after phosphate starvation.
This figure was created using clipart from BioRender.com.

Update of

Similar articles

Cited by

References

    1. Cho B-K, Kim D, Knight EM, Zengler K, Palsson BO. Genome-scale reconstruction of the sigma factor network in Escherichia coli: topology and functional states. BMC Biology. 2014;12:4. - PMC - PubMed
    1. Wong GT, Bonocora RP, Schep AN, Beeler SM, Lee Fong AJ, Shull LM, et al.. Genome-Wide Transcriptional Response to Varying RpoS Levels in Escherichia coli K-12. Journal of Bacteriology. 2017;199(7):e00755–16. - PMC - PubMed
    1. Peano C, Wolf J, Demol J, Rossi E, Petiti L, De Bellis G, et al.. Characterization of the Escherichia coli σS core regulon by Chromatin Immunoprecipitation-sequencing (ChIP-seq) analysis. Scientific Reports. 2015;5. - PMC - PubMed
    1. Schellhorn HE. Function, Evolution, and Composition of the RpoS Regulon in Escherichia coli. Frontiers in Microbiology. 2020;11:560099. - PMC - PubMed
    1. Gottesman S. Trouble is coming: Signaling pathways that regulate general stress responses in bacteria. Journal of Biological Chemistry. 2019;294(31):11685–700. doi: 10.1074/jbc.REV119.005593 - DOI - PMC - PubMed

MeSH terms