. 2024;17(6):1039-1061.
doi: 10.1016/j.jcmgh.2024.03.002. Epub 2024 Mar 11.

Endothelial Slc35a1 Deficiency Causes Loss of LSEC Identity and Exacerbates Neonatal Lipid Deposition in the Liver in Mice

Affiliations

Endothelial Slc35a1 Deficiency Causes Loss of LSEC Identity and Exacerbates Neonatal Lipid Deposition in the Liver in Mice

Bin Zuo et al. Cell Mol Gastroenterol Hepatol. 2024.

Abstract

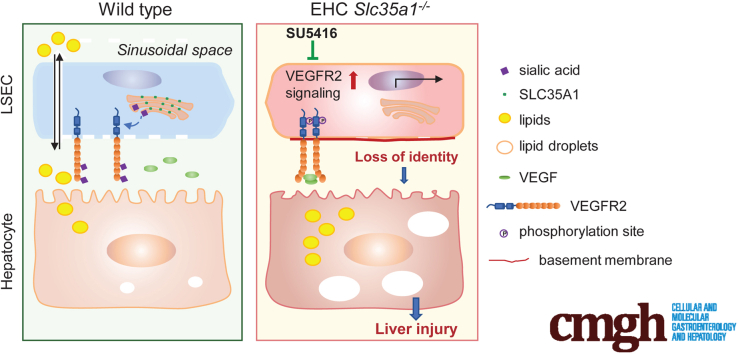
Background & aims: The functional maturation of the liver largely occurs after birth. In the early stages of life, the liver of a newborn encounters enormous high-fat metabolic stress caused by the consumption of breast milk. It is unclear how the maturing liver adapts to high lipid metabolism. Liver sinusoidal endothelial cells (LSECs) play a fundamental role in establishing liver vasculature and are decorated with many glycoproteins on their surface. The Slc35a1 gene encodes a cytidine-5'-monophosphate (CMP)-sialic acid transporter responsible for transporting CMP-sialic acids between the cytoplasm and the Golgi apparatus for protein sialylation. This study aimed to determine whether endothelial sialylation plays a role in hepatic vasculogenesis and functional maturation.

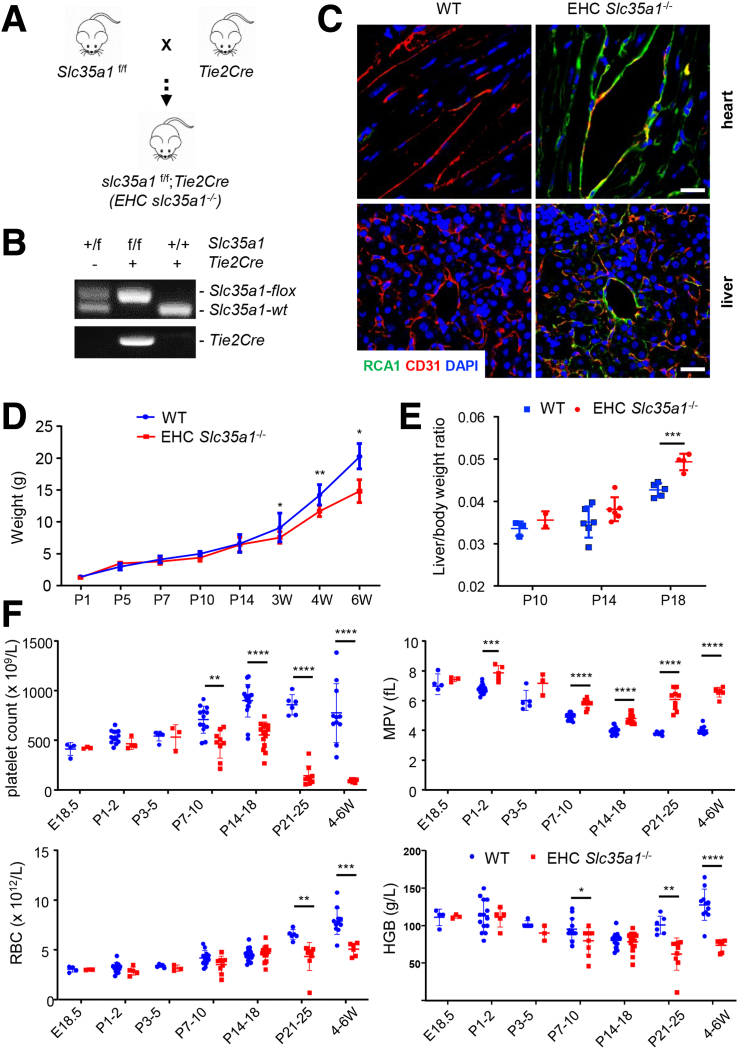
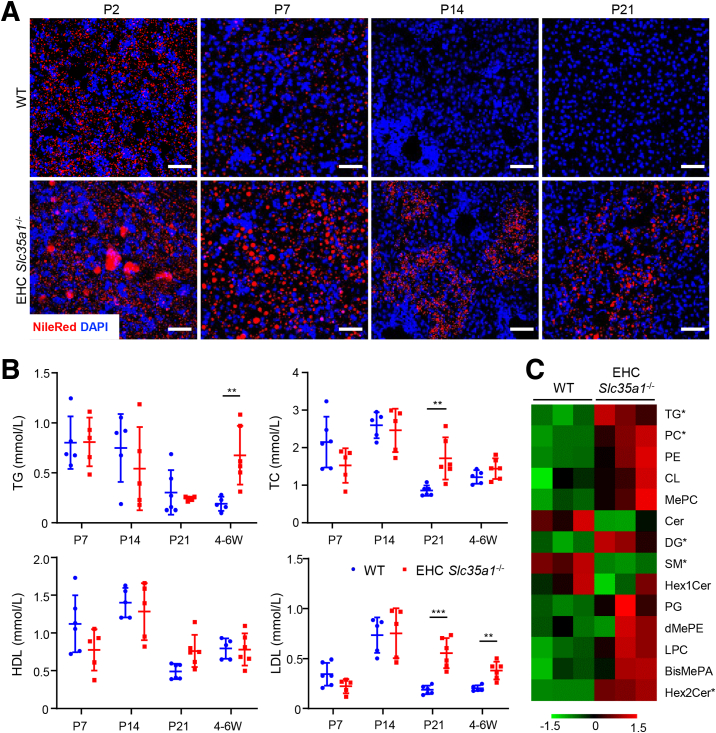
Methods: Endothelial-specific Slc35a1 knockout mice were generated. Liver tissues were collected for histologic analysis, lipidomic profiling, RNA sequencing, confocal immunofluorescence, and immunoblot analyses.

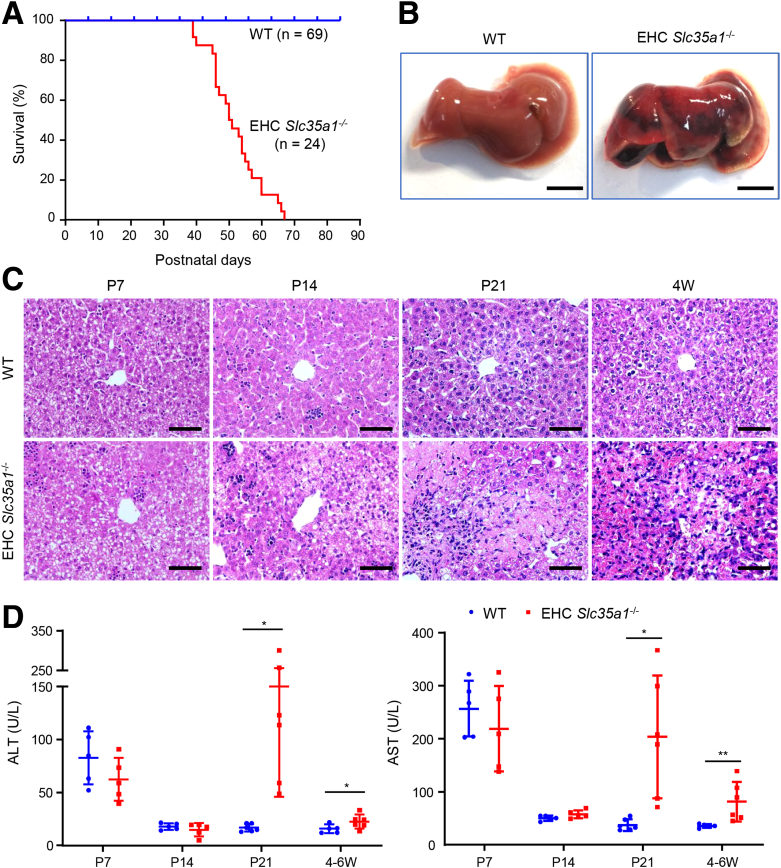
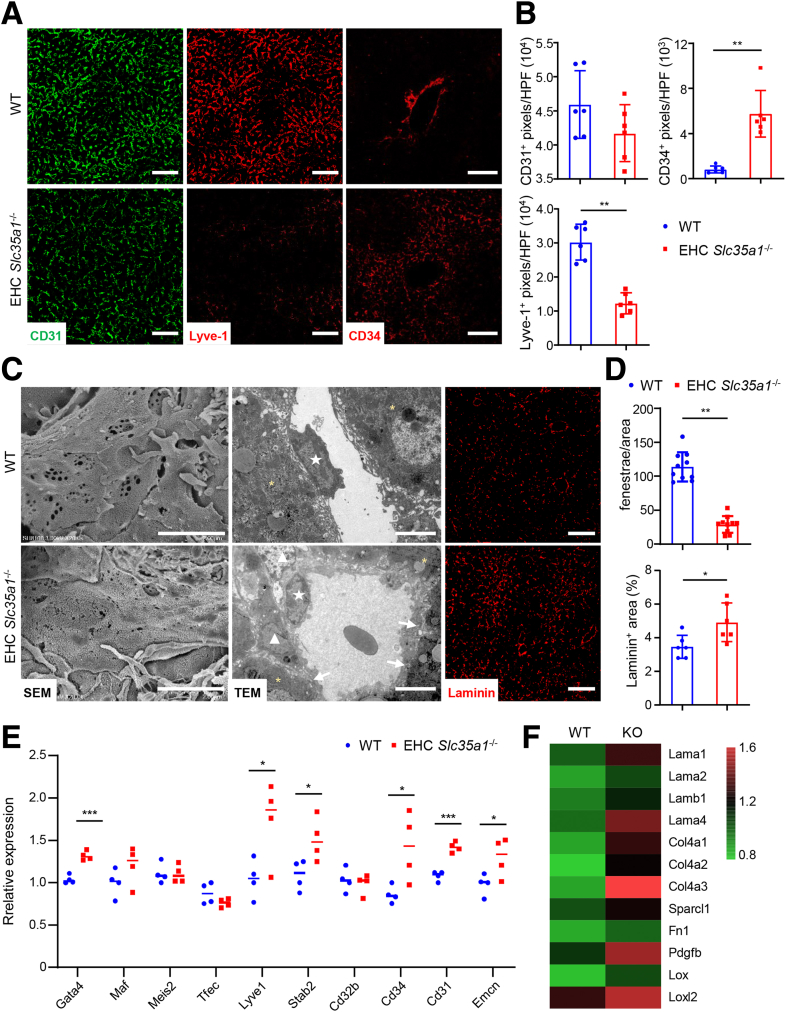
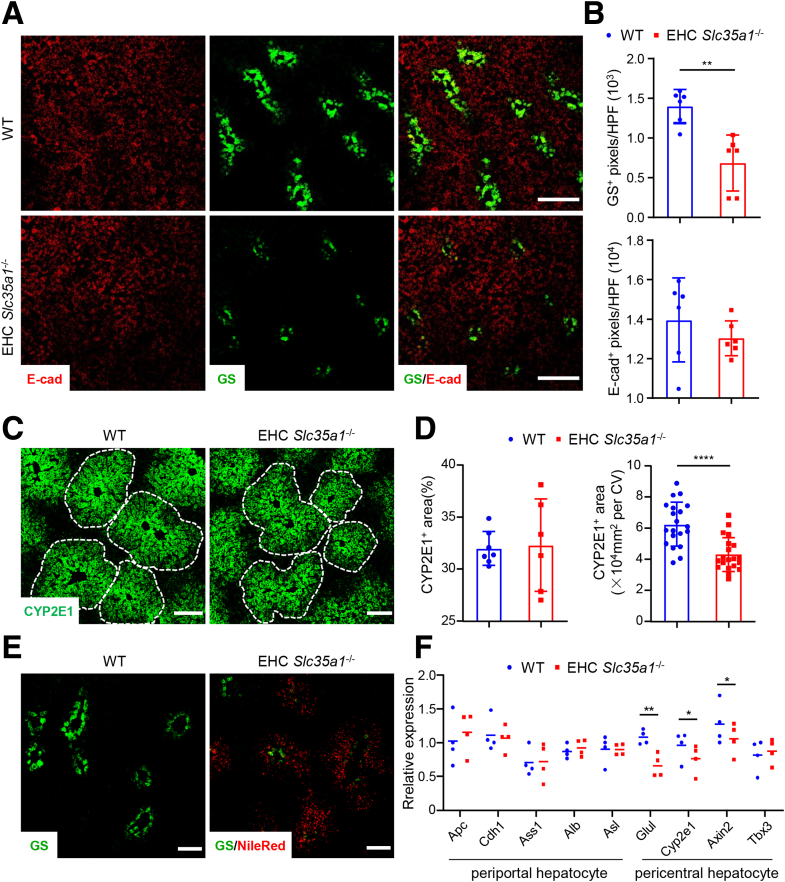
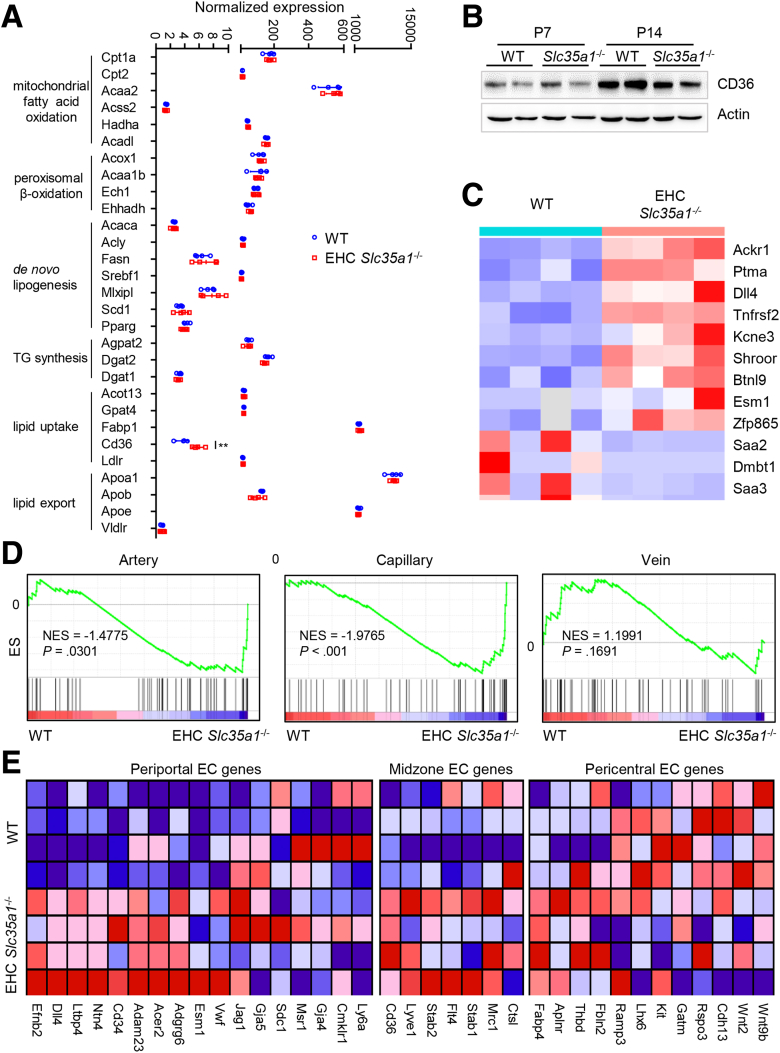
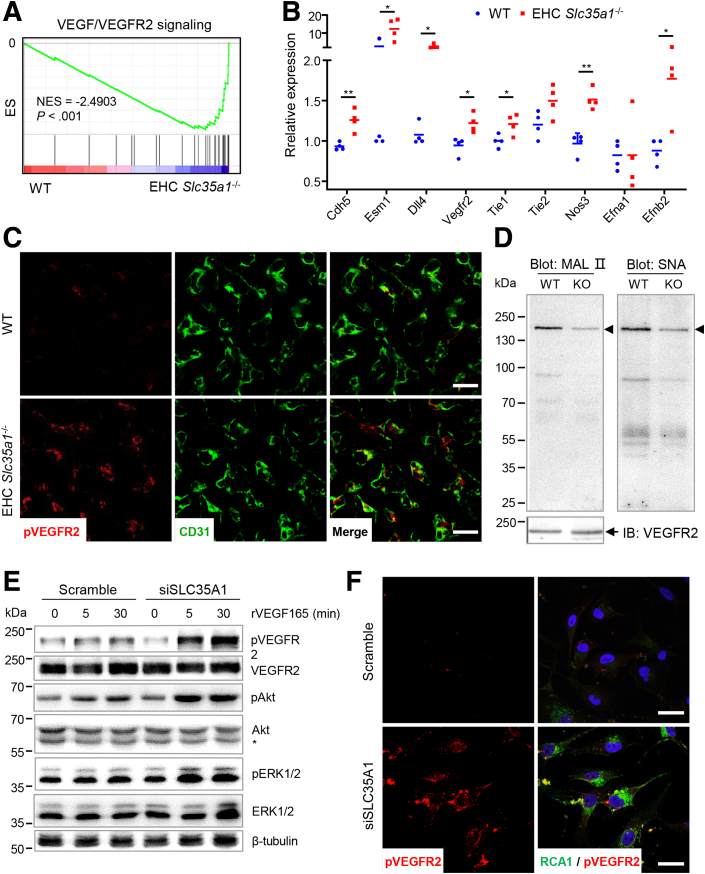
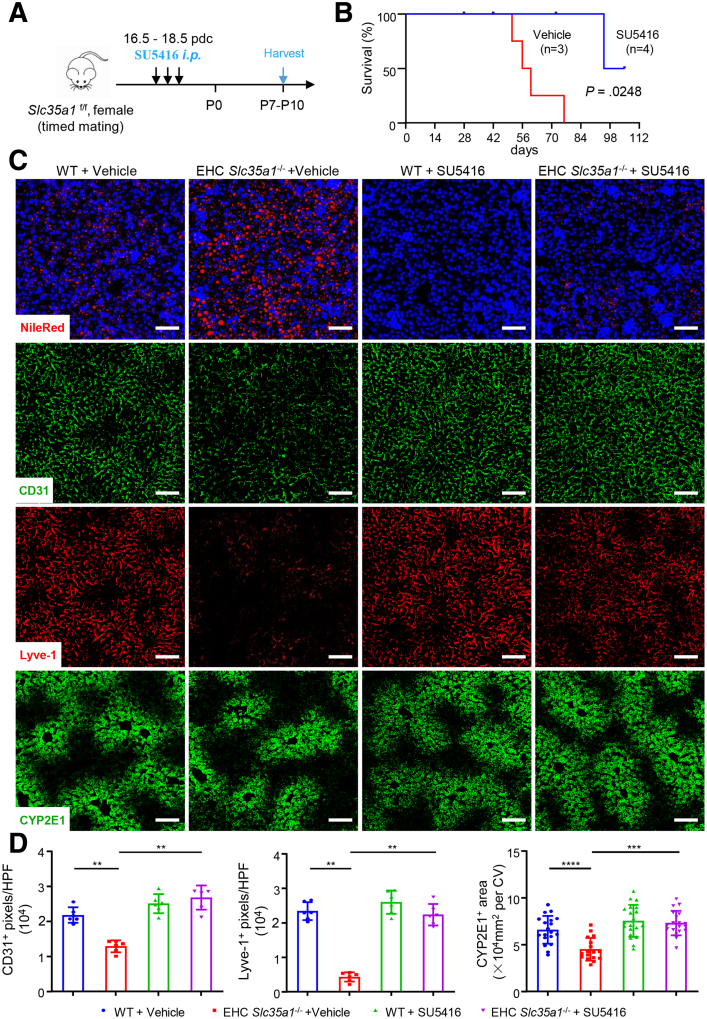
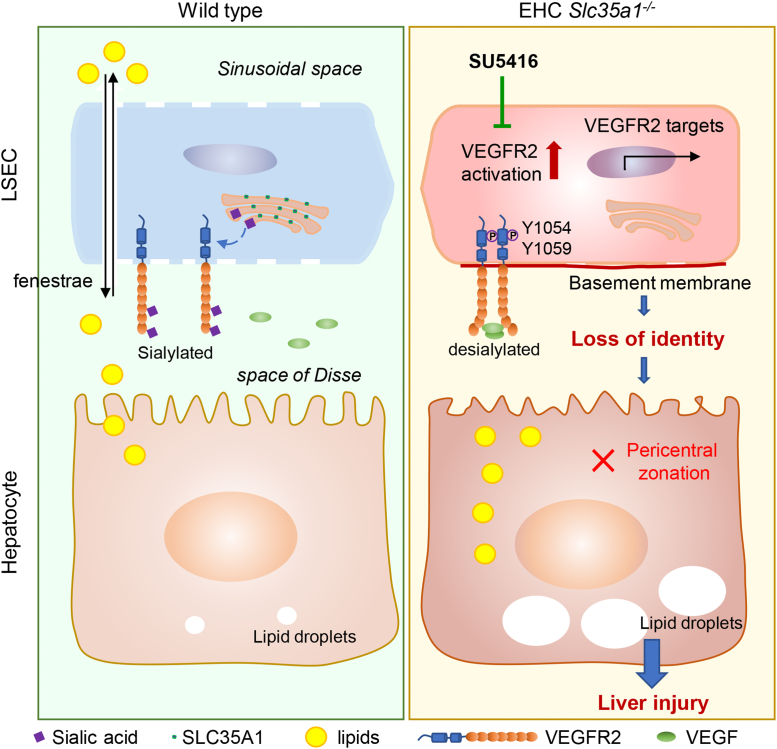
Results: Endothelial Slc35a1-deficient mice exhibited excessive neonatal hepatic lipid deposition, severe liver damage, and high mortality. Endothelial deletion of Slc35a1 led to sinusoidal capillarization and disrupted hepatic zonation. Mechanistically, vascular endothelial growth factor receptor 2 (VEGFR2) in LSECs was desialylated and VEGFR2 signaling was enhanced in Slc35a1-deficient mice. Inhibition of VEGFR2 signaling by SU5416 alleviated lipid deposition and restored hepatic vasculature in Slc35a1-deficient mice.

Conclusions: Our findings suggest that sialylation of LSECs is critical for maintaining hepatic vascular development and lipid homeostasis. Targeting VEGFR2 signaling may be a new strategy to prevent liver disorders associated with abnormal vasculature and lipid deposition.

Keywords: Lipid Deposition; Liver Injury; Liver Sinusoidal Endothelial Cell; Slc35a1; VEGFR2.


Figures

None
Graphical abstract
Figure 1
Figure 1
Deletion of Slc35a1 in endothelial/hematopoietic cells in mice. (A) Mice with specific deletion of Slc35a1 in murine EHC (Slc35a1-/-) were generated by breeding Slc35a1f/f mice with Tie2Cre transgenic mice. (B) Genotyping PCR confirms the successful generation of EHC Slc35a1-/- mice. The primers are listed in Table 1. (C) Representative immunofluorescence images showing loss of sialylation on vascular endothelial cells in heart and sinusoidal endothelial cells in liver of EHC Slc35a1-/- mice compared with WT mice. Frozen heart and liver sections from WT mice and EHC Slc35a1-/- mice at 4 weeks were analyzed using immunostaining of Ricinus communis agglutinin Ⅰ (RCAⅠ) (specific for nonreducing terminal β-galactose) and CD31. Scale bars: 20 μm. (D) Body weights of WT and EHC Slc35a1-/- mice over time with 4–11 mice per time point. (E) Liver-to–body weight ratios in EHC Slc35a1-/- mice were higher than those in WT mice at P18. Four to 6 mice per group. (F) Peripheral blood cell counts indicate that EHC Slc35a1-/- mice had thrombocytopenia and anemia. Each group had 3–11 mice. Data represent means ± SD, and ∗P < .05, ∗∗P < .01, ∗∗∗P < .001, and ∗∗∗∗P < .0001 indicate significant differences between WT and EHC Slc35a1-/- mice in D-F. DAPI, 4′,6-diamidino-2-phenylindole; HGB, hemoglobin; MPV, mean platelet volume; RBC, red blood cell; W, postnatal week.
Figure 2
Figure 2
EHC Slc35a1-/-mice exhibit high mortality and severe liver injury. (A) Postnatal survival curves of WT (n = 69) and EHC Slc35a1-/- mice (n = 24). (B) Representative gross images showing severe liver injury in an EHC Slc35a1-/- mouse compared with its WT littermate at 6 weeks of age. Scale bar: 0.5 mm. (C) Representative microscopic images of H&E-stained mouse livers at indicated ages. Scale bars: 20 μm. (D) Plasma alanine aminotransferase (ALT) and aspartate aminotransferase (AST) levels in WT (n = 5) and EHC Slc35a1-/- mice (n = 6) at indicated ages. Data represent means ± SD. Mann–Whitney U test was performed between WT and EHC Slc35a1-/- mice. ∗P < .05 and ∗∗P < .01 indicate significant differences. W, postnatal week.
Figure 3
Figure 3
Endothelial Slc35a1 deficiency exacerbates neonatal hepatic lipid droplet deposition and alters hepatic lipid metabolism. (A) Nile Red staining showed neonatal hepatic lipid deposition in WT and EHC Slc35a1-/- livers. Frozen liver sections from WT mice and EHC Slc35a1-/- mice at P2, P7, P14, and P21 were analyzed. Scale bars: 50 μm. (B) Biochemical analysis of plasma total triglyceride (TG), total cholesterol (TC), high-density lipoprotein (HDL), and low-density lipoprotein (LDL) levels in WT (n = 5 ∼ 6) and EHC Slc35a1-/- mice (n = 5 ∼ 6) at P7, P14, P21, and 4–6 weeks of age. Data represent means ± SD. ∗∗P < .01 and ∗∗∗P < .001 indicates significant differences between WT and EHC Slc35a1-/- mice by Mann–Whitney U test. (C) Lipidomic profile of livers from WT and EHC Slc35a1-/- mice at P14. ∗Significant difference of individual lipid species between WT and EHC Slc35a1-/- mice (P < .05). BisMePA, Bis-methyl phosphatidic acids; Cer, ceramide; CL, cardiolipin; DG, diglyceride; dMePE, dimethylphosphatidylethanolamine; Hex1Cer, mono-hexosylceramide; Hex2Cer, dihexosylceramide; LPC, lysophosphatidylcholine; MePC, methyl phosphatidylcholine; PC, phosphatidylcholine; PE, phosphatidylethanolamine; PG, phosphatidylglycerol; SM, sphingomyelins; W, postnatal week.
Figure 4
Figure 4
Endothelial Slc35a1 deficiency causes loss of LSEC identity. (A) Immunostaining of CD31, Lyve-1, and CD34 on P7 liver cryosections. WT mice, n = 5; EHC Slc35a1-/- mice, n = 5. (B) The levels of CD31, Lyve-1, and CD34 in LSECs in panel A were compared quantitatively. Three images per mouse were chosen randomly for analysis. ∗∗P < .01 indicates significant differences between WT and EHC Slc35a1-/- mice by Mann–Whitney U test. (C) Representative scanning electron micrographs (SEM, left), transmission electron micrographs (TEM, middle), and laminin immunostaining images (right) of livers from WT and EHC Slc35a1-/- mice at P7. Asterisks in TEM images indicate hepatocytes. White arrows indicate capillary basement membrane. Pentagram indicates liver sinusoidal endothelial cells. Triangles indicate hepatic stellate cells. Scale bars in SEM and TEM images: 2 μm and 5 μm. Scale bars in immunostaining images: 50 μm. (D) The numbers of LSEC fenestrae and the level of laminin in panel C were compared quantitatively. Three images per mouse were chosen randomly for analysis. ∗P < .05 and ∗∗P < .01 indicate significant differences between WT and EHC Slc35a1-/- mice by Mann–Whitney U test. (E) Relative mRNA levels of LSEC-specific transcription factors and endothelial cell markers in livers from WT (n = 4) and EHC Slc35a1-/- mice (n = 4) at P7 were detected by real-time quantitative PCR. Glyceraldehyde-3-phosphate dehydrogenase served as an internal control. Bars indicate median values. ∗P < .05, ∗∗P < .01, and ∗∗∗P < .001 indicate significant differences between 2 groups by Mann–Whitney U test. (F) Bulk RNA sequencing showing the levels of multiple laminin genes, collagen genes, and profibrotic genes. HPF, high-power field; KO, knockout.
Figure 5
Figure 5
Endothelial Slc35a1 deficiency disrupts hepatic zonation. (A) Immunostaining of E-cadherin (E-cad, zone 1 periportal hepatocytes) and glutaminase synthetase (GS, zone 3 pericentral hepatocytes) on frozen liver sections from WT mice and EHC Slc35a1-/- mice at P7. Scale bars: 200 μm. (B) The levels of E-cad and GS in panel A were compared quantitatively. Three images per mouse were chosen randomly for analysis. ∗∗P < .01 indicates significant differences between WT and EHC Slc35a1-/- mice by Mann–Whitney U test. (C) Immunostaining of CYP2E1 (zone 2 pericentral hepatocytes) on frozen liver sections from WT mice and EHC Slc35a1-/- mice at P7. Scale bars: 100 μm. (D) CYP2E1+ area and CYP2E1+ area per central vein (CV) in panel C were compared quantitatively. Three images per mouse were chosen randomly for analysis. ∗∗∗∗P < .0001 indicates significant differences between WT and EHC Slc35a1-/- mice by Mann–Whitney U test. (E) Nile Red staining showed lipid deposition around GS-positive hepatocytes in EHC Slc35a1-/- livers compared with WT livers. Frozen liver sections from WT mice and EHC Slc35a1-/- mice at P10 were analyzed. Scale bars: 100 μm. (F) Relative mRNA levels of hepatocyte zonation–related genes in livers from WT (n = 4) and EHC Slc35a1-/- mice (n = 4) at P7 were detected by real-time quantitative PCR. Glyceraldehyde-3-phosphate dehydrogenase served as an internal control. Bars indicate median values. ∗P < .05 and ∗∗P < .01 indicate significant differences between 2 groups by Mann–Whitney U test. HPF, high-power field.
Figure 6
Figure 6
Endothelial Slc35a1 deficiency preferentially disrupts LSEC gene signature. (A) The expression of lipid metabolism-related genes in P7 livers were analyzed with RNA-seq. WT mice, n = 4; EHC Slc35a1-/- mice, n = 4. Data represent means ± SD. ∗∗P < .01 indicates a significant difference between WT and EHC Slc35a1-/- mice. (B) Western blot of CD36 in P7 and P14 livers of WT and EHC Slc35a1-/- mice (n = 2 per group). Actin was used as a loading control. (C) Heatmap of the top 12 differentially expressed genes between WT and EHC Slc35a1-/- mice. Several previously reported LSEC-specific genes, including Ackr1, Dll4, and Esm1, were up-regulated significantly in EHC Slc35a1-/- mice (all P < .001). (D) GSEA analysis of artery, capillary, and vein-associated vascular landscape genes using RNA-seq data of P7 livers of WT (n = 4) and EHC Slc35a1-/- mice (n = 4). Normalized enrichment scores (NESs) and P values are shown. (E) Heatmaps of zonatic LSEC-specific genes in WT and EHC Slc35a1-/- livers at P7. EC, endothelial cell.
Figure 7
Figure 7
VEGFR2 signaling is enhanced in EHC Slc35a1-/-mice. (A) GSEA analysis of VEGF/VEGFR2 signaling-related genes using RNA-seq data of P7 livers of WT and EHC Slc35a1-/- mice. (B) Relative mRNA levels of VEGFR2 signaling-targeted genes in livers from WT (n = 4) and EHC Slc35a1-/- mice (n = 4) at P7 were detected by real-time quantitative PCR. Glyceraldehyde-3-phosphate dehydrogenase served as an internal control. ∗P < .05 and ∗∗P < .01 indicate significant differences between 2 groups by Mann–Whitney U test. (C) Immunostaining of phosphorylated VEGFR2 and CD31. P7 liver cryosections were collected from WT mice (n = 3) and EHC Slc35a1-/- mice (n = 3) 30 minutes after intraperitoneal injection of 500 ng rVEGF165 protein. Scale bars: 20 μm. (D) Immunoprecipitation of VEGFR2 and lectin blotting to detect desialylation of VEGFR2 in WT (left lane) and EHC Slc35a1-/- mice (right lane). VEGFR2 protein in P7 liver tissue lysates was immunoprecipitated with anti-VEGFR2 antibody and blotted with maackia amurensis lectin II (MAL II), and sambucus nigra lectin (SNA), respectively. (E) Western blot analysis of VEGFR2 activation in HUVECs transfected with Scramble or SLC35A1 siRNAs. After 24 hours of siRNA transfection, HUVECs were starved for 18 hours and stimulated with 25 ng/mL rVEGF165 protein for 5 and 30 minutes, respectively. ∗Nonspecific band in anti-Akt blotting. β-tubulin, loading control. (F) Immunostaining of phosphorylated VEGFR2 and RCAⅠ in HUVECs transfected with Scramble and SLC35A1 (siSLC35A1) siRNAs. After 24 hours of siRNA transfection, HUVECs were starved for 18 hours and stimulated with 25 ng/mL rVEGF165 protein for 5 minutes. RCAⅠ specifically binds to terminal galactose exposed after loss of the capping sialic acids. Representative figures from 3 independent expriments are shown. Scale bar: 25 μm. IB, immunoblot ; KO, knockout; pAkt, Akt phosphorylation at Ser473; pERK1/2, ERK1/2 phosphorylation at Thr202 and Tyr204; pVEGFR2, VEGFR2 phosphorylation at Tyr1054 and Tyr1059; RCAⅠ, Ricinus communis agglutinin Ⅰ lectin.
Figure 8
Figure 8
Inhibition of VEGFR2 signaling alleviates neonatal hepatic lipid deposition and restores liver homeostasis in EHC Slc35a1-/-mice. (A) Schematic of the experimental design. Pregnant Slc35a1f/f mice or WT mice as control at 16.5 days post coitum (dpc) were injected intraperitoneally with vehicle or VEGFR2 inhibitor (SU5416, 25 μg/g of body weight) daily for 3 days, and livers of the Slc35a1-/- pups and WT pups were harvested at P7–P10. (B) Survival curve showed the survival rate of EHC Slc35a1-/- mice from vehicle-treated (n = 3) and SU5416-treated dams (n = 4). (C) Nile Red staining and immunostaining of CD31, Lyve-1, and CYP2E1 in liver cryosections obtained from EHC Slc35a1-/- or WT pups born of pretreated Slc35a1f/f or WT mice, respectively. Scale bars: 100 μm. (D) CD31, Lyve-1 expression, and CYP2E1+ area in panel C were compared quantitatively. Three images per mouse were chosen randomly for analysis. ∗∗P < .01, ∗∗∗P < .001, and ∗∗∗∗P < .0001 indicate significant differences. CV, central vein; HPF, high-power field.
Figure 9
Figure 9
Schematic diagram of the mechanism by which endothelial sialylation maintains hepatic vasculature and lipid homeostasis. In WT mice, VEGFR2 activation on LSECs is tightly regulated, with little VEGF binding to sialylated VEGFR2. In EHC Slc35a1-/- mice, endothelial Slc35a1 deficiency leads to VEGFR2 desialylation on LSECs, which enhances VEGFR2 signaling and consequently causes loss of LSEC identity and disrupts hepatic zonation. These changes further exacerbate neonatal lipid deposition and lead to fatty liver and eventually liver injury. VEGFR2 inhibition at the late embryonic stage by its kinase inhibitor SU5416 restores hepatic vasculature and liver lipid homeostasis in EHC Slc35a1-/- mice.

Similar articles

Cited by

References

    1. Lewis K., Yoshimoto M., Takebe T. Fetal liver hematopoiesis: from development to delivery. Stem Cell Res Ther. 2021;12:139–145. - PMC - PubMed
    1. Soares-da-Silva F., Peixoto M., Cumano A., et al. Crosstalk between the hepatic and hematopoietic systems during embryonic development. Front Cell Dev Biol. 2020;8:612–622. - PMC - PubMed
    1. Ober E.A., Lemaigre F.P. Development of the liver: insights into organ and tissue morphogenesis. J Hepatol. 2018;68:1049–1062. - PubMed
    1. Yang L., Wang W.H., Qiu W.L., et al. A single-cell transcriptomic analysis reveals precise pathways and regulatory mechanisms underlying hepatoblast differentiation. Hepatology. 2017;66:1387–1401. - PMC - PubMed
    1. Gruppuso P.A., Sanders J.A. Regulation of liver development: implications for liver biology across the lifespan. J Mol Endocrinol. 2016;56:R115–R125. - PMC - PubMed

Substances