. 2024 Mar 22;11(3):ENEURO.0423-23.2024.
doi: 10.1523/ENEURO.0423-23.2024. Print 2024 Mar.

Acute Aromatase Inhibition Impairs Neural and Behavioral Auditory Scene Analysis in Zebra Finches

Affiliations

Acute Aromatase Inhibition Impairs Neural and Behavioral Auditory Scene Analysis in Zebra Finches

Marcela Fernández-Vargas et al. eNeuro. .

Abstract

Auditory perception can be significantly disrupted by noise. To discriminate sounds from noise, auditory scene analysis (ASA) extracts the functionally relevant sounds from acoustic input. The zebra finch communicates in noisy environments. Neurons in their secondary auditory pallial cortex (caudomedial nidopallium, NCM) can encode song from background chorus, or scenes, and this capacity may aid behavioral ASA. Furthermore, song processing is modulated by the rapid synthesis of neuroestrogens when hearing conspecific song. To examine whether neuroestrogens support neural and behavioral ASA in both sexes, we retrodialyzed fadrozole (aromatase inhibitor, FAD) and recorded in vivo awake extracellular NCM responses to songs and scenes. We found that FAD affected neural encoding of songs by decreasing responsiveness and timing reliability in inhibitory (narrow-spiking), but not in excitatory (broad-spiking) neurons. Congruently, FAD decreased neural encoding of songs in scenes for both cell types, particularly in females. Behaviorally, we trained birds using operant conditioning and tested their ability to detect songs in scenes after administering FAD orally or injected bilaterally into NCM. Oral FAD increased response bias and decreased correct rejections in females, but not in males. FAD in NCM did not affect performance. Thus, FAD in the NCM impaired neuronal ASA but that did not lead to behavioral disruption suggesting the existence of resilience or compensatory responses. Moreover, impaired performance after systemic FAD suggests involvement of other aromatase-rich networks outside the auditory pathway in ASA. This work highlights how transient estrogen synthesis disruption can modulate higher-order processing in an animal model of vocal communication.

Keywords: aromatase inhibition; auditory scene analysis; caudomedial nidopallium; extracellular recordings; operant conditioning; zebra finches.


Conflict of interest statement

The authors declare no competing financial interests.

Figures
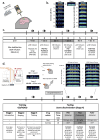
Figure 1.
Figure 1.
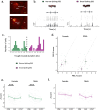
Awake in vivo extracellular recordings in NCM under acute aromatase inhibition. a, RetroDrive (multielectrode drive with 8 tetrodes coupled with a retrodialysis probe). b, Example of a song stimulus set used during playback (song without background amplified to 7 intensity levels 48–78 dB SPL, increment steps of 5 dB) and flanked by 0.25 s chorus snippets, a 63 dB chorus stimulus and 7 auditory scenes of increasing SNR (from −15 to 15 dB SPL) (dB SNR). c, Timeline of the Retrodrive experimental procedure playing back three different song stimulus sets. d, Socially reinforced operant conditioning task used to test discrimination of acoustic scenes under acute aromatase inhibition. The task used a male or female as focal bird and an opposite sex stimulus bird as reward and consisted of four stages. Stage 1: introduction of focal bird to smart glass by becoming transparent at random intervals. Stage 2: shaping of focal bird to peck the infrared (IR) sensor switch. Stage 3: training of focal bird in GO/NOGO associations using conspecific and unfamiliar male songs. Stage 4: drug administration (oral with a micropipette or injection via a bilateral cannula implanted in the NCM region) and testing discrimination of target songs (GO and NOGO) of different intensity levels (48–78 dB SPL) embedded in chorus background noise of constant level (63 dB SPL) resulting in acoustic scenes of different signal-to-noise ratios (SNRs) (aCSF, artificial cerebrospinal fluid; FAD, fadrozole; NCM, caudomedial nidopallium).
Figure 2.
Figure 2.
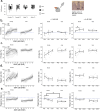
Extracellular recordings in NCM under acute aromatase inhibition. a, Sagittal sections showing recording site location of retrodrive. Retrodrive was dipped in fluorescent dye DiI before penetrating the brain. Track of tetrode wires in the NCM (female 25F31Y) (∼0.2 mm lateral from midline) and track of the microdialysis probe in the NCM (female 25F31Y) (∼0.5 mm lateral from midline). b, Representative PSTHs and waveforms of narrow spiking (NS) (18MB38G19_514) and broad spiking (BS) (17MW159P9_234) cell in response to song B (63 dB SPL) without chorus background. c, Population of NCM neurons sampled classified as NS cells (trough-to-peak durations <0.4 ms) and BS cells (trough-to-peak durations >0.4 ms). d, Mean z-scores obtained during PRE and FAD in response to 63 dB songs. Dashed line represents the “line of no change” in z-scores between PRE and FAD treatments. Values below the line of no change represent neurons with z-scores that tended to decrease after FAD retrodialysis. Values above the dashed line represent neurons that increased after FAD. e, Mean z-scores obtained in NS and f, in BS during PRE, FAD and POST and divided by sex. *p < 0.05, **p < 0.01, ***p < 0.001. aCSF, artificial cerebrospinal fluid; Cb, cerebellum; FAD, fadrozole; NCM, caudomedial nidopallium; HP, hippocampus.
Figure 3.
Figure 3.
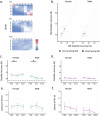
Temporal measures of evoked activity during the retrodialysis of aCSF (PRE playback), fadrozole (FAD playback) and aCSF (POST playback). a, Heat map of the confusion matrix of time-based accuracy of song classification (in response to songs of different dB SPL level without chorus background for a NS neuron (#1209, male 20MLB46W163, right) across treatments. Chance-level decoding accuracy was 14%. b, Mean Classifier Accuracy (%) across levels obtained in Narrow Spiking (NS) and Broad Spiking (BS) neurons during PRE and FAD. Dashed line represents the “line of no change” in accuracy % between PRE and FAD treatments. Values below the dashed line represent neurons with a % that tended to decrease after FAD. c, Classifier Accuracy (%) of NS cells across treatments divided by sex. d, Classifier Accuracy (%) of BS cells across treatments divided by sex. e, Latency to fire (s) of NS units with valid latency divided by sex. f, Latency to fire (s) in BS units with valid latency divided by sex. *p < 0.05, **p < 0.01, ***p < 0.001. aCSF, artificial cerebrospinal fluid; FAD, fadrozole.
Figure 4.
Figure 4.
Evoked spike trains obtained from two single NCM neurons in response to songs, scenes and chorus. Songs at different levels (highlighted in yellow), scenes at different signal-to-noise ratios (highlighted in purple) and chorus (63 dB SPL). a, A narrow spiking cell (#207, female 21F15L16L, right hemisphere) during the retrodialysis of artificial cerebrospinal fluid (aCSF) (PRE-FAD playback song A), fadrozole (FAD playback song C) and aCSF (POST-FAD playback song D). b, Broad spiking cell (#234, male 17MW159P9, right) during aCSF (PRE-FAD playback song B), fadrozole (FAD playback song D), and aCSF (POST-FAD playback song C). Top rows show spectrograms of the respective stimulus song of the set at 63 dB SPL and no background.
Figure 5.
Figure 5.
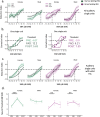
Extraction Index (EI) values obtained from NCM neurons in response to scenes of −15 to 15 dB SNR. Index values above 0 represent scenes that evoked a song-like spike train and index values less than 0 represent scenes that evoked a chorus-like spike train. a, EI for Narrow Spiking (NS) (nfemale = 14, nmale = 15) and Broad Spiking (BS) (nfemale = 15, nmale = 11) neurons during aCSF (PRE and POST) or FAD treatment. b, Two cells with a valid sigmoid fit during PRE for which a threshold was calculated to determine the signal-to-noise ratio (SNR) at which the sigmoid crosses the 0 extraction index. Higher threshold denotes a poorer ability to extract song from chorus. c, EI for single units with a valid sigmoid fit. d, Mean threshold to extract song between PRE and FAD increased in both female cell types and only in male BS neurons. *p < 0.05, **p < 0.01, ***p < 0.001. aCSF, artificial cerebrospinal fluid; FAD, fadrozole.
Figure 6.
Figure 6.
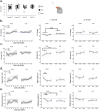
Behavioral discrimination of auditory scenes after a single daily oral administration of vehicle control (PRE), fadrozole (FAD) and control (POST). a, Female and male behavioral performance (% correct) at discriminating GO song at 63 dB SPL (no chorus background) during 2 h time window 1 (T1) and time window 2 (T2). b–e, Behavioral performance across scenes and divided by scenes of low signal-to-noise ratio (<0 dB SNR) and high SNR (≥0 dB SNR), b, % Correct ((#Hits+#Rejects)/#TrialsAll *100)), c, Hit rate ((#Hits)/#TrialsGO *100) and d, Rejection rate ((#Rejects)/#TrialsNOGO *100), e, Mean response bias (positive values indicate bias towards not responding and negative values indicate bias towards responding) *p < 0.05, **p < 0.01, ***p < 0.001.
Figure 7.
Figure 7.
Behavioral discrimination of auditory scenes after a single daily bilateral brain injection of control (PRE), fadrozole (FAD) and control (POST) into the NCM region. a, Behavioral performance (% correct) at discriminating GO song at 63 dB SPL (no chorus background) during 2 h time window 1 (T1) and window 2 (T2). b–e, Behavioral performance across scenes and divided by scenes of low SNR (<0 dB SNR) and high SNR (≥0 dB SNR) b, % Correct ((#Hits+#Rejects)/#TrialsAll *100)), c, Hit rate ((#Hits)/#TrialsGO *100), d, Rejection rate ((#Rejects)/#TrialsNOGO *100), e, Mean response bias (positive values indicate bias towards not responding and negative values indicate bias towards responding). SNR, signal-to-noise ratio; Cb, cerebellum; FAD, fadrozole; NCM, caudomedial nidopallium; HP, hippocampus. *p < 0.05, **p < 0.01, ***p < 0.001.

Similar articles

References

    1. Agate RJ, Grisham W, Wade J, Mann S, Wingfield J, Schanen C, Palotie A, Arnold AP (2003) Neural, not gonadal, origin of brain sex differences in a gynandromorphic finch. Proc Natl Acad Sci U S A 100:4873–4878. 10.1073/pnas.0636925100 - DOI - PMC - PubMed
    1. Alward BA, de Bournonville C, Chan TT, Balthazart J, Cornil CA, Ball GF (2016) Aromatase inhibition rapidly affects in a reversible manner distinct features of birdsong. Sci Rep 6:32344. 10.1038/srep32344 - DOI - PMC - PubMed
    1. Anand K, Nealen PM (2019) Differential GO and NOGO learning within an auditory discrimination task. Anim Behav Cogn 6:141–157. 10.26451/abc.06.02.05.2019 - DOI
    1. Azcoitia I, Yague JG, Garcia-Segura LM (2011) Estradiol synthesis within the human brain. Neuroscience 191:139–147. 10.1016/j.neuroscience.2011.02.012 - DOI - PubMed
    1. Benney KS, Braaten RF (2000) Auditory scene analysis in Estrildid finches (Taeniopygia guttata and Lonchura striata domestica): a species advantage for detection of conspecific song. J Comp Psychol 114:174–182. 10.1037/0735-7036.114.2.174 - DOI - PubMed

LinkOut - more resources