. 2024 Mar 11;15(1):2190.
doi: 10.1038/s41467-024-46478-3.

Silencing CA1 pyramidal cells output reveals the role of feedback inhibition in hippocampal oscillations

Affiliations

Silencing CA1 pyramidal cells output reveals the role of feedback inhibition in hippocampal oscillations

Chinnakkaruppan Adaikkan et al. Nat Commun. .

Abstract

The precise temporal coordination of neural activity is crucial for brain function. In the hippocampus, this precision is reflected in the oscillatory rhythms observed in CA1. While it is known that a balance between excitatory and inhibitory activity is necessary to generate and maintain these oscillations, the differential contribution of feedforward and feedback inhibition remains ambiguous. Here we use conditional genetics to chronically silence CA1 pyramidal cell transmission, ablating the ability of these neurons to recruit feedback inhibition in the local circuit, while recording physiological activity in mice. We find that this intervention leads to local pathophysiological events, with ripple amplitude and intrinsic frequency becoming significantly larger and spatially triggered local population spikes locked to the trough of the theta oscillation appearing during movement. These phenotypes demonstrate that feedback inhibition is crucial in maintaining local sparsity of activation and reveal the key role of lateral inhibition in CA1 in shaping circuit function.


Conflict of interest statement

The authors declare no competing interests.

Figures

Fig. 1
Fig. 1. Loss of neurotransmission leads to reduced feedback inhibition in CA1 pyramidal cells.
a Experiment outline. Cre-dependent AAV expressing mCherry (control) or TeTX.mCherry (CA1-TeTX) was bilaterally injected into CA1 region of CaMKIIα:Cre mice. b Representative images show expression of mCherry reporter, inhibitory neuronal marker GAD67, general neuronal marker NeuN and Hoechst in CA1. Arrows indicate the absence of expression of reporter mCherry in GAD67::NeuN++ cells. Scale bar = 50 μm. c Plot shows the percentage of cells co-expressing indicated markers. All cells expressing mCherry are also positive for the general neuronal marker NeuN but are not positive for GAD67 (N = 4 mice/group). d Configuration of whole cell voltage clamp recording in acute hippocampal slices prepared from CaMKIIα:Cre mice previously injected with mCherry or TeTX.mCherry virus was assessed for changes in electrical stimulus-evoked CA1 to subiculum transmission. Example evoked EPSC traces are shown. Scale bar = 100 pA, 50 ms. e Electrical stimulation evoked EPSC amplitudes plotted as a function of stimulation intensity from slices with mCherry (n = 9 cells) or TeTX.mCherry (n = 13 cells, N = 3 mice/group) expressed in CA1 (two-way RM ANOVA between groups, F (1, 119) = 52.18, P = 5.223 × 10−11). f Example images show the expression of synaptobrevin 2 (inset shows cropped image). Arrows indicate the subiculum area. g A summary plot shows the optical signal of synaptobrevin 2 in the subiculum (N = 4 mice/group; two-sided t test, T = 4.582, P = 0.0038). h Whole-cell voltage-clamp recording configuration in CA1 ex vivo brain slices. Representative spontaneous IPSC (sIPSC) traces are shown. i The cumulative fraction of sIPSC amplitude of CA1 pyramidal cells in control (N = 4 mice, n = 12 cells) and CA1-TeTX (N = 4 mice, n = 15 cells). j Mean sIPSC amplitude of CA1 pyramidal cells (N = 4 mice/group, n = 12–15 cells/group; unpaired two-sided t test, T = 1.50, P = 0.145). k The cumulative fraction of sIPSC inter-event interval frequency. l Mean frequency of sIPSC of CA1 pyramidal cells (N = 4 mice/group, n = 12–15 cells/group; unpaired two-sided t test, T = 12.83, P = 1.69 × 10−12). m Representative images show expression of mCherry reporter, GAD67, ChR2 tagged with EYFP, and Hoechst in CA1. n Recording configuration in CA1 ex vivo brain slices. A stimulus-response curve with a trendline and confidence interval shows changes in the population spike amplitude in response to varying intensities of the optogenetic stimulus (Pearson correlation, R2 = 0.7902, P = 0.0013). o Representative extracellular population spike responses from the CA1 pyramidal cell layer in response to optogenetics activation of CA1 pyramidal neurons from slices from mice co-expressing mCherry & ChR2 (control) or TeTX.mCherry & ChR2 (CA1-TeTX) (n = 5–11 slices, N = 4 mice/genotype). p Plot shows optogenetically evoked extracellular population spike amplitude (N = 4 mice/group, n = 5–11 slices/group, paired t test; control, T = 5.779, P = 0.0045; CA1-TeTX, T = 6.532, P = 6.625 × 10−5). q Paired pulse ratio in control and CA1-TeTX (N = 4 mice/group, n = 5–11 slices/group, unpaired two-sided t test, T = 6.276, P = 2.035 × 10−5). r i Schematic of a simplified CA1 neural circuitry. Inhibitory neurons (INs) in CA1 that receive input from upstream brain areas directly regulate the CA1 excitatory neurons (PCs) mediate feedforward inhibition (FFI), whereas inhibitory neurons in CA1 that receive input from CA1 PCs feedback onto CA1 PCs and regulate the activity of PCs in CA1 mediate feedback inhibition (FBI). ii Expression of TeTX in CA1 PCs impairs synaptic transmission in CA1-TeTX mice. iii Schematic shows the reduction in FBI in CA1-TeTX mice. Data shown in (e, g, j, l, p, q) represent mean ± standard error of the mean (s.e.m.). ** and **** indicate P < 0.01 and P < 0.0001, respectively. ns not significant, au arbitrary units. Source data are provided as a Source Data file.
Fig. 2
Fig. 2. Enhanced amplitude and frequency of ripples in CA1-TeTX mice.
a Recording configuration in CA1 in vivo. Cre-dependent AAV expressing mCherry or TeTX.mCherry was bilaterally injected into CA1 region of CaMKIIα::Cre mice, and mice were also implanted with microdrive. After recuperation from surgery and viral expression, mice were habituated in a recording box and electrophysiological recording was performed. b Example images show post-recording lesioned electrode tip sites (arrow) and mCherry reporter expression in CA1 from CA1-TeTX mice. c Representative LFP traces and population spikes from control and CA1-TeTX mice. d LFP power profile (mean ± s.e.m.) in control and CA1-TeTX mice (N = 5 control and 7 CA1-TeTX mice; two-way RM ANOVA, frequency x genotype interaction, F (802,8020) = 6.491, P < 0.0001). e Z-scored ripple waveforms from control (left) and CA1-TeTX (right) mice. fi Mean amplitude (f; N = 5 control and 7 CA1-TeTX mice; unpaired two-sided t test, T = 4.927, P = 0.0006), frequency (g; T = 6.727, P = 5.184 × 10−5), duration (h; T = 2.318, P = 0.042), and incidence interval (i; T = 1.137, P = 0.281) of ripples. j Mean ripples associated population spike rate (T = 3.506, P = 0.0057). Data shown in (ej) represent mean ± s.e.m. *, **, and **** indicate P < 0.05, P < 0.01, and P < 0.0001, respectively. ns= not significant. Source data are provided as a Source Data file.
Fig. 3
Fig. 3. Theta phase-locked high-frequency activity during active exploration in CA1-TeTX mice.
a Confocal images show the recording site (top, arrow; Hoechst in blue), reporter mCherry (red) expression, and interneuron marker GAD67 (green) in CA1 from control mice. b LFP theta power profile (mean ± s.e.m.) during active exploration (two-way RM ANOVA). c Example theta-filtered traces and waveforms extracted based on zero-crossings are shown. d Plots show the duration and the peak-to-peak amplitude of theta cycles in control (0.1884 mV) and CA1-TeTX mice (0.2725 mV). e Representative raw LFP trace and the corresponding amplitude scalogram from CA1-TeTX mice during linear track exploration. Bottom, 4–12 Hz theta filtered trace is superimposed on the LFP scalogram. f Histogram shows the peak frequency of high-frequency events (HFEs) detected in CA1-TeTX mice during active exploration. g Histogram shows the phase of theta at which HFEs occur in CA1-TeTX mice (N = 7 mice). The relationship between theta phase and HFEs occurrence was statistically significant (Rayleigh z test, P = 0.0021). h Plot shows the modulation index of theta phase and amplitude of HFEs (one-sample two-tailed t test, T = 4.760, P = 0.0031). Error bar shows s.e.m. Source data are provided as a Source Data file.
Fig. 4
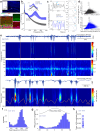
Fig. 4. Local nature of high-frequency events in CA1-TeTX mice.
a Heatmap shows HFEs in the time domain during active exploration sessions in all five tetrodes in CA1-TeTX mice. Inset cartoon shows tetrodes (tt) configuration and placement in CA1. b Plots show the peak amplitudes & frequency of HFEs and the theta-phase at which HFEs occur in all five tetrodes (corresponding tetrodes as in (a)) in CA1-TeTX mice during active exploration sessions. c Cumulative co-occurrence index of HFEs during quiescence and active exploration sessions in control and CA1-TeTX mice (N = 5 control and 7 CA1-TeTX mice; unpaired two-sided t test, T = 0.3184, P = 0.756). Inset plot shows pairwise comparison in CA1-TeTX mice (paired t test, T = 2.563, P = 0.0428). d Plots show the probability of LFP power of high-frequency during rest (left; ripples) and active exploration sessions (right; HFEs) in CA1-TeTX mice. e, f Plots show the relative phase difference (e; unpaired two-sided t test, T = 2.881, P = 0.0164) and the magnitude-squared coherence (f; unpaired two-sided t test, T = 2.632, P = 0.0251) of 100–400 Hz across all tts between control and CA1-TeTX mice (N = 5 control and 7 CA1-TeTX mice). g Plot shows the mean population spike rate during theta cycles with or without HFEs in CA1-TeTX mice. h Gaussian-smoothed autocorrelogram of population spiking (mean ± s.e.m.) in theta cycles with (purple) and without HFEs (blue) in CA1-TeTX mice. i Mean theta frequency in cycles with or without HFEs in CA1-TeTX mice. j A 20 s window from a CA1-TeTX mouse showing three simultaneously recorded LFP scalograms during linear track exploration. HFEs bursts are shown to the top (grey line). k Place map shows a rate of HFEs bursts time plotted by positional bins of the linear track. Each row corresponds to one CA1 location (tt) from a representative CA1-TeTX mouse. Data shown in (c, e, f) represent mean ± s.e.m. * indicates P < 0.05, ns not significant. Source data are provided as a Source Data file.

References

    1. Buzsáki G, Chrobak JJ. Temporal structure in spatially organized neuronal ensembles: a role for interneuronal networks. Curr. Opin. Neurobiol. 1995;5:504–510. doi: 10.1016/0959-4388(95)80012-3. - DOI - PubMed
    1. Gray CM. Synchronous oscillations in neuronal systems: mechanisms and functions. J. Comput. Neurosci. 1994;1:11–38. doi: 10.1007/BF00962716. - DOI - PubMed
    1. Sullivan D, et al. Relationships between hippocampal sharp waves, ripples, and fast gamma oscillation: influence of dentate and entorhinal cortical activity. J. Neurosci. 2011;31:8605–8616. doi: 10.1523/JNEUROSCI.0294-11.2011. - DOI - PMC - PubMed
    1. Colgin LL. Rhythms of the hippocampal network. Nat. Rev. Neurosci. 2016;17:239–249. doi: 10.1038/nrn.2016.21. - DOI - PMC - PubMed
    1. Battaglia FP, Benchenane K, Sirota A, Pennartz CMA, Wiener SI. The hippocampus: hub of brain network communication for memory. Trends Cogn. Sci. 2011;15:310–318. - PubMed

LinkOut - more resources