. 2024 Mar 11;15(1):1870.
doi: 10.1038/s41467-024-45742-w.

Ageing impairs the regenerative capacity of regulatory T cells in mouse central nervous system remyelination

Affiliations

Ageing impairs the regenerative capacity of regulatory T cells in mouse central nervous system remyelination

Alerie Guzman de la Fuente et al. Nat Commun. .

Abstract

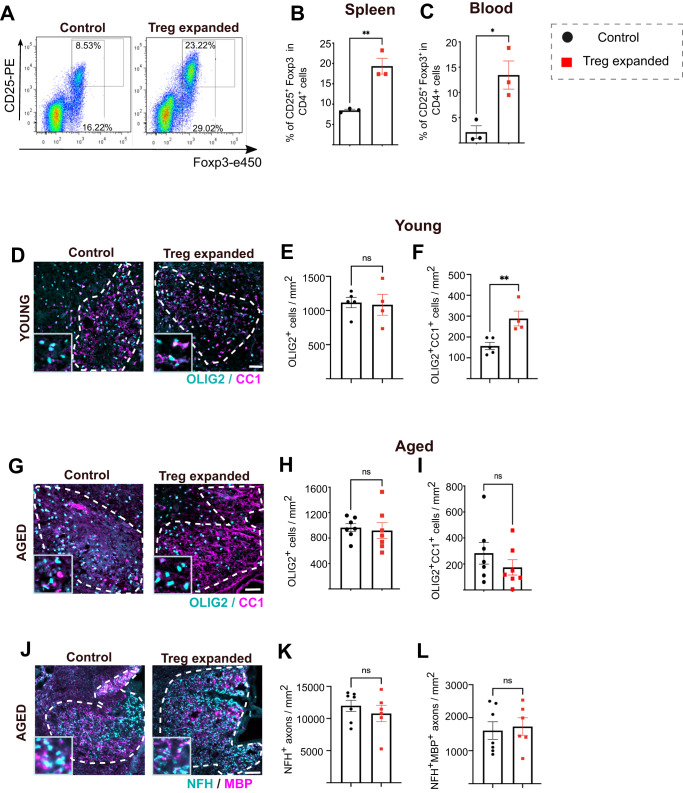
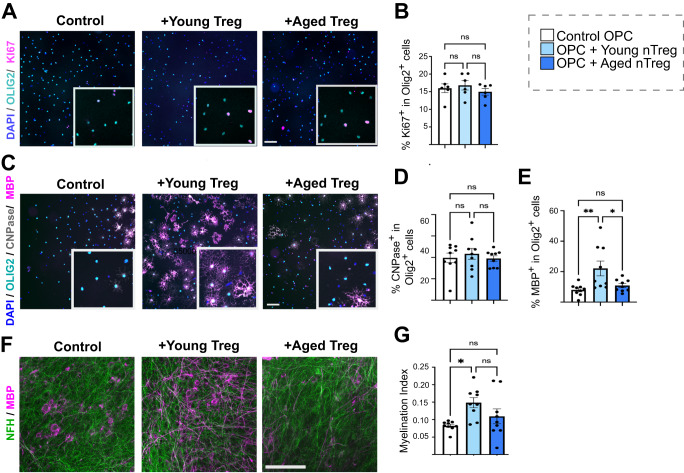
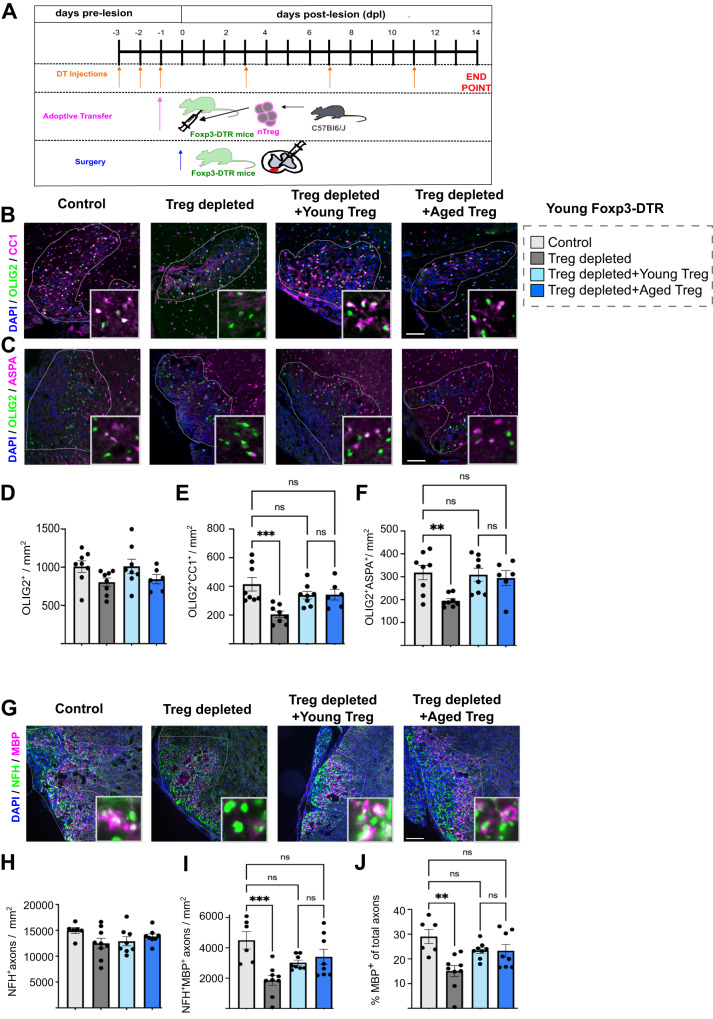
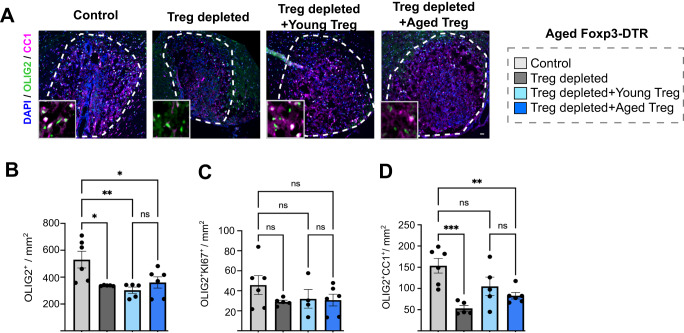
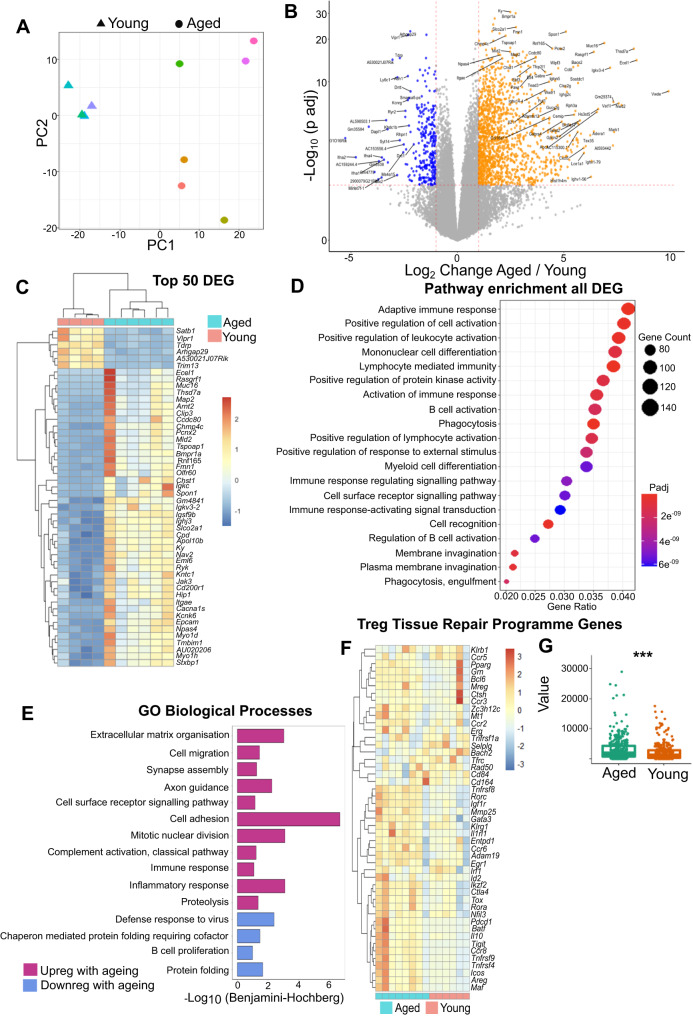
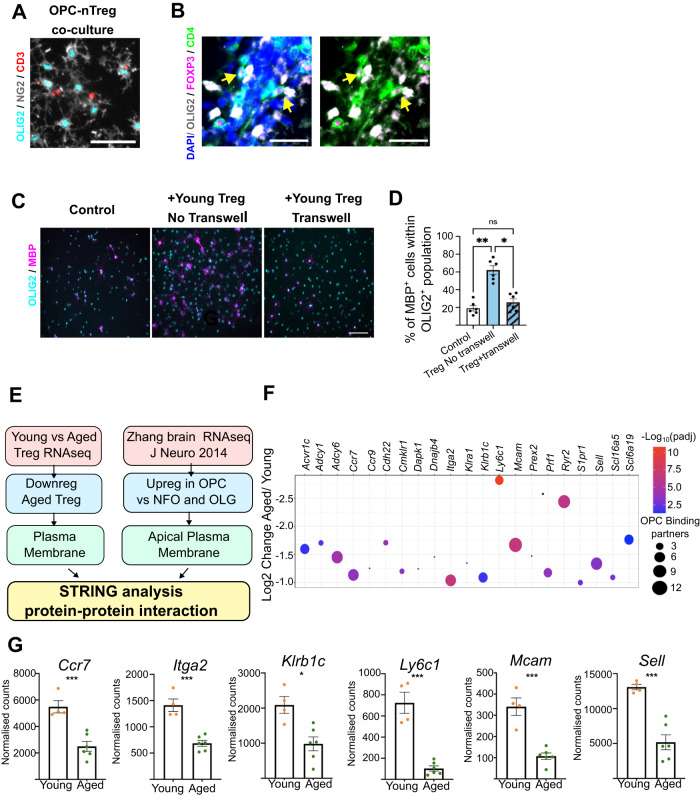
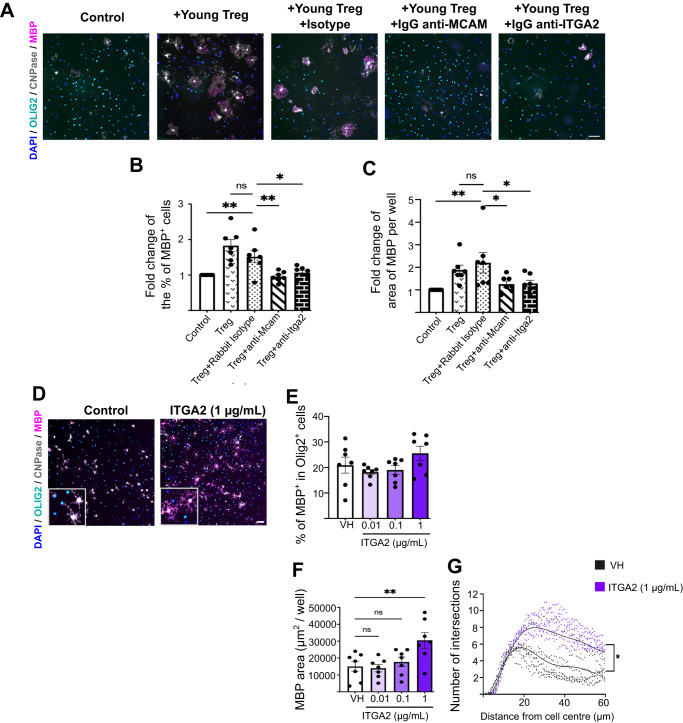
Myelin regeneration (remyelination) is essential to prevent neurodegeneration in demyelinating diseases such as Multiple Sclerosis, however, its efficiency declines with age. Regulatory T cells (Treg) recently emerged as critical players in tissue regeneration, including remyelination. However, the effect of ageing on Treg-mediated regenerative processes is poorly understood. Here, we show that expansion of aged Treg does not rescue age-associated remyelination impairment due to an intrinsically diminished capacity of aged Treg to promote oligodendrocyte differentiation and myelination in male and female mice. This decline in regenerative Treg functions can be rescued by a young environment. We identified Melanoma Cell Adhesion Molecule 1 (MCAM1) and Integrin alpha 2 (ITGA2) as candidates of Treg-mediated oligodendrocyte differentiation that decrease with age. Our findings demonstrate that ageing limits the neuroregenerative capacity of Treg, likely limiting their remyelinating therapeutic potential in aged patients, and describe two mechanisms implicated in Treg-driven remyelination that may be targetable to overcome this limitation.


Conflict of interest statement

The authors declare no competing interests.

Figures

Fig. 1
Fig. 1. Treg frequency is increased in the aged CNS.
A Flow cytometric plot and (B) quantification showing the proportions of natural Treg (endogenous GFP reporting Foxp3 expression in Foxp3-DTR mice) in blood of aged mice compared to young mice (n = 29 mice (young), n = 38 mice (aged), unpaired two-tailed Mann–Whitney U test ***P exact < 0.0001). C Flow cytometric plot and (D) quantification of Treg proportions, identified by CD4 and Foxp3 expression, in young and aged mouse spleens (n = 32 mice (young), n = 15 mice (aged), unpaired two-tailed Mann-Whitney U test *P = 0.019). E Quantification of tissue-resident Treg proportions, identified by CD69 expression (n = 8 mice (young), n = 13 mice (aged), unpaired two-tailed Student’s t test after arcsin conversion, t = 10.92, ***P < 0.0001). F Violin plot-based quantification showing proportions of Treg in spinal cords of healthy young and aged mice (n = 8 mice (young), n = 13 mice (aged), unpaired two-tailed Student’s t test after arcsin conversion, t = 3.578, **P = 0.002). G Violin plot-based quantification showing numbers of Treg present in spinal cords of young and aged healthy mice (n = 8 mice (young), n = 13 mice (aged), unpaired two-tailed Student’s t test, t = 2.716, *P = 0.0137). H Violin plot-based quantification showing proportions of tissue-resident Treg in spinal cords of healthy young and aged mice (n = 8 mice (young), n = 13 mice (aged), unpaired two-tailed Student’s t test after arcsin conversion, t = 4.603, ***P = 0.0002). I Violin plot-based quantification showing proportions of Treg in brains of healthy young and aged mice (n = 8 mice (young), n = 13 mice (aged), unpaired two-tailed Student’s t test after arcsin conversion, t = 1.725, P = 0.1). J Violin plot-based quantification showing numbers of Treg in brains of healthy young and aged mice (n = 8 mice (young), n = 13 mice (aged), unpaired two-tailed Student’s t test, t = 1.168, P = 0.25). K Violin plot-based quantification showing proportions of tissue-resident Treg in brains of healthy young and aged mice (n = 8 mice (young), n = 13 mice (aged), unpaired two-tailed Student’s t test after arcsin conversion, t = 2.947, **P = 0.0083). L Immunostaining of DAPI (blue), CD4 (green) and Foxp3 (magenta) Tregs (indicated with yellow arrows) in a demyelinated lesion from a mouse with EAE (scale bar = 50 µm). M Quantification of the density of CD4+ Foxp3+ Treg in lysolecithin-induced demyelinated lesions at 3 and 14 dpl (n = 5 mice (young 3 dpl), n = 3 mice (aged 3 dpl), n = 8 mice (14 dpl young and aged); 2-way ANOVA, Finteraction = 1.630, Fdpl = 11.49, Fage = 4.415, Sidak’s Multiple Comparison test 3dpl young vs age P = 0.1049, 14dpl young vs age P = 0.7245). N Quantification of the density of CD4+ Foxp3+ Treg in demyelinated lesions of mice with EAE at 36 days post-immunisation (n = 3 mice (young), n = 4 mice (aged), unpaired two-tailed Student’s t test, t = 1.004, P = 0.3615). Data are represented as mean ± SEM. Source data are provided as a Source Data File.
Fig. 2
Fig. 2. Expansion of Treg does not rescue impaired OPC differentiation in aged mice.
A Flow cytometric plot showing CD25 and Foxp3 expression of control aged mice and aged mice treated with intraperitoneal injection of IL-2/anti-IL-2 complexes. B Quantification of CD25+Foxp3+ natural Treg proportion in a CD4+ T cell population from the spleen control aged mice and aged mice treated with intraperitoneal injection of IL-2/anti-IL-2 complexes (n = 3, unpaired two-tailed Student’s t test after arcsin conversion, t = 5.49, **P = 0.0054). C Quantification of CD25+Foxp3+ natural Treg proportion in a CD4+ T cell population from the blood control aged mice and aged mice treated with intraperitoneal injection of IL-2/anti-IL-2 complexes (n = 3, unpaired two-tailed Student’s t test after arcsin conversion, t = 3.679, *P = 0.0212). D Representative images of OLIG2 (cyan) and CC1 (magenta) immunostaining in young control and Treg expanded demyelinated lesions at 7dpl (scale bar = 50 µm, lesion area demarcated with the dotted line). E Quantification of OLIG2+ cell density in the demyelinated area of young control and Treg expanded mice (n = 5 mice (control), n = 4 mice (Treg expanded), unpaired two-tailed Student’s t test, t = 0.2018, P = 0.8458). F Quantification of OLIG2+CC1+ cell density in the demyelinated area of young control and Treg expanded mice (n = 5 mice (young), n = 4 mice (Treg expanded), unpaired two-tailed Student’s t test, t = 3.59, **P = 0.0089). G Representative images of OLIG2 (cyan) and CC1 (magenta) immunostaining in aged control and Treg expanded demyelinated lesions at 10dpl (scale bar = 50 µm, lesion area demarcated with the dotted line). H Quantification of OLIG2+ cell density in the demyelinated area of aged control and Treg expanded mice (n = 7 mice (control and Treg expanded), unpaired two-tailed Student’s t test, t = 0.3267, P = 0.7495). I Quantification of OLIG2+CC1+ cell density in the demyelinated area of aged control and Treg expanded mice (n = 7 mice (control and Treg expanded), unpaired two-tailed Student’s t test, t = 1.07, P = 0.3055). J Representative images of NFH (cyan) and MBP (magenta) immunostaining in aged control and Treg expanded demyelinated lesions at 10dpl (scale bar = 50 µm, lesion area demarcated with the dotted line). K Quantification of NFH+ axon density in the demyelinated area of aged control and Treg expanded mice (n = 7 mice (young), n = 6 (aged), unpaired two-tailed Student’s t test, t = 0.8018, P = 0.4397). L Quantification of NFH+MBP+ axon density in the demyelinated area of aged control and Treg expanded mice (n = 7 mice (young), n = 6 (aged), unpaired two-tailed Student’s t test, t = 0.3268, P = 0.75). Data are represented as mean ± SEM. Source data are provided as a Source Data File.
Fig. 3
Fig. 3. Aged natural Treg demonstrate impaired capacity to drive OPC differentiation and myelination in vitro.
A Representative images of OPCs co-cultured with young and aged natural Treg and immunostained for OLIG2 (cyan) as a pan oligodendrocyte lineage marker and the proliferation marker Ki67 (magenta) (scale bar = 100 µm). B Quantification of OPC proliferation when co-cultured with young and aged natural Treg (n = 6 mice, 2 independent experiments, 1-way ANOVA after arcsin conversion, F = 0.4279, Pcontrol vs young = 0.9487, Pcontrol vs aged = 0.9121, Pyoung vs aged = 0.6418). C Representative images of OPCs co-cultured with young and aged natural Treg and immunostained for OLIG2 (cyan) and differentiation markers CNP (grey) and MBP (magenta) (scale bar = 100 µm). D Quantification of the proportion of OPCs reaching early stage-differentiation when exposed to young and aged natural Treg, as indicated by CNPase staining (n = 9 mice, 3 independent experiments, 1-way ANOVA after arcsin conversion, F = 0.8282, Pcontrol vs young = 0.8925, Pcontrol vs aged = 0.9995, Pyoung vs aged = 0.8439). E Quantification of the proportion of OPCs expressing late-stage differentiation marker MBP in control OPCs and OPCs treated with young and aged natural Treg (n = 9 mice, 3 independent experiments, 1-way ANOVA, Sidak’s multiple comparisons test after arcsin conversion, F = 3.87, **Pcontrol vs young = 0.0094, Pcontrol vs aged = 0.8951, *Pyoung vs aged = 0.0422). F Immunohistochemistry of control and young and aged Treg treated cerebellar slices (MBP, magenta and NFH, green, scale bar = 100 µm). G Quantification of myelination index (ratio between MBP and NFH colocalization area and NFH area) in neonatal cerebellar slices (n = 9 mice, 1 brain slice per mouse, 3 independent experiments, 1-way ANOVA after arcsin conversion, Sidak’s multiple comparison tests, F = 4.946, *Pcontrol vs young = 0.0147, Pcontrol vs aged = 0.5215, Pyoung vs aged = 0.2203). Data are represented as mean ± SEM. Source data are provided as a Source Data File.
Fig. 4
Fig. 4. Myelin-regenerative capacity of aged Treg is restored in a young environment.
A Diagram explaining the experimental design of in vivo Treg depletion, Treg adoptive transfer and spinal cord demyelination. Representative images of immunostaining identifying oligodendrocytes by the co-localisation of the pan-oligodendrocyte lineage marker OLIG2 (green) with CC1 (magenta, B) or ASPA (magenta, C) at 14 dpl (scale bar = 100 µm, demyelination area is indicated by the white line). D Bar graph showing the quantification of total number of oligodendrocyte lineage cells in the demyelinated lesions of PBS control mice (n = 8 mice), natural Treg-depleted mice (n = 8 mice) and mice depleted of endogenous Treg that received young (n = 8 mice) or aged natural Treg (n = 6 mice) by adoptive transfer (1-way ANOVA, Sidak’s multiple comparisons test, F = 2.134, PPBS vs depleted = 0.2143, PPBS vs young > 0.9999, PPBS vs aged = 0.4726, Pyoung vs aged = 0.4562). E Bar graph showing the quantification of total number of CC1-expressing oligodendrocytes in the demyelinated lesions of PBS control mice (n = 8 mice), natural Treg-depleted mice (n = 8 mice) and mice depleted of endogenous Treg that received young (n = 8 mice) or aged natural Treg (n = 6 mice) by adoptive transfer (1-way ANOVA, Sidak’s multiple comparisons test, F = 6.773, ***PPBS vs depleted = 0.0006, PPBS vs young = 0.4065, PPBS vs aged = 0.5240, Pyoung vs aged > 0.9999). F Bar graph showing the quantification of total number ASPA-expressing oligodendrocytes in the demyelinated lesions of PBS control mice (n = 8 mice), natural Treg-depleted mice (n = 8 mice) and mice depleted of endogenous Treg that received young (n = 8 mice) or aged natural Treg (n = 6 mice) by adoptive transfer (1-way ANOVA, Sidak’s multiple comparisons test, F = 4.901, **PPBS vs depleted = 0.0088, PPBS vs young = 0.9985, PPBS vs aged = 0.9597, Pyoung vs aged = 0.9933). G Representative images of immunostaining for neurofilament-H (NFH, green) and MBP (magenta) to quantify myelin wrapping as an early marker of remyelination at 14 dpl (scale bar = 100 µm, demyelination area is indicated by the white line). H Quantification shows the total number of axons in the demyelinated lesions of PBS control mice (n = 6 mice), natural Treg-depleted mice (n = 9 mice) and mice depleted of endogenous Treg that received young (n = 8 mice) or aged natural Treg (n = 8 mice) by adoptive transfer (1-way ANOVA, Sidak’s multiple comparisons test, F = 1.689, PPBS vs depleted = 0.1740, PPBS vs young = 0.3410, PPBS vs aged = 0.8304, Pyoung vs aged = 0.8793). I Quantification shows the density of MBP-wrapped axons in the demyelinated lesions of PBS control mice (n = 6 mice), natural Treg-depleted mice (n = 9 mice) and mice depleted of endogenous Treg that received young (n = 8 mice) or aged natural Treg (n = 8 mice) by adoptive transfer (1-way ANOVA, Sidak’s multiple comparisons test, F = 7.342, ***PPBS vs depleted = 0.0004, PPBS vs young = 0.0738, PPBS vs aged = 0.2766, Pyoung vs aged = 0.9273). J Quantification shows the percentage of MBP-wrapped axons from the total number of axons in the demyelinated lesions of PBS control mice (n = 6 mice), natural Treg-depleted mice (n = 9 mice) and mice depleted of endogenous Treg that received young (n = 8 mice) or aged natural Treg (n = 8 mice) by adoptive transfer (Kruskal-Wallis test, Dunn’s multiple comparisons test, Kruskal Wallis statistic = 14.16, **PPBS vs depleted = 0.0015, PPBS vs young > 0.9999, PPBS vs aged = 0.3523, Pyoung vs aged > 0.9999). Data are represented as mean ± SEM. Source data are provided as a Source Data File.
Fig. 5
Fig. 5. Young Treg only partially rescue oligodendrocyte differentiation in aged Treg-depleted mice.
A Representative images of immunostaining identifying oligodendrocytes by the co-localisation of the pan-oligodendrocyte lineage marker OLIG2 (green) with CC1 (magenta) at 14 dpl (scale bar = 100 µm, demyelination area is indicated by the white dotted line). B Bar graph shows the quantification of total number of oligodendrocyte lineage cells in the demyelinated lesions of PBS-treated control aged mice (n = 6 mice), natural Treg-depleted aged mice (n = 5 mice) and aged mice depleted of endogenous Treg that received young (n = 5 mice) or aged natural Treg (n = 6 mice) by adoptive transfer (1-way ANOVA, Sidak’s multiple comparisons test, F = 5.859, *PPBS vs depleted = 0.0199, **PPBS vs young = 0.0057, *PPBS vs aged = 0.0343, Pyoung vs aged = 0.8230). C Bar graph shows the quantification of total number of Ki67+ proliferating OPCs in the demyelinated lesions of PBS-treated control aged mice (n = 6 mice), natural Treg-depleted aged mice (n = 5 mice) and aged mice depleted of endogenous Treg that received young (n = 4 mice) or aged natural Treg (n = 6 mice) by adoptive transfer (1-way ANOVA, Sidak’s multiple comparisons test, 1.207, PPBS vs depleted = 0.3939, PPBS vs young = 0.6326, PPBS vs aged = 0.4502, Pyoung vs aged > 0.9999). D Bar graph shows the quantification of CC1+ oligodendrocytes in the demyelinated lesions of PBS-treated control aged mice (n = 6 mice), natural Treg-depleted aged mice (n = 5 mice) and aged mice depleted of endogenous Treg that received young (n = 5 mice) or aged natural Treg (n = 6 mice) by adoptive transfer (1-way ANOVA, Sidak’s multiple comparisons test, F = 8.562, ***PPBS vs depleted = 0.0005, PPBS vs young = 0.1168, **PPBS vs aged = 0.0084, Pyoung vs aged=0.7576). Data are represented as mean ± SEM. Source data are provided as a Source Data File.
Fig. 6
Fig. 6. Ageing significantly alters natural Treg transcriptome.
A Principal component analysis demonstrating the clustering differences between young and aged natural Treg. B Volcano plot demonstrating 1456 genes upregulated and 302 genes downregulated genes in aged natural Treg relative to young Treg (n = 4 mice young, n = 6 mice aged, Wald test, Bonferroni multiple test correction). C Heatmap demonstrating hierarchical clustering of the top 50 differentially expressed genes between young and aged Treg. D Graph showing the pathways enriched amongst differentially expressed genes. E Bar graph highlighting the GO biological processes associated with genes that are upregulated or downregulated in aged Treg. F Heatmap showing the normalised count values for the Treg tissue repair programme identified by Delacher et al.. G Box plot showing the Treg tissue repair programme signature genes score in aged and young natural Treg (n = 4 mice young, n = 6 mice aged, 47 genes associated to tissue repair Treg signature considered, two-tailed, unpaired Wilcoxon test, ***P = 0.00021; Data shown as box plots in which the centre line denotes the median value (50th percentile), while the box contains the 25th to 75th percentile datasets). Source data are provided as a Source Data File.
Fig. 7
Fig. 7. Natural Treg-driven OPC differentiation in vitro is contact-dependent.
A Representative image of immunostaining showing cell-to-cell contact between OPCs and Treg in OPC-Treg co-cultures in vitro. OPCs are identified by the co-staining of OLIG2 (cyan) and NG2 (grey), while Treg are identified by CD3 (red) (scale bar = 50 µm). B Representative images showing Treg (CD4+ (green), Foxp3+ (magenta)) in close proximity or direct contact with OLIG2+ oligodendrocyte lineage cells in demyelinated lesions in mice with EAE, highlighted by the yellow arrows (scale bar = 25 µm). C Representative images of immunostaining of OPCs directly co-cultured with young Treg and OPCs cultured with young Treg in a transwell (OLIG2 (cyan) and MBP (magenta), scale bar = 100 µm). D Quantification of MBP-expressing oligodendrocytes in control OPCs, OPCs directly co-cultured with young Treg and OPCs cultured with young Treg in a transwell (n = 6 mice, 2 independent experiments, Kruskal-Wallis test, Dunn’s multiple comparison’s test, KW statistic = 12.23, **Pcontrol vs Treg no transwell = 0.0022, Pcontrol vs Treg transwell > 0.9999, *PTreg no transwell vs Treg transwell = 0.0415). E Diagram summarising bioinformatic approaches to identify protein–protein interactions between OPCs and Treg. F Graph showing 21 protein candidates expressed in the Treg plasma membrane, that are downregulated in aged Treg and have potential bindings partners enriched in OPCs vs oligodendrocytes (n = 4 mice young, n = 6 mice aged, Wald test, Bonferroni multiple test correction). Log2 Change, -Log10 (Padj) and the number of OPC binding partners are indicated (see legend). G Bar graphs showing RNAseq normalised count values for the top 6 candidates (n = 4 mice young, n = 6 mice aged, Wald test, Bonferroni multiple test correction, ***PCcr7 = 0.0002, ***PItga2 < 0.00001, *PKlrb1c = 0.0215, ***PLy6c1 < 0.00001, ***PMcam < 0.00001, ***PSell = 0.0004). Data are represented as mean ± SEM. Source data are provided as a Source Data File.
Fig. 8
Fig. 8. Mcam and Itga2 contribute to Treg-driven OPC differentiation and are downregulated in aged Treg.
A Representative images of immunostaining showing OPC differentiation in co-culture with young Treg in the presence or absence of neutralising antibodies against candidate cell surface mediators (scale bar = 100 µm). B Bar graph showing the quantification of OPC differentiation measured by the fold change in percentage of MBP+ cells (n = 7 mice, 2 independent experiments, 2-way ANOVA, Dunnett’s multiple comparison tests, Fraw factor(experiment)=2.271, Praw (experiment)=0.0706, Fcolumn (treatment)=14.26, ***Pcolumn (treatment)<0.0001; **PControl vs Treg isotype = 0.0052, PTreg vs Treg isotype = 0.1164, **PTreg isotype vs Treg anti-Mcam = 0.0025, *PTreg isotype vs Treg anti-Itga2 = 0.0160). C Bar graph showing the quantification of OPC differentiation measured by the fold change in percentage MBP+ area per well (n = 7, 2-way ANOVA, Dunnett’s multiple comparison tests, Fraw factor(experiment)=3.058, *Praw (experiment)=0.0229, Fcolumn (treatment)=6.108, **Pcolumn (treatment)=0.0016; **PControl vs Treg isotype = 0.0011, PTreg vs Treg isotype = 0.6375, *PTreg isotype vs Treg anti-Mcam = 0.0102, *PTreg isotype vs Treg anti-Itga2 = 0.0128). D Representative images of immunostaining showing OPC differentiation in neonatal OPCs treated with recombinant ITGA2 (OLIG2 (cyan), CNPase (grey) and MBP (magenta), scale bar = 50 µm). E Bar graph showing quantification of the proportion of MBP-expressing oligodendrocytes in rITGA2-treated neonatal OPCs at 3 days in vitro (n = 7 mice, 2 independent experiments, Kruskal Wallis test, Dunn’s multiple comparison test, KW statistic=4.199, PVH vs 0.01µg/mL ITGA2 = 0.8079, PVH vs 0.1 µg/mL ITGA2 > 0.9999, PVH vs 1 µg/mL ITGA2 > 0.9999). F Bar graph showing quantification of MBP+ cell area per well in rITGA2-treated neonatal OPCs at 3 days in vitro n = 7 mice, 2 independent experiments, 1-way ANOVA, Dunnett’s multiple comparison test, F = 5.336, PVH vs 0.01µg/mL ITGA2 = 0.9920, PVH vs 0.1µg/mL ITGA2 = 0.8916, **PVH vs 1µg/mL ITGA2 = 0.0080. G Sholl analysis showing the number of intersections as a function of the distance from the cell body to determine changes in the morphology of MBP-expressing oligodendrocytes (n = 7 mice, 2 independent experiments, graph shows the average of 3 wells per mice and 6–9 cells per well, 2-way ANOVA, Finteraction = 7.143, ***Pinteraction < 0.0001; Fdistance = 38.42, ***Pdistance < 0.0001; Ftreatment = 8.946, *Ptreatment = 0.0113; Data shown as individual data points and a non-linear regression fitting curve). Data are represented as mean ± SEM. Source data are provided as a Source Data File.

Similar articles

Cited by

References

    1. Nave K-A, Werner HB. Ensheathment and myelination of axons: evolution of glial functions. Annu. Rev. Neurosci. 2021;44:197–219. doi: 10.1146/annurev-neuro-100120-122621. - DOI - PubMed
    1. Griffiths I, et al. Axonal swellings and degeneration in mice lacking the major proteolipid of myelin. Science. 1998;280:1610–1613. doi: 10.1126/science.280.5369.1610. - DOI - PubMed
    1. Lappe-Siefke C, et al. Disruption of Cnp1 uncouples oligodendroglial functions in axonal support and myelination. Nat. Genet. 2003;33:366–374. doi: 10.1038/ng1095. - DOI - PubMed
    1. Love S. Demyelinating diseases. J. Clin. Pathol. 2006;59:1151–1159. doi: 10.1136/jcp.2005.031195. - DOI - PMC - PubMed
    1. Bodini B, et al. Dynamic imaging of individual remyelination profiles in multiple sclerosis. Ann. Neurol. 2016;79:726–738. doi: 10.1002/ana.24620. - DOI - PMC - PubMed