. 2024 Mar 11;15(1):2203.
doi: 10.1038/s41467-024-46377-7.

Mitochondrial metabolism sustains CD8+ T cell migration for an efficient infiltration into solid tumors

Affiliations

Mitochondrial metabolism sustains CD8+ T cell migration for an efficient infiltration into solid tumors

Luca Simula et al. Nat Commun. .

Abstract

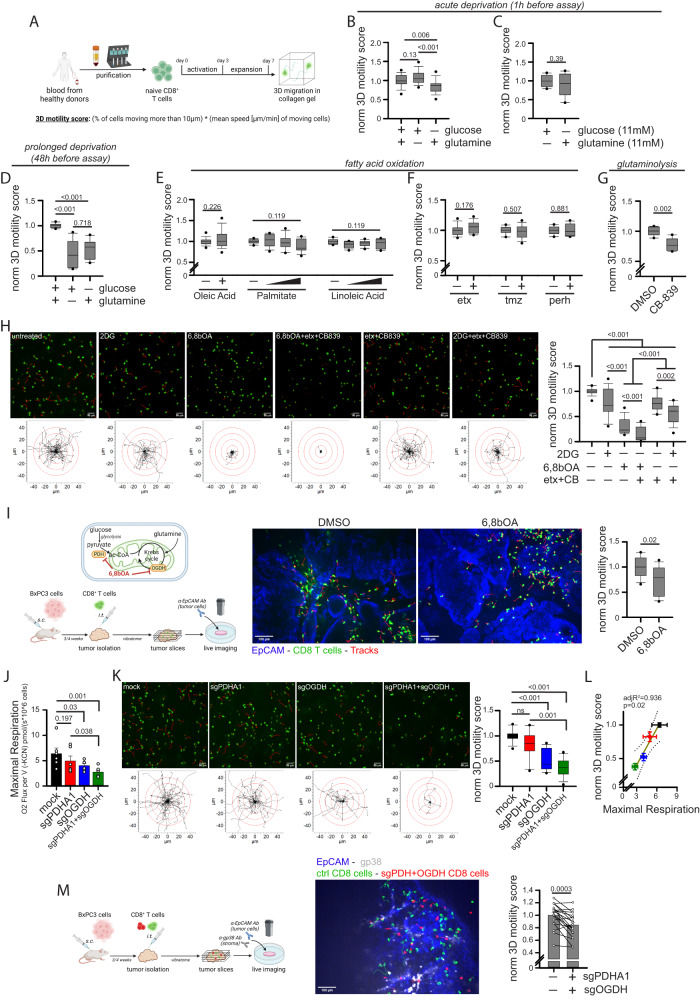
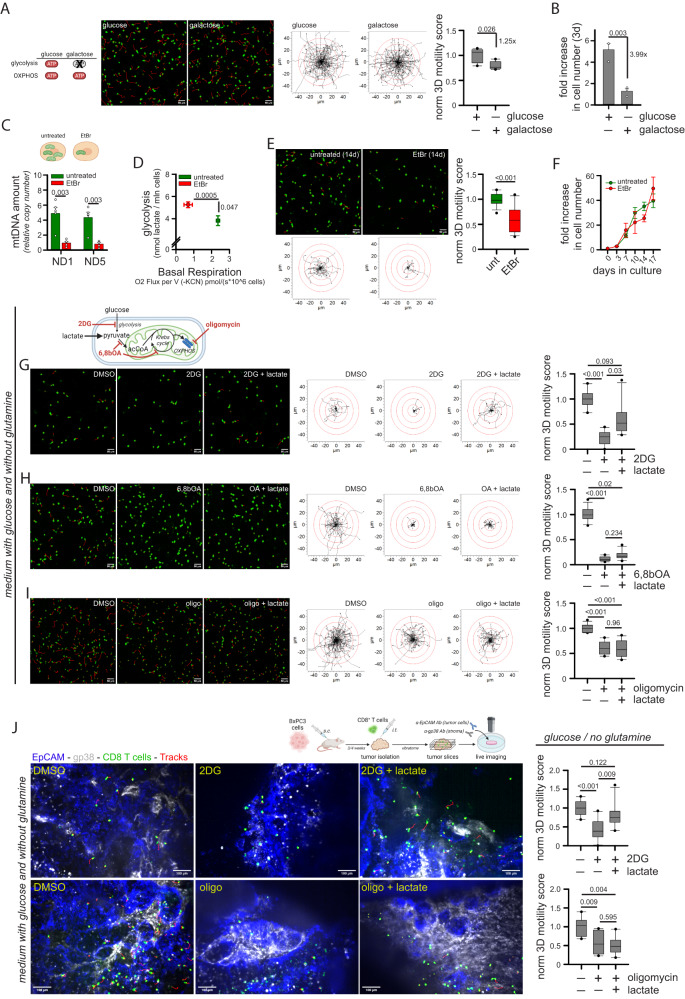
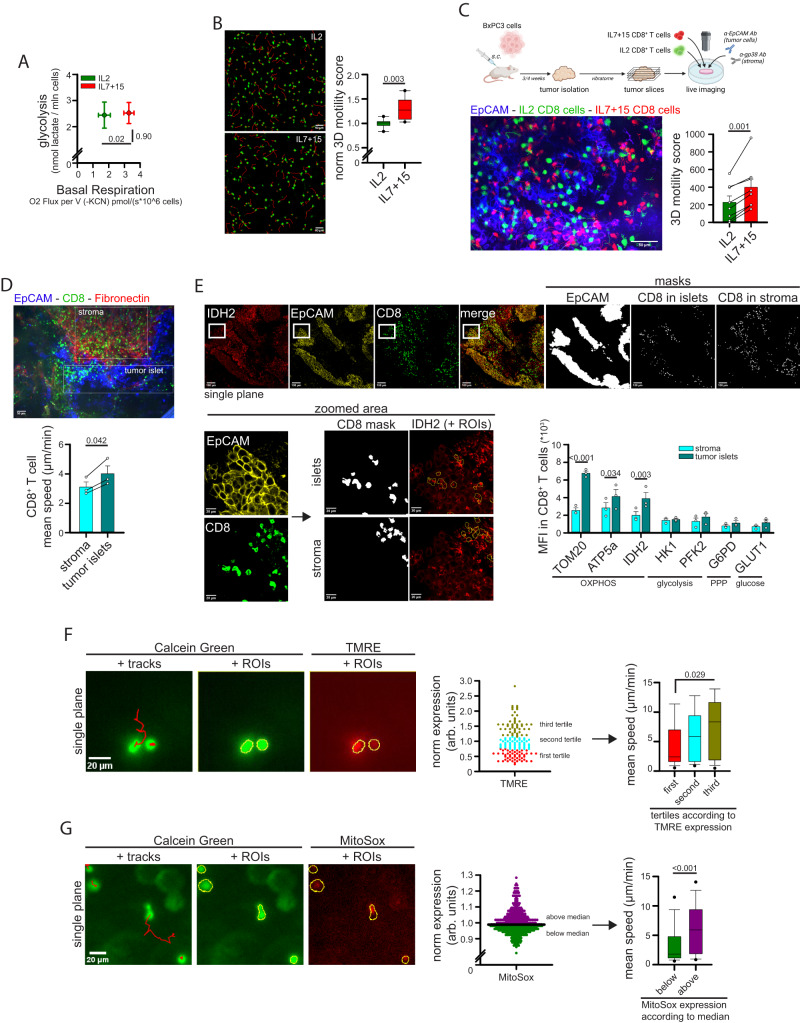
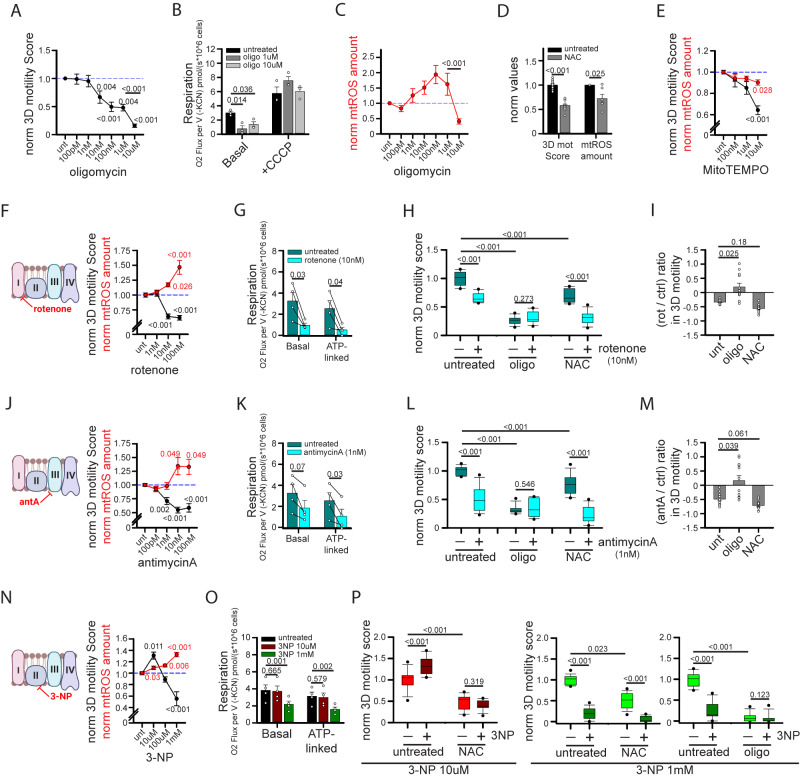
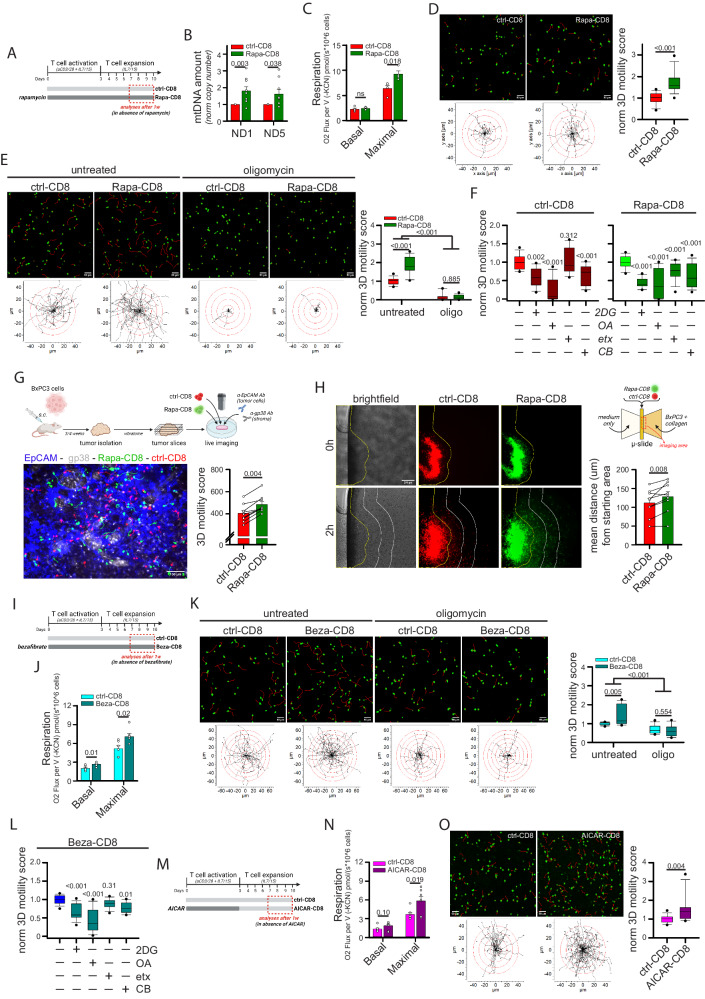
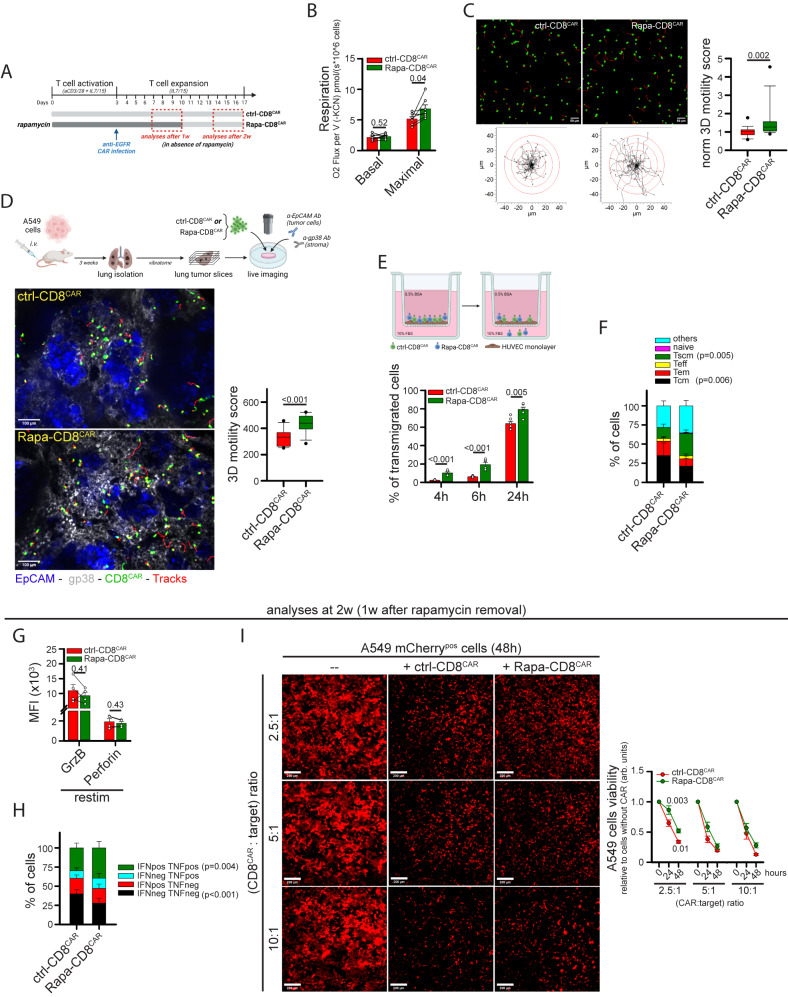
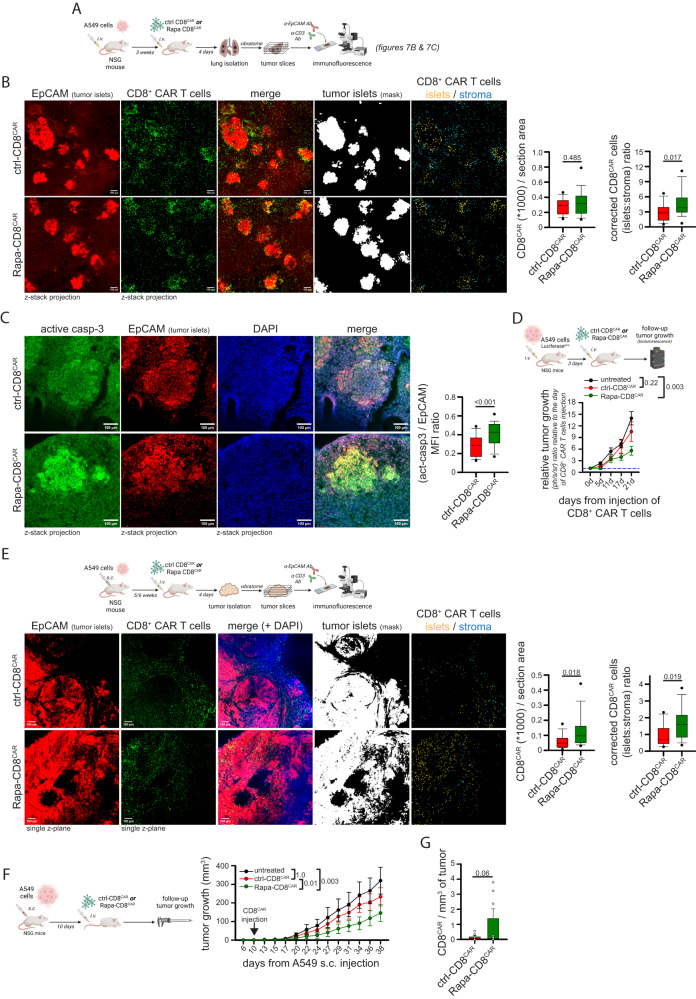
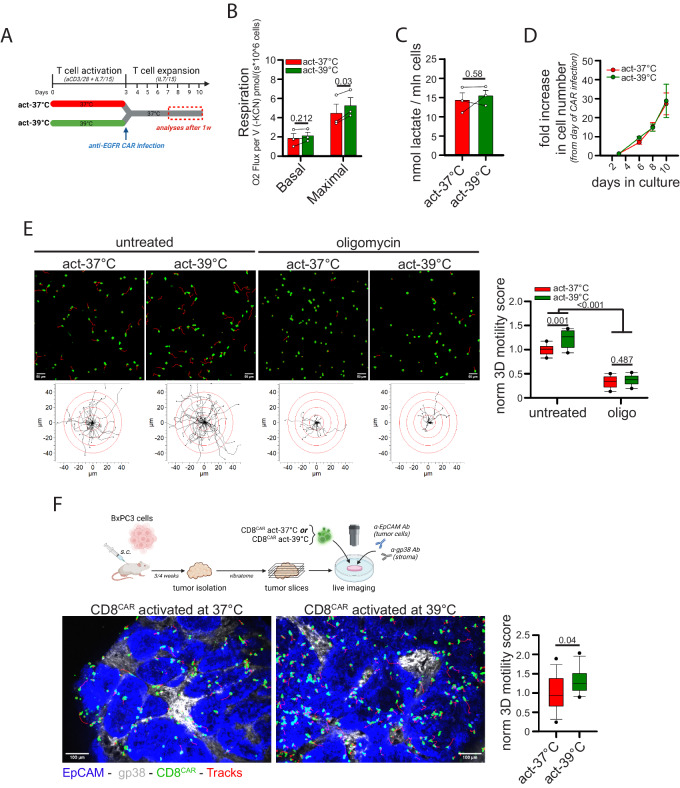
The ability of CD8+ T cells to infiltrate solid tumors and reach cancer cells is associated with improved patient survival and responses to immunotherapy. Thus, identifying the factors controlling T cell migration in tumors is critical, so that strategies to intervene on these targets can be developed. Although interstitial motility is a highly energy-demanding process, the metabolic requirements of CD8+ T cells migrating in a 3D environment remain unclear. Here, we demonstrate that the tricarboxylic acid (TCA) cycle is the main metabolic pathway sustaining human CD8+ T cell motility in 3D collagen gels and tumor slices while glycolysis plays a more minor role. Using pharmacological and genetic approaches, we report that CD8+ T cell migration depends on the mitochondrial oxidation of glucose and glutamine, but not fatty acids, and both ATP and ROS produced by mitochondria are required for T cells to migrate. Pharmacological interventions to increase mitochondrial activity improve CD8+ T cell intratumoral migration and CAR T cell recruitment into tumor islets leading to better control of tumor growth in human xenograft models. Our study highlights the rationale of targeting mitochondrial metabolism to enhance the migration and antitumor efficacy of CAR T cells in treating solid tumors.


Conflict of interest statement

The authors declare no competing interests.

Figures

Fig. 1
Fig. 1. CD8+ T cell 3D motility is mainly supported by the TCA cycle fueled by glucose and glutamine but not fatty acids.
A Experimental layout. BH Normalized 3D motility Score of activated CD8+ T cells in a motility medium (see Methods) containing no glucose or no glutamine (B, n = 27 movies, One-Way ANOVA with posthoc Holm Sidak’s), either glucose or glutamine at 11 mM (C, n = 10 movies, unpaired two-tailed Student’s T-Test), starved from glucose or glutamine since 48 h before evaluating motility (D, n = 12 movies, ANOVA on Ranks with posthoc Tukey’s; also the motility assay was performed in the absence of glucose or glutamine) or in presence of the indicated nutrients or drugs (2DG: 2-deoxy-glucose; etx: etomoxir; tmz: trimetazidine; perh: perhexiline; 6,8bOA: 6,8-bis(benzylthio)octanoic acid; CB: CB-839) (E, oleic acid n = 29 movies [unpaired Student’s T-Test], linoleic acid & palmitate n = 12 movies [ANOVA on Ranks]; F, etx n = 12 movies, tmz & perh n = 10 movies [unpaired two-tailed Student’s T-Test]; G, n = 6 movies [unpaired two-tailed Student’s T-Test]; H, n = 18 movies [ANOVA on Ranks with posthoc Student–Newman–Keuls’s]). In (H), (top) 2D z-stack reconstructions of 3D motility in collagen gel (cells in green, tracks in red) and (bottom) superimposed tracks normalized to their starting coordinates (tracks in black, red circles every 10 µm) are shown for each condition. I Experimental layout (bottom) and enzymes inhibited by 6,8bOA (top) are shown on the left. 3D motility of Calcein Green-stained activated CD8+ T cells (cells in green, tracks in red) within viable tumor slice (tumor cells in blue, EpCAM) derived from the BxPC3/NSG model and incubated with the indicated drugs (n = 12 slices, unpaired two-tailed Student’s T-Test). J, L Measurement of maximal respiration (J, n = 6 biologically independent samples, One-Way ANOVA on Repeated Measurements with posthoc Holm Sidak’s) and normalized 3D motility Score (K, n = 15 movies, ANOVA on Ranks with posthoc Tukey’s) and correlation between the two parameters (L, Linear Regression Test from mean values of (J, K), linear regression mean ± 95% confidence interval are reported in yellow and gray, respectively) in activated CD8+ T cells CRISPR/Cas9-edited for the indicated genes. M Experimental layout on the left. 3D motility of activated Calcein Green-stained control CD8+ T cells (green) and Calcein Red-stained CRISPR/Cas9-edited CD8+ T cells (sgPDH+sgOGDH) (red) within viable tumor slice (tumor cells in blue, EpCAM; stroma in gray, gp38) derived from the BxPC3/NSG model (n = 19 slices, paired Student’s T-Test). Data are expressed as mean ± SEM in (J, L, M), and as box plot (center line, median; box limits, upper and lower quartiles; whiskers, 1.5x interquartile range; points, 5th and 95th percentiles) in (BI, K). Scale bar, 50 µm in (H, K) and 100 µm in (I, M). Schemes in (A, I, M) have been created with BioRender.com.
Fig. 2
Fig. 2. Glucose fuels CD8+ T cell 3D motility mainly through the TCA cycle and poorly through glycolysis.
A, B Normalized 3D motility Score (A, n = 5 movies, unpaired two-tailed Student’s T-Test) and fold increase in cell number (B, n = 3 independent biological samples, unpaired two-tailed Student’s T-Test) of activated CD8+ T cells cultured since 72 h before motility assay in medium containing 11 mM glucose or galactose. CF Activated CD8+ T cells were cultured for at least 14d in control medium (untreated) or in the presence of a low dose of ethidium bromide (EtBr). After 14d, the following parameters were measured: mtDNA amount (C, 2-ΔCt values between mtDNA genes ND1 or ND5 and nuclear gene 18 S; n = 5 independent biological samples, paired Student’s T-Test), energy plot (D, raw measurements are reported in Fig. S2A, B, Linear Regression Test from mean values of S2A [n = 3 independent biological samples] and S2B [n = 4 independent biological samples]), normalized 3D motility Score (E, n = 15 movies, unpaired two-tailed Student’s T-Test), fold increase in cell number (F, n = 3 independent biological samples, Two-Way ANOVA). GI Normalized 3D motility Score of activated CD8+ T cells in the presence of 2-deoxy-glucose (2DG; G, n = 10 movies, ANOVA on Ranks with posthoc Tukey’s), 6,8-bis(benzylthio)octanoic acid (6,8bOA; n = 12 movies, ANOVA on Ranks with posthoc Tukey’s) and oligomycin (oligo; I, n = 12 movies, ANOVA on Ranks with posthoc Tukey’s) with or without lactate in a medium containing only glucose and no glutamine. J Experimental layout on the top. 3D motility of Calcein Green-stained activated CD8+ T cells (cells in green, tracks in red) within viable tumor slices (tumor cells in blue, EpCAM; stroma in gray, gp38) derived from the BxPC3/NSG model and incubated with the indicated drugs or nutrients (top n = 10 movies, ANOVA on Ranks with posthoc Holm Sidak’s; bottom, n = 8 movies, ANOVA on Ranks with posthoc Holm Sidak’s). Data are expressed as mean ± SEM in (B, C, D, F), and as box plot (center line, median; box limits, upper and lower quartiles; whiskers, 1.5x interquartile range; points, 5th and 95th percentiles) in (A, E, GJ). Scale bar, 50 µm in (A, E, GI) and 100 µm in (J). Schemes in (A, C, G, J) have been created with BioRender.com.
Fig. 3
Fig. 3. CD8+ T cell mitochondrial metabolism and 3D motility correlate across multiple contexts.
A, B CD8+ T cells have been activated (3d) and expanded (4d) in the presence of IL-2 or IL-7 + IL-15 (IL7 + 15). After 7 days, the energy plot (A, raw measurements are reported in Figure S3A, B, Linear Regression Test from mean values of S3A [n = 5 independent biological samples] and S3B [n = 4 independent biological samples]), and normalized 3D motility Score (B, n = 8 movies, unpaired two-tailed Student’s T-Test) were calculated. C Experimental layout on top. 3D motility of activated Calcein Green-stained IL2 CD8+ T cells (green) and Calcein Red-stained IL7 + 15 CD8+ T cells (red) overlaid onto viable tumor slices (tumor cells in blue, EpCAM) derived from the BxPC3/NSG model (n = 8 slices, paired Student’s T-Test). D 3D motility of resident CD8+ T cells (anti-CD8, green) in viable tumor slices (tumor cells in blue, EpCAM; stroma in red, fibronectin) derived from human NSCLC biopsies (n = 3 slices, paired Student’s T-Test). E Mean level of expression (MFI) of the indicated proteins calculated in CD8+ T cells located in tumor islets or stroma of NSCLC biopsies, as identified from immunofluorescent staining (see Methods for details) from n = 3 different blood donors (Two-Way ANOVA with posthoc Holm Sidak’s). Confocal images on top and bottom left. The panel shows representative images of IDH2 staining only. F, G Activated CD8+ T cells have been stained with Calcein Green (green) and TMRE (F, red) or MitoSox (G, red) and 3D motility was assessed in collagen gel. For each cell, motility was evaluated by TrackMate analysis (tracks in red) and TMRE or MitoSox MFI was calculated at the first timepoint (cells were identified as ROIs using ImageJ). Cells were then stratified according to TMRE or MitoSox expression and motility was calculated in each subgroup (graphs on the right) (F, n = 150 cells, ANOVA on Ranks with posthoc Tukey’s; G, n = 420 cells, MW Rank Sum Test). Data are expressed as mean ± SEM in (A, C, D, E), and as box plot (center line, median; box limits, upper and lower quartiles; whiskers, 1.5x interquartile range; points, 5th and 95th percentiles) in (B, F, G). Scale bar, 50 µm in (B, D), 20–100 µm in E and 20 µm in (F, G). Scheme in (C) has been created with BioRender.com.
Fig. 4
Fig. 4. Mitochondria sustain CD8+ T cell 3D motility by providing both ATP and mtROS.
AC Normalized 3D motility Score (A, n = 8 movies, ANOVA on Ranks with posthoc Student–Newman–Keuls’s), basal and CCCP-induced respiration (B, n = 3 independent biological samples, One-Way ANOVA with posthoc Holm Sidak’s) and normalized mtROS amount (MitoSox/FSC ratio; C, n = 7 independent biological samples, ANOVA on Ranks with posthoc Student–Newman–Keuls’s) of activated CD8+ T cells in the presence of the indicated doses of oligomycin. D, E Normalized 3D motility Score (D, n = 12 movies, unpaired two-tailed Student’s T-Test; E, n = 15 movies, ANOVA on Ranks with posthoc Tukey’s) and mtROS amount (MitoSox/FSC ratio; D, n = 6 independent biological samples, unpaired two-tailed Student’s T-Test; E, n = 6 independent biological samples, ANOVA on Ranks with posthoc Tukey’s) of activated CD8+ T cells in the presence of N-acetylcysteine (NAC) (in D) or MitoTEMPO (in E). FP Normalized 3D motility Score (F, n = 16 movies, ANOVA in Ranks with posthoc Dunnet’s; J, n = 16 movies, ANOVA in Ranks with posthoc Dunnet’s; N, n = 9 movies, One-Way ANOVA with posthoc Holm Sidak’s vs ctrl), mtROS amount (MitoSox/FSC ratio; F, J, n = 7 independent biological samples, ANOVA in Ranks with posthoc Dunnet’s; N, n = 6 independent biological samples, One-Way ANOVA with posthoc Holm Sidak’s vs ctrl) and basal and ATP-linked respiration (G, K, n = 4 independent biological samples, unpaired Student’s T-Test; O, n = 4 independent biological samples, One-Way ANOVA on Repeated Measurements with posthoc Holm Sidak’s) of activated CD8+ T cells in the presence of the indicated doses of rotenone (FK), antimycinA (antA) (JM) or 3-nitropropionic acid (3-NP) (NP). In (H, L, P), 3D motility was evaluated also in the presence of N-acetylcysteine (NAC) or oligomycin (oligo) (HL, n = 12 movies, Two-Way ANOVA with posthoc Holm Sidak’s; P, 3-NP 10 µM, n = 12 movies, Two-Way ANOVA with posthoc Holm Sidak’s; oligo + 3-NP 1 mM, n = 12 movies, ANOVA on Ranks with posthoc Tukey’s; NAC + 3-NP 1 mM, n = 18 movies, ANOVA on Ranks with posthoc Tukey’s) and the relative (rotenone/control) or (antimycinA/control) changes in 3D motility Score for each condition were reported in (I, M) (for both n = 12 movies, ANOVA on Ranks with posthoc Dunnet’s). Schemes on the left in (F, J, N) indicate ETC complexes inhibited by each drug. Please note that the same controls were used for data in Figs. 4G and 4K since performed in the same experiments (data were split to improve clarity of the presentation). Data are expressed as mean ± SEM in (AG, J, K, N, O), and as box plot (center line, median; box limits, upper and lower quartiles; whiskers, 1.5x interquartile range; points, 5th and 95th percentiles) in (H, I, L, M, P). Schemes in (F, J, N) have been created with BioRender.com.
Fig. 5
Fig. 5. Drugs promoting mitochondrial metabolism increase CD8+ T cell 3D motility.
AF Experimental layout in A. CD8+ T cells have been cultured in ctrl condition (ctrl-CD8) or in the presence of rapamycin (Rapa-CD8). After 1w, rapamycin was removed the day of analysis and the following parameters were measured: mtDNA amount (normalized 2-ΔCt values between mtDNA genes ND1 or ND5 and nuclear gene 18 S; B, n = 9 independent biological samples, MW Rank Sum Test), basal and maximal respiration (C, n = 4 independent biological samples, unpaired two-tailed Student’s T-Test), normalized 3D motility Score in the presence or not of oligomycin (D, n = 30 movies, MW Rank Sum Test; E, n = 15 movies, ANOVA on Ranks with posthoc Student–Newman–Keuls’s). In (F), the relative 3D motility Score is reported after normalizing to 1 the mean score for both ctrl-CD8 and Rapa-CD8 cells (2DG: 2-deoxy-glucose, 6,8bOA: 6,8-bis(benzylthio)octanoic acid; etx: etomoxir; CB: CB-839) (ctrl-CD8, n = 12 movies and Rapa-CD8, n = 15 movies, ANOVA on Ranks with posthoc Student–Newman–Keuls’s). G Experimental layout on top. 3D motility of activated Calcein Green-stained ctrl-CD8 cells (shown in red for consistency) and Calcein Red-stained Rapa-CD8 cells (shown in green for consistency) overlaid onto viable tumor slices derived from the BxPC3/NSG model (tumor cells in blue, EpCAM; stroma in gray, gp38) (n = 9 slices, Wilcoxon paired Rank Sum Test). H Infiltration of Calcein Red-stained ctrl-CD8 cells (red) and Calcein Green-stained Rapa-CD8 cells (green) into a collagen solution containing human BxPC3 tumor cells (scheme on the top right, see Methods for details). Yellow lines identify starting position of cells at 0 h. White lines represent 200 µm increments. The mean distance from starting area for the two populations is reported in the graph (n = 9 slides, paired Student’s T-Test). IL Experimental layout in (I). CD8+ T cells have been cultured in ctrl condition (ctrl-CD8) or in the presence of bezafibrate (Beza-CD8). After 1w, bezafibrate was removed and the following parameters were measured: basal and maximal respiration (J, n = 6 independent biological samples, unpaired two-tailed Student’s T-Test) and normalized 3D motility Score in the presence or not of oligomycin (K, n = 12 movies, ANOVA on Ranks with posthoc Student–Newman–Keuls’s). In (L) (n = 15 movies, ANOVA on Ranks with posthoc Dunnet’s), the relative 3D motility Score is reported after normalizing to 1 the mean score for untreated Beza-CD8 cells (as in F). MO Experimental layout in (M). Activated CD8+ T cells have been cultured in ctrl condition (ctrl-CD8) or in the presence of AICAR (AICAR-CD8). After 3d, AICAR was removed, and the cells expanded in the control condition. The following parameters were measured starting from 7d: basal and maximal respiration (N, n = 7 independent biological samples, unpaired two-tailed Student’s T-Test) and normalized 3D motility Score (O, n = 15 movies, MW Rank Sum Test). Data are expressed as mean ± SEM in (B, C, G, H, J, N), and as box plot (center line, median; box limits, upper and lower quartiles; whiskers, 1.5x interquartile range; points, 5th and 95th percentiles) in (DF, K, L, O). Scale bar, 50 µm in (D, E, K, O), 100 µm in (G) and 200 µm in (H). Schemes in (A, G, H, I, M) have been created with BioRender.com.
Fig. 6
Fig. 6. Rapamycin treatment promotes intra-tumoral motility and transmigration in anti-EGFR CD8+ CAR T cells.
A Experimental layout. Anti-EGFR CD8+ CAR T cells were cultured in a control medium (ctrl-CD8CAR) or in the presence of rapamycin (Rapa-CD8CAR). All assays were performed in the absence of rapamycin. B, C Measurements of basal and maximal respiration (B, n = 7 independent biological samples, unpaired two-tailed Student’s t-Test) and normalized 3D motility Score (C, n = 18 movies, MW Rank Sum Test). D Experimental layout on top. 3D motility of activated Calcein Green-stained ctrl-CD8CAR and Rapa-CD8CAR cells (cells in green, tracks in red) overlaid onto viable lung tumor slices (tumor islets in blue, EpCAM; stroma in gray, gp38) derived from i.v. injection of A549 lung tumor cells into NSG mice (n = 12 slices, unpaired two-tailed Student’s t-Test). E Percentage of Calcein Green-stained ctrl-CD8CAR and eFluo670-stained Rapa-CD8CAR cells (mixed in a 1:1 ratio) that transmigrated across a TNF-activated HUVEC monolayer in a transwell system (n = 6 independent biological samples, Two-Way ANOVA with posthoc Holm Sidak’s). F Relative proportion of indicated T cell subsets in ctrl-CD8CAR and Rapa-CD8CAR cells (n = 4 independent biological samples, Two-Way ANOVA on repeated Measurements with posthoc Holm Sidak’s). G, H At 2 weeks (1 week after rapamycin removal) cells were restimulated for 5 h with human TransAct + BfdA. GranzymeB (GrzB) and Perforin levels (MFI) are indicated in G (n = 4 independent biological samples, unpaired two-tailed Student’s t-test). For IFNγ and TNF, the percentage of cells producing these cytokines is indicated in (H) (n = 4 independent biological samples, Two-Way ANOVA on Repeated Measurements with posthoc Holm Sidak’s). I Cytotoxicity of ctrl-CD8CAR and Rapa-CD8CAR cells against A549 (EGFR+ mCherry+) tumor cells 1 week after rapamycin removal. A549 cell viability was evaluated by measuring mCherry fluorescence (MFI) for each microscope field at the indicated time points (n = 12 microscope fields, Two-Way ANOVA with posthoc Holm Sidak’s for 2.5:1 and 10:1 ratio; ANOVA on Ranks with posthoc Tukey’s for 5:1 ratio). Data are expressed as mean ± SEM in (B, EI), and as box plot (center line, median; box limits, upper and lower quartiles; whiskers, 1.5x interquartile range; points, 5th and 95th percentiles) in (C, D). Scale bar, 50 µm in (C), 100 µm in D and 200 µm in (I). Schemes in (A, D, E) have been created with BioRender.com.
Fig. 7
Fig. 7. Rapamycin-treated anti-EGFR CD8+ CAR T cells show enhanced infiltration and better tumor control in two different xenograft tumor models.
AC Experimental layout in (A). In (B), representative immunofluorescence images of anti-EGFR ctrl-CD8CAR or Rapa-CD8CAR cells (anti-CD3 Ab, green) distribution in tumor islets and stroma (tumor cells identified using a EpCAM Ab, red) in each microscope field (ctrl-CD8CAR, n = 17 and Rapa-CD8CAR, n = 27 microscope fields, MW Rank Sum Test). An ImageJ mask was used to identify tumor islets (EpCAMpos), stroma (EpCAMneg) and CAR T cells. Graphs on the right report the total amount of CAR T cells per section area (left) and the relative [tumor islets/stroma] CAR T cell ratio (corrected for the [tumor islets/stroma] area ratio). In (C), immunofluorescence images of lung tumor slices stained for EpCAM (red) and active-caspase-3 (green). The graph on the right shows the relative [active-caspase-3/EpCAM] ratio for each tumor islet (ctrl-CD8CAR, n = 136 and Rapa-CD8CAR, n = 102 tumor islets from different microscope fields, MW Rank Sum Test). D Experimental layout on top. Measurement of tumor size by bioluminescence (normalized to value at day of CAR T cell injection) in mice bearing lung tumors (derived from Luciferasepos A549 cells i.v. injection 3 days before) untreated or infused with ctrl-CD8CAR or Rapa-CD8CAR cells (untreated, n = 6 mice; ctrl-CD8CAR, n = 8 mice; Rapa-CD8CAR, n = 8 mice, ANOVA on Ranks with posthoc Dunn’s). E Experimental layout on top. Images and graphs were prepared as in B (ctrl-CD8CAR, n = 18 and Rapa-CD8CAR, n = 14 microscope fields, MW Rank Sum Test for graph on the left; unpaired two-tailed Student’s T-Test for graph on the right) with the exception that an anti-CD45 Ab was used to identify CAR T cells. F, G Experimental layout on the left. Measurement of tumor size in A549-derived s.c. tumor-bearing mice untreated or infused with ctrl-CD8CAR or Rapa-CD8CAR cells (F; untreated, n = 7 mice; ctrl-CD8CAR, n = 8 mice; Rapa-CD8CAR, n = 8 mice, ANOVA on ranks with posthoc Dunn’s). Amount of CD8+ CAR T cells per mg of tumor at endpoint (38 days) (G; ctrl-CD8CAR, n = 8 and Rapa-CD8CAR, n = 7 mice, unpaired two-sided Student’s T-Test). Data are expressed as mean ± SEM in (D, F, G), and as box plot (center line, median; box limits, upper and lower quartiles; whiskers, 1.5x interquartile range; points, 5th and 95th percentiles) in (B, C, E). Scale bar, 100 µm in (B, C, E). Schemes in (A) and (DF) have been created with BioRender.com.
Fig. 8
Fig. 8. CD8+ CAR T cells activated at 39 °C show higher mitochondrial respiration and better 3D intra-tumoral motility.
AE Experimental layout in A. CD8+ T cells activated at 37 °C (act-37 °C) or at 39 °C (act-39 °C) for 3d have been placed back at 37 °C, infected with lentiviral particles to generate anti-EGFR CD8+ CAR T cells, and subsequently expanded at 37 °C. After 1 week, the following parameters were measured: basal and maximal respiration (B, n = 3 independent biological samples, unpaired two-tailed Student’s T-Test), lactate production (C, n = 3, independent biological samples, unpaired two-tailed Student’s T-Test), fold increase in cell number (D, n = 3 independent biological samples, Two-Way ANOVA), and normalized 3D motility Score (E, n = 9 movies, Two-Way ANOVA with posthoc Holm Sidak’s). F Experimental layout on top. 3D motility of Calcein Green-stained act-37 °C or act-39 °C cells (cells in green, tracks in red) overlaid onto viable tumor slices derived from the BxPC3/NSG model (tumor islets in blue, EpCAM; stroma in gray, gp38) (n = 16 slices, unpaired Student’s T-Test). Data are expressed as mean ± SEM in (BD), and as box plot (center line, median; box limits, upper and lower quartiles; whiskers, 1.5x interquartile range; points, 5th and 95th percentiles) in (E, F). Scale bar, 50 µm in (E) and 100 µm in (F). Schemes in (A, F) have been created with BioRender.com.

Similar articles

Cited by

References

    1. Caruana I, Simula L, Locatelli F, Campello S. T lymphocytes against solid malignancies: winning ways to defeat tumours. Cell Stress. 2018;2:200–212. doi: 10.15698/cst2018.07.148. - DOI - PMC - PubMed
    1. Philip M, Schietinger A. CD8+ T cell differentiation and dysfunction in cancer. Nat. Rev. Immunol. 2022;22:209–223. doi: 10.1038/s41577-021-00574-3. - DOI - PMC - PubMed
    1. Raskov H, Orhan A, Christensen JP, Gögenur I. Cytotoxic CD8+ T cells in cancer and cancer immunotherapy. Br. J. Cancer. 2021;124:359–367. doi: 10.1038/s41416-020-01048-4. - DOI - PMC - PubMed
    1. Joyce JA, Fearon DT. T cell exclusion, immune privilege, and the tumor microenvironment. Science. 2015;348:74–80. doi: 10.1126/science.aaa6204. - DOI - PubMed
    1. Almagro J, Messal HA, Elosegui-Artola A, van Rheenen J, Behrens A. Tissue architecture in tumor initiation and progression. Trends Cancer. 2022;8:494–505. doi: 10.1016/j.trecan.2022.02.007. - DOI - PubMed