. 2024 Mar 11;15(3):206.
doi: 10.1038/s41419-024-06576-y.

The pancancer overexpressed NFYC Antisense 1 controls cell cycle mitotic progression through in cis and in trans modes of action

Affiliations

The pancancer overexpressed NFYC Antisense 1 controls cell cycle mitotic progression through in cis and in trans modes of action

Cecilia Pandini et al. Cell Death Dis. .

Abstract

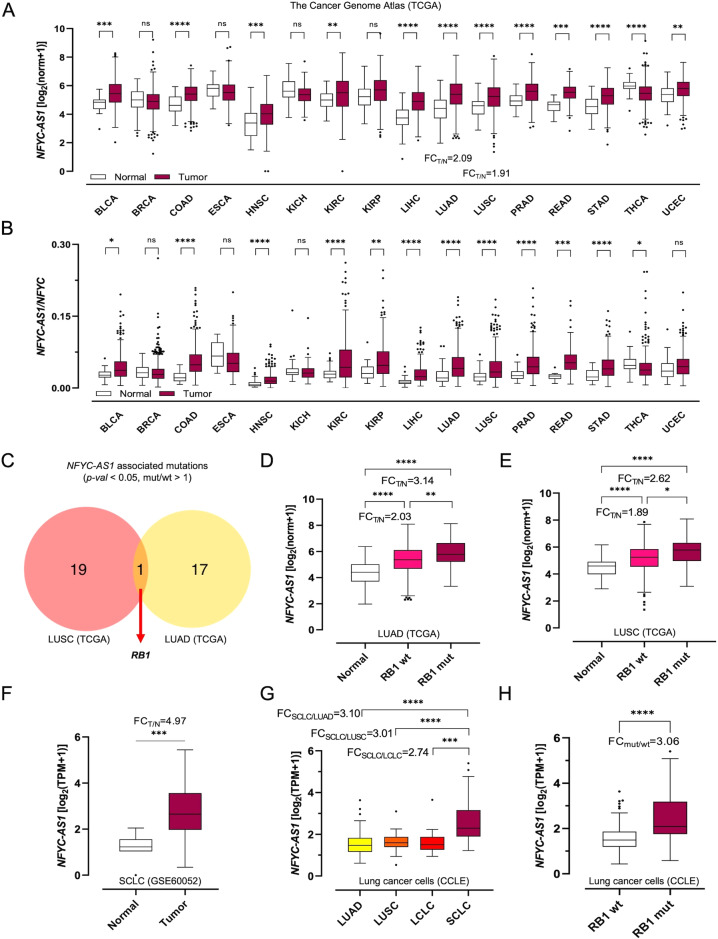
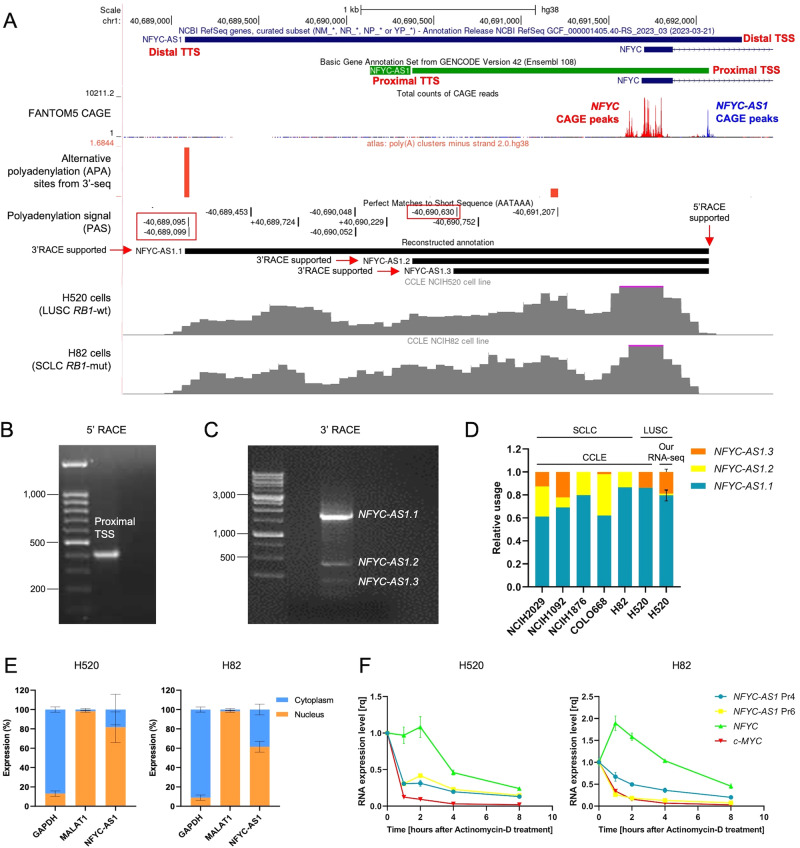
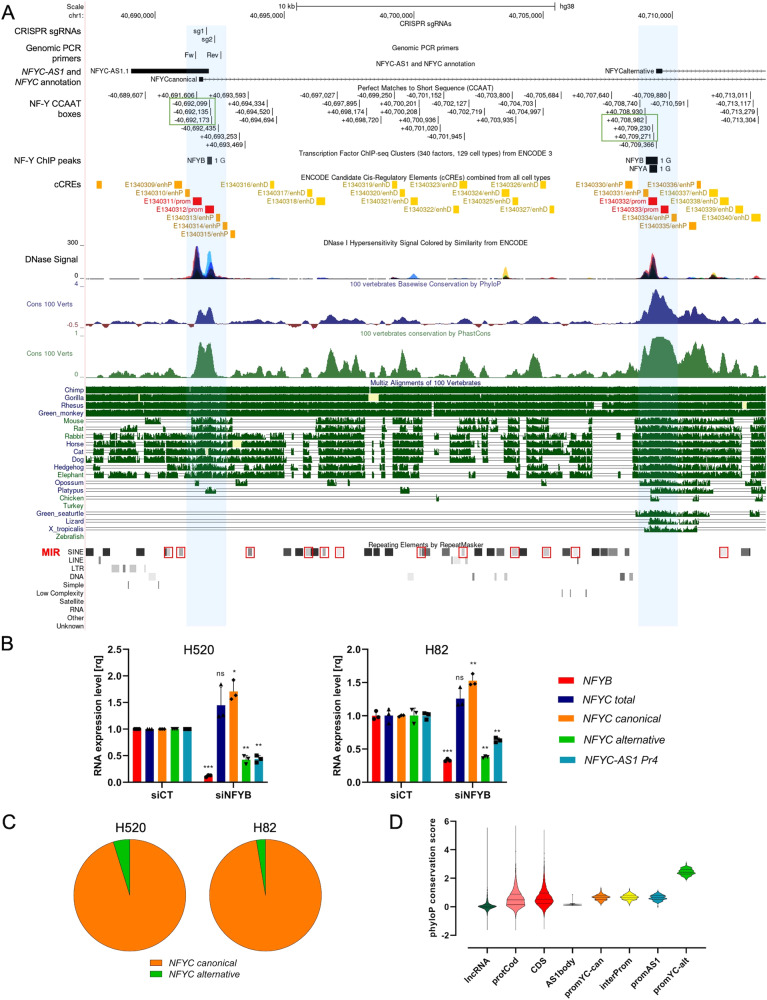
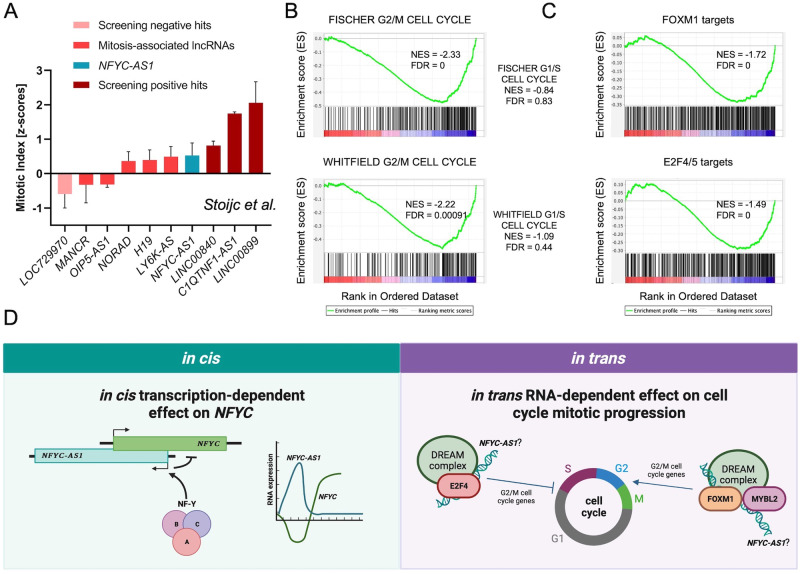
Antisense RNAs (asRNAs) represent an underappreciated yet crucial layer of gene expression regulation. Generally thought to modulate their sense genes in cis through sequence complementarity or their act of transcription, asRNAs can also regulate different molecular targets in trans, in the nucleus or in the cytoplasm. Here, we performed an in-depth molecular characterization of NFYC Antisense 1 (NFYC-AS1), the asRNA transcribed head-to-head to NFYC subunit of the proliferation-associated NF-Y transcription factor. Our results show that NFYC-AS1 is a prevalently nuclear asRNA peaking early in the cell cycle. Comparative genomics suggests a narrow phylogenetic distribution, with a probable origin in the common ancestor of mammalian lineages. NFYC-AS1 is overexpressed pancancer, preferentially in association with RB1 mutations. Knockdown of NFYC-AS1 by antisense oligonucleotides impairs cell growth in lung squamous cell carcinoma and small cell lung cancer cells, a phenotype recapitulated by CRISPR/Cas9-deletion of its transcription start site. Surprisingly, expression of the sense gene is affected only when endogenous transcription of NFYC-AS1 is manipulated. This suggests that regulation of cell proliferation is at least in part independent of the in cis transcription-mediated effect on NFYC and is possibly exerted by RNA-dependent in trans effects converging on the regulation of G2/M cell cycle phase genes. Accordingly, NFYC-AS1-depleted cells are stuck in mitosis, indicating defects in mitotic progression. Overall, NFYC-AS1 emerged as a cell cycle-regulating asRNA with dual action, holding therapeutic potential in different cancer types, including the very aggressive RB1-mutated tumors.


Conflict of interest statement

The authors declare no competing interests.

Figures

Fig. 1
Fig. 1. NFYC-AS1 expression in tumor tissues and cells.
A Boxplots of NFYC-AS1 expression and B NFYC-AS1/NFYC expression level ratios in tumor and matched control tissues (TCGA). C Venn diagram showing the intersection between the top significant mutations (sorted by p-value) associated with higher NFYC-AS1 expression level (mut/wt > 1) in LUAD and LUSC (TCGA). D Boxplots of NFYC-AS1 expression level in RB1-wild-type (RB1-wt) and RB1-mutated (RB1-mut) tumors compared to normal tissues in LUAD and E LUSC (TCGA). F Boxplots of NFYC-AS1 expression in SCLC tumors compared with normal tissues (GSE60052). G Boxplots of NFYC-AS1 expression in lung cancer CCLE cell lines according to the lung cancer histotype of origin or H the RB1 mutational status. Throughout the figure, the gene expression level is expressed as logarithm in base 2 of the normalized counts (norm) or TPM plus one [log2(norm or TPM + 1)], depending on the available data. The tumor-normal fold-change (FCT/N) is calculated as the ratio between the average normalized counts or TPM for NFYC-AS1 in tumors and in normal tissues, in SCLC and in the other lung cancer histotypes, or in presence and absence of RB1 mutation. The NFYC-AS1/NFYC ratio is calculated as the ratio between the normalized counts for NFYC-AS1 and for NFYC in individual samples and then averaged. Two-tailed unpaired t-test p-values are reported, *p < 0.05, **p < 0.01, ***p < 0.001, ****p < 0.0001, ns (non-significant).
Fig. 2
Fig. 2. NFYC-AS1 transcript reannotation and subcellular localization.
A NFYC(-AS1) locus at chr1p34.2 as from UCSC Genome Browser (GRCh38/hg38 assembly). From the top to the bottom: NCBI RefSeq and GENCODE V42 annotations are reported together with CAGE peaks (FANTOM5 project) on the minus strand for NFYC-AS1 (blue) and plus strand for NFYC (red), polyadenylation sites on the minus strand (red) (polyA site database, 3’-seq data), polyadenylation signal (PAS), our NFYC-AS1 reconstructed annotation, and BigWig profile for H520 and H82 cell lines. B Electrophoretic gel of 5’RACE PCR products. C Electrophoretic gel of 3’RACE PCR products. D Bar plot showing the relative abundance of NFYC-AS1 isoforms in different cell lines from the CCLE and in H520 cell line as from our RNA-seq. E Bar plot showing the relative percentage of NFYC-AS1 measured through qRT-PCR using primer 4 (Pr4) in the nuclear and cytoplasmic fractions of H520 and H82 cells. MALAT1 and GAPDH are used as control for the nuclear and cytoplasmic fractions, respectively. F Expression levels of NFYC-AS1, NFYC and C-MYC (qRT-PCR) in H520 and H82 cell lines, after Actinomycin-D treatment. Data are normalized to time 0 for every gene and represent the mean ± sd, as from n = 3 independent qRT-PCR measurements.
Fig. 3
Fig. 3. Analysis of NFYC-AS1 conservation and regulation by NF-Y.
A NFYC(-AS1) locus at chr1p34.2 as from UCSC Genome Browser (GRCh38/hg38 assembly). Top: CRISPR/Cas9 single guide (sg)RNAs and genomic PCR primers are shown together with the long NFYC-AS1 isoform. Middle: transcription regulatory elements, including CCAAT boxes (green rectangles), NF-Y ChIP-seq peaks (ENCODE), ENCODE candidate Cis-Regulatory Elements (cCREs), and DNase hypersensitivity tracks. Bottom: a detailed overview of conservation profiles according to the Vertebrate Multiz Alignment & Conservation (100 Species) track in the Genome Browser. Blue: phyloP conservation score. Green: PhastCons conservation score. Alignment of a manual selection of representative genome sequences for different taxa is represented at the bottom, together with the Repeating Element by RepeatMasker track; mammalian-wide interspersed repeats (MIRs) are highlighted by red rectangles. B Bar plot showing NFYB, NFYC total, NFYC canonical, NFYC alternative, and NFYC-AS1 expression levels (qRT-PCR) at 48 h after transfection with NFYB siRNA (siNFYB) in H520 RB1-wt cells and H82 RB1-mut cells. Data are siCT-normalized and reported as mean ± sd, as from n = 3 independent biological replicates. One sample t-test p-values are reported. *p < 0.05, **p < 0.01, ***p < 0.001, ****p < 0.0001, ns (non-significant). C Pie charts showing the cumulative fraction of NFYC transcripts originating from either TSS (NFYC canonical and alternative) as from RNA-seq data of H520 and H82 cells. D PhyloP conservation score at exons of lncRNAs (lncRNAs), exons of protein coding genes (protCod), protein coding exons of protein coding genes (CDS), compared with different NFYC-AS1 segments/regions and NFYC regulatory elements: AS1body, NFYC-AS1 3’ end segment not overlapped with NFYC; promYC_can, canonical NFYC isoform promoter; interProm, NFYC-AS1 segment spanning the genomic region in between NFYC canonical promoter and NFYC-AS1 promoter; promAS1, NFYC-AS1 promoter; promYC_alt, alternative NFYC isoform promoter. Promoters were defined as the genomic region spanning 250 bp upstream of annotated transcription start sites.
Fig. 4
Fig. 4. Characterization of NFYC-AS1 knockdown phenotype by Gapmer ASOs.
A Bar plot showing NFYC-AS1 expression measured through qRT-PCR using primer 4 (Pr4) and primer 6 (Pr6) at 48 h after 5 nM Gapmer transfection in H520 RB1-wt cells. Data are NEG-normalized and reported as mean ± sd as from multiple independent biological replicates (n indicated in Supplementary Table S11). B Cell counts at different timepoints after NFYC-AS1 Gapmer-knockdown, normalized against the NEG at 72 h in H520 cells. Data reported as mean ± se, as from n = 3 independent biological replicates. C Bar plot showing NFYC-AS1 and CCND1 expression levels (qRT-PCR) in H520 cells seeded at different cell densities, normalized against the lowest confluency. Data reported as mean ± sd, as from n = 3 independent biological replicates. Jonckheere-Terpstra test p-values are shown. D Heatmap reporting NES (FDR < 0.10 for all three Gapmers) of cancer hallmarks (GSEA) for genes differentially expressed in Gapmer-transfected H520 cells (allGap = all Gapmers vs NEG). E Heatmap reporting NES (FDR < 0.10) of cancer hallmarks (GSEA) for genes ranked for correlation with NFYC-AS1 in LUSC cells (CCLE). F GSEA plots of genes related to lung cancer vulnerabilities [34] or G synthetic lethal in RB1-mut cells [35] in genes modulated upon NFYC-AS1 Gapmer-silencing. H Bar plot showing NFYC-AS1 expression (qRT-PCR) at 48 h after 25 nM Gapmer transfection in H82 RB1-mut cells. Data are NEG-normalized and reported as mean ± sd, as from n = 4 independent biological replicates. I Cell counts at different time points after NFYC-AS1 Gapmer-knockdown, normalized against NEG at 72 h in H82 cells. Data reported as mean ± se, as from n = 6 independent biological replicates. J Progression-free survival curve stratified according to Cutoff Finder-determined threshold (63.72) for NFYC-AS1 in LUSC patients (TCGA). Log-rank test p-value and hazard risk (HR) are shown. *p < 0.05, **p < 0.01, ***p < 0.001, ****p < 0.0001, ns (non-significant). One sample t-test p-values are reported for panels A, B, H, and I.
Fig. 5
Fig. 5. Characterization of NFYC-AS1 knockout phenotype by CRISPR/Cas9 editing.
A Schematic representation of the CRISPR/Cas9 strategy employed for NFYC-AS1 TSS deletion (primers used to check for the deletion are shown in Fig. 3A and PCR results in Supplementary Fig. S5A). B Bar plot showing NFYC-AS1 expression measured through qRT-PCR using primer 4 (Pr4) in four non-deleted (WT) and six deleted (ΔTSS) H520 clones. Data are reported as mean ± se, as from n = 3 independent qRT-PCR measurements. Clones subjected to RNA-seq (chosen among those having the most significant down-regulation of NFYC-AS1) are indicated in bold. One sample t-test p-values are reported. C Cell counts of WT and ΔTSS H520 clones at 72 h, 96 h and 120 h after plating, normalized against the average cell number in WT clones at 72 h. Data are reported as mean ± se, as from n = 3 independent biological replicates. Two-tailed unpaired t-test p-values are reported. D Heatmap of significant NES (FDR < 0.10) of cancer hallmarks (GSEA) for genes differentially expressed in ΔTSS clones compared with WT clones. E Comparative bubble plot of significant NES (FDR < 0.10) of cancer hallmarks (GSEA) for differentially expressed genes in Gapmer-treated H520 and in ΔTSS clones. Bubble size is proportional to the FDR (-log10FDR) of all Gapmers vs NEG comparison. F Heatmap of the fold-change (log2FC) of common leading-edge genes of UV response DN and G2/M checkpoint gene sets in all the Gapmers (vs NEG) and in ΔTSS clones (vs WT) and the relative tumor/normal ratio (expressed as log2FC) in LUAD, LUSC (TCGA), and SCLC (GSE60052). G Cell cycle analysis by FACS of parental H520 cells, ΔTSS and WT clones. Data are reported as mean ± sd, as from n = 2 independent biological replicates. Two-tailed unpaired t-test p-values are reported. H Representative western blot analysis of cyclin B1 in ΔTSS (n = 3) and WT (n = 3) clones. Vinculin was used as a loading control. Unpaired two-tailed t-test p-values are reported. *p < 0.05, **p < 0.01, ***p < 0.001, ****p < 0.0001, ns (non-significant).
Fig. 6
Fig. 6. Analysis of NFYC-AS1 in cis function.
A Bar plot showing NFYC expression level (qRT-PCR and RNA-seq) at 48 h after transfection with GAP2-GAP4 in H520 RB1-wt cells. Data are NEG-normalized and reported as mean ± sd, as from n = 4 independent biological replicates. B Bar plot showing NFYC expression level (qRT-PCR and RNA-seq) in ΔTSS H520 clones normalized against WT H520 clones. Data are reported as mean ± sd, as from n = 4 WT clones and n = 4 ΔTSS clones in qRT-PCR and n = 3 WT clones and n = 4 ΔTSS clones in RNA-seq. C Bar plot showing NFYC canonical and alternative expression levels (RNA-seq) at 48 h after transfection with GAP2-GAP4 in H520 RB1-wt cells. Data are NEG-normalized and reported as mean ± sd, as from n = 4 independent biological replicates. D Bar plot showing NFYC canonical and alternative expression levels (RNA-seq) in ΔTSS H520 clones normalized against WT H520 clones. Data are reported as mean ± sd, as from n = 3 WT clones and n = 4 ΔTSS clones. E Bar plot showing NFYC primary transcript expression measured using an intronic primer through qRT-PCR in ΔTSS H520 clones normalized against WT H520 clones. Data are reported as mean ± sd, as from n = 3 WT clones and n = 4 ΔTSS clones. F Scatter plot of effect sizes of eQTLs shared by NFYC and NFYC-AS1. G Time course of NFYC-AS1, NFYC, and CMYC expression levels (qRT-PCR) after re-entry of H520 cells into the cell-cycle. Data are reported as mean ± sd, as from n = 3 independent biological replicates. H Time course of NFYC-AS1/NFYC relative induction ratio after re-entry of H520 cells into the cell-cycle. Data are reported as mean ± sd, as from n = 3 independent biological replicates. Two-tailed unpaired t-test p-values are reported for panels AE. deseq2 adjusted p-values are reported for panels A and B. *p < 0.05, **p < 0.01, ***p < 0.001, ****p < 0.0001, ns (non-significant).
Fig. 7
Fig. 7. Analysis of NFYC-AS1 in trans function and proposed NFYC-AS1 dual mode of action.
A Bar plot showing the average mitotic index z-score ± sd of the two screenings as from Stojic et al. [41] for a panel of selected lncRNAs. B GSEA enrichment plots of FISCHER G1/S and G2/M CELL CYCLE, and WHITFIELD G1/S and G2/M CELL CYCLE gene sets in genes modulated upon NFYC-AS1 Gapmer-silencing. NES and FDR values are indicated in each plot. C GSEA enrichment plots of FOXM1 and E2F4 bound genes (defined as described in Supplementary Materials and Methods section) in genes modulated upon NFYC-AS1 Gapmer-silencing. NES and FDR values are indicated in each plot. D Schematic representation of the in cis and in trans possible effects, mechanism(s) of action and biological role of NFYC-AS1.

Similar articles

Cited by

References

    1. Amaral P, Carbonell-Sala S, De La Vega FM, Faial T, Frankish A, Gingeras T, et al. The status of the human gene catalogue. Nature. 2023;622:41–7. doi: 10.1038/s41586-023-06490-x. - DOI - PMC - PubMed
    1. Frankish A, Carbonell-Sala S, Diekhans M, Jungreis I, Loveland JE, Mudge JM, et al. GENCODE: reference annotation for the human and mouse genomes in 2023. Nucleic Acids Res. 2023;51:D942–9. doi: 10.1093/nar/gkac1071. - DOI - PMC - PubMed
    1. Pagani G, Pandini C, Gandellini P. Navigating the multiverse of antisense RNAs: The transcription- and RNA-dependent dimension. Non-Cod RNA. 2022;8:74. doi: 10.3390/ncrna8060074. - DOI - PMC - PubMed
    1. Wery M, Gautier C, Descrimes M, Yoda M, Vennin-Rendos H, Migeot V, et al. Native elongating transcript sequencing reveals global anti-correlation between sense and antisense nascent transcription in fission yeast. RNA. 2018;24:196–208. doi: 10.1261/rna.063446.117. - DOI - PMC - PubMed
    1. Gil N, Ulitsky I. Regulation of gene expression by cis-acting long non-coding RNAs. Nat Rev Genet. 2020;21:102–17. doi: 10.1038/s41576-019-0184-5. - DOI - PubMed

Publication types