. 2024 Mar 11;15(1):2188.
doi: 10.1038/s41467-024-46070-9.

An organism-wide atlas of hormonal signaling based on the mouse lemur single-cell transcriptome

Collaborators, Affiliations

An organism-wide atlas of hormonal signaling based on the mouse lemur single-cell transcriptome

Shixuan Liu et al. Nat Commun. .

Abstract

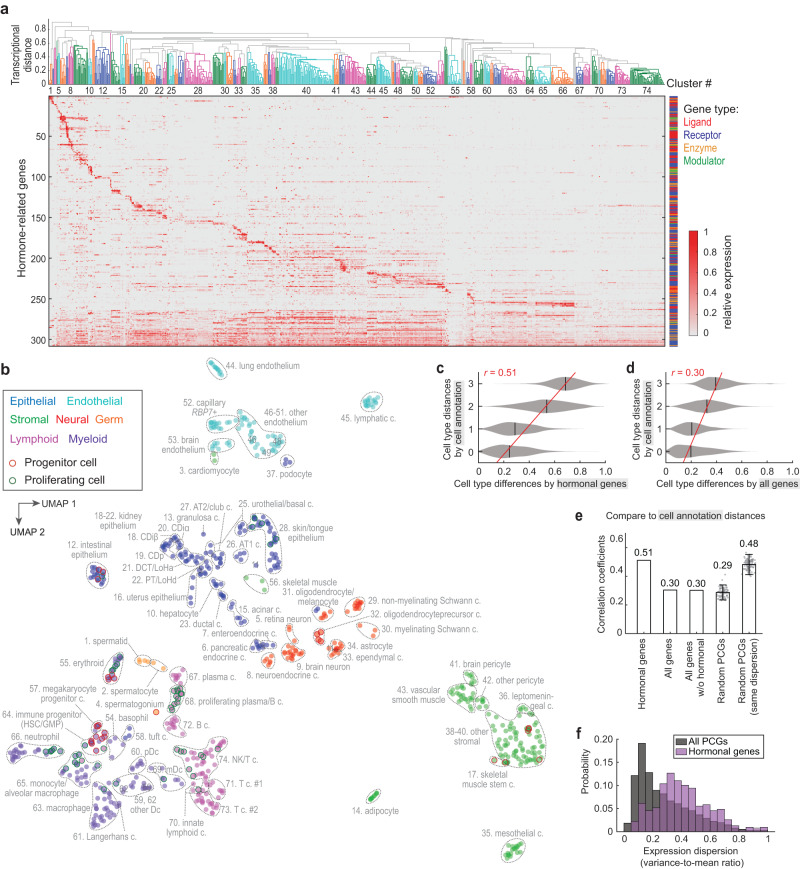
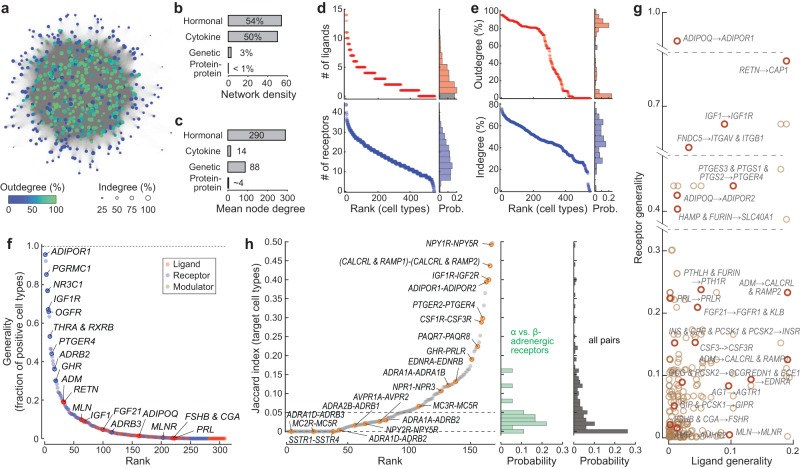
Hormones mediate long-range cell communication and play vital roles in physiology, metabolism, and health. Traditionally, endocrinologists have focused on one hormone or organ system at a time. Yet, hormone signaling by its very nature connects cells of different organs and involves crosstalk of different hormones. Here, we leverage the organism-wide single cell transcriptional atlas of a non-human primate, the mouse lemur (Microcebus murinus), to systematically map source and target cells for 84 classes of hormones. This work uncovers previously-uncharacterized sites of hormone regulation, and shows that the hormonal signaling network is densely connected, decentralized, and rich in feedback loops. Evolutionary comparisons of hormonal genes and their expression patterns show that mouse lemur better models human hormonal signaling than mouse, at both the genomic and transcriptomic levels, and reveal primate-specific rewiring of hormone-producing/target cells. This work complements the scale and resolution of classical endocrine studies and sheds light on primate hormone regulation.


Conflict of interest statement

The authors declare no competing interests.

Figures

Fig. 1
Fig. 1. Global expression of selected hormone ligands and receptors.
ag Dot plot showing expression of four sets of hormone ligands and receptors across the ~700 mouse lemur cell types, including: prolactin (ligand: PRL; receptor: PRLR), adiponectin (ADIPOQ; ADIPOR1, ADIPOR2), motilin (MLN; MLNR), and resistin (RETN; CAP1, DCN, ROR1, TLR4). Cell types are arranged by compartment: epithelial (a), stromal (b), endothelial (c), neural (d), germ (e), lymphoid (f), and myeloid (g). Rows are cell types, ordered by tissue of origin. Cell-type names are labeled on the right, organs/tissues on the left, and gene symbols on the top (red for ligands, blue for receptors). Dots represent average gene expression (circle color) and percent of cells positive for the gene (circle size). Circle edges indicate above-threshold expression (see Methods) for the ligand (red) or receptor (blue). Potentially low-quality cell types are excluded. Note that granulosa cells and acinar cells, which presumably are derived from the ovary and pancreas, respectively, were also found in perigonadal and mesenteric fat samples, likely caused by accidentally including small pieces of adjacent tissues during tissue procurement. A complete set of figures that display ligand and receptor gene expression for all 84 hormone classes can be found in Supplementary Fig. S1 and cross-species expression patterns in Supplementary Fig. S4. hj Single-plane confocal images of mouse lemur kidney assayed by RNAscope for precursors of two hormones, motilin (MLN) and angiotensin (AGT), and the proximal tubule marker cubilin (CUBN). Cells were also stained with DAPI to visualize nuclei. Note the MLN and AGT expression in the CUBN+ proximal tubule cells and not in the glomerulus, which is mainly composed of podocytes and glomerular capillary cells. Panel h shows a global view (merged 20× tile scans) with a single glomerulus in the view and many proximal tubules. The glomerulus and a representative proximal tubule are outlined by dashed curves. i, j are magnified views of the boxed areas in (h) showing a proximal tubule and glomerulus, respectively. See also Fig. 3b for scRNAseq data on MLN and AGT expression across kidney nephron epithelium.
Fig. 2
Fig. 2. Hormonal gene expression is cell-type-specific.
a Clustering of mouse lemur cell types by hormonal gene expression. At the top is a dendrogram of the hierarchical clustering. Clusters of cell types are color-coded, and cluster numbers are labeled as space allows. The cell types included in each cluster are listed in Supplementary Dataset 4. The lower part of the panel shows a heatmap of relative gene expression levels. Cluster-specific genes are ordered based on the cluster with the highest expression level, with the genes preferentially expressed in the left-hand cell-type clusters on the top. Broadly expressed genes (expressed in more than 35% of cell types) are placed in the bottom and ordered from least to most broadly expressed. b UMAP visualization of mouse lemur cell types based on the expression of hormonal genes. Circles are cell types (unique combination of annotation name and tissue of origin) and color-coded by cell-type compartment types (epithelial, neural, germ, stromal, endothelial, lymphoid, and myeloid). Dashed lines circumscribe the cell-type clusters as in panel a, and cluster IDs and names were labeled nearby. One extremely distant cluster (# 35. mesothelial cells) was shifted up in UMAP-2 toward the center of the figure for display purposes. c, d Hormonal (c) or full transcriptome (d) -based cell-type pairwise distances compared to the benchmark cell annotation-based distance. r represents Pearson’s correlation coefficient. Black vertical lines show distribution means. Red lines show the linear fitting of the data. e Correlation coefficients of cell-type transcriptional distances based on different sets of genes with the benchmark cell annotation-based distance. The error bar represents mean and 95% confidence interval of the data (n = 100). f Distributions of expression variability (dispersion) of the hormonal genes or all protein-coding genes (PCGs).
Fig. 3
Fig. 3. Specific hormonal regulation in related cell types.
a, b, eh Dot plots showing expression of hormone ligand, synthase, modulator, and receptor genes that are differentially expressed in a male germ cells across different stages of spermatogenesis, b epithelial cells along the spatial axis of the kidney nephron tubule, e endothelial cells along the arteriole-to-venule spatial axis of the kidney vasa recta, f CPN2hi vs CPN2lo subtypes of hepatocytes, g between metastatic tumor cells in the lung (L2) and the putative cell type of metastatic origin (MUC16+ non-ciliated uterus epithelial cells, L3), and h endothelial cells of the lung and brain compared to other organs. c Diagram of the nephron and vasa recta showing the cell types’ spatial distribution, related to (b, d, e). d UMAP visualization of vasa recta cells based on expression of all genes. The black line shows the detected arteriole-to-venule trajectory with the arrow pointing in the direction of blood flow. Cells are color-coded according to the cell-type annotation names in the atlas. Gray lines show the alignment of the individual cells to the trajectory. In a, cell types are arranged along the course of the spermatogenesis. b Cell types are arranged according to their spatial distribution along the kidney nephron tubule. Solid arrowheads point to AGT and MLN; their kidney expression was confirmed by RNAscope (Fig. 1h–j). h Endothelial cells are arranged by tissue of origin. e Scatter plots show gene expression levels along the arteriole-to-venule trajectory for the endothelial markers and hormonal genes that are differentially expressed. Shown here is representative data from L4, with similar results in other animals. PCT proximal convoluted tubule, PT proximal tubule, PST proximal straight tubule, LHd loop of Henle thin descending limb, LHa thin loop of Henle thin ascending limb, LHa thick loop of Henle thick ascending limb, DCT distal convoluted tubule, MD macula densa, CDp collecting duct principal cell, Cdiα collecting duct α intercalated cell, CDiβ collecting duct β intercalated cell, VRD vasa recta descending section, VRA vasa recta ascending section.
Fig. 4
Fig. 4. The hormonal cell–cell communication network.
a A representation of the network as constructed by force-directed graph drawing. Nodes (cell types) are color-coded according to the node outdegree (% of cell types connected to the current node by outgoing edges) and the node circle size shows the node indegree (% of cell types connected to the current node by incoming edges). Network edges are directed and connect nodes expressing a hormone ligand to all nodes expressing the corresponding hormone receptor. b, c Bar plot of network density (b) and average node degree (i.e., the number of connected nodes per node) (c) for different biological networks. d Number of ligand and receptor types expressed by the network nodes (cell types), ranked from most to fewest. e Indegrees and outdegrees of the network nodes (cell types), ranked from high to low values. Node degree is normalized to the total number of nodes and cluster size and measures the percentage of cell types connected from or to a network node. f Generality score of all hormone ligands and receptors ranked from the most generally expressed to most selectively expressed. Generality is defined as the percentage of nodes (cluster size normalized) positively expressing the gene(s) involved in ligand synthesis or receptor binding. Also see Supplementary Fig. S13a for generality score defined as the number of cell-type clusters positively expressing the gene(s). g Scatter plot showing generality scores of the hormone ligands and corresponding receptors. Each circle is a unique ligand-receptor pair. h Ranking (left) and distribution (right) of Jaccard indices of receptor pairs binding to the same ligand across all hormone receptors.
Fig. 5
Fig. 5. Feedback circuits in the hormonal cell–cell communication network.
a Definition of two-node feedback circuits. b Comparison of the number of 2-node feedback circuits identified in the hormonal cell–cell communication network (red dashed line) and that of permuted networks (n = 1000), using one-tailed one-sample t-test. Permutation preserved node outdegree and indegree. cl Examples of two-node feedback circuits identified in the network, focusing on the endocrine cell types. Solid black arrows indicate known regulation, dashed orange arrows indicate predicted regulation with partial literature support, and dotted arrows indicate predicted regulation without earlier knowledge that are potentially biologically relevant (red) or insignificant (gray). A leg is considered biologically insignificant if the connected hormone-producing cell type is unlikely to be the major source of the hormone (cells had lower expression levels than the canonical major source cells) and if the signaling is not local. Parentheses are used to group multiple genes that are expressed in the relevant cell type that function either together (&) or independently (/).
Fig. 6
Fig. 6. Seasonality of hormone concentrations in the mouse lemur affects almost all cells and tissues.
a Concentrations of twelve hormones measured under long-photoperiod (daily 14:10 h light:dark, summer-like) and short-photoperiod (10:14 h light:dark, winter-like) conditions in captive mouse lemurs. Animals were kept indoors under constant temperature (24 °C) and with photoperiods alternated between long and short photoperiods every 6 months. Bars represent fold changes in hormone concentration compared to average summer levels. Error bar represents mean and 95% confidence interval of the mean. P values were calculated by two-sided two-sample t-tests comparing summer versus winter concentrations. Data are listed in Supplementary Dataset 8, collected from literature as follows and supplemented with additional measurements: estradiol, (n = 5 for summer, 11 for winter), testosterone (n = 28, 15), thyroxine, (and additional data in Supplementary Dataset 8, n = 6, 10), DHEA (n = 14, 30), cortisol (and additional data in Supplementary Dataset 8, n = 12, 12), IGF1 (n = 33, 37), melatonin (n = 15, 19), and gut hormones, GIP (n = 12, 16), PPY (n = 12, 5), insulin (n = 11, 6), PYY (n = 12, 6), and GLP-1 (n = 12, 6). b Mouse lemur cell types targeted by any of these 12 seasonal hormones. Cell types are displayed in the same UMAP plot as in Fig. 2b. Circles are cell types and are color-coded according to whether they express receptors for any of the 12 hormones. Dashed lines circumscribe the cell-type clusters and are colored according to cell-type compartments. cl Mouse lemur cell types targeted by each of these 12 seasonal hormones displayed in the same UMAP format as in (b).
Fig. 7
Fig. 7. Cross-species comparisons of hormonal gene expression across humans, mouse lemurs, and mice.
a Correlation coefficients of overall expression patterns for all the hormonal one-to-one orthologs (left) or all one-to-one orthologs (right) between human and lemur vs. between human and mouse. Error bars show 95% confidence intervals. p value indicates the significance of a higher correlation between human and lemur vs. between human and mouse, calculated by comparing the two correlation coefficients with one-tailed test after Fisher’s Z-transformation. Sample sizes for the calculation of correlation coefficient are 18,290 (295 genes * 62 cell types, left) and 831,234 (13407 * 62, right), respectively. b Comparison of correlation coefficients between the expression patterns of human and lemur (x axis) versus that between human and mouse (y axis) for individual hormonal genes. c Comparison of correlation coefficients between the expression patterns of human and lemur (x axis) versus between lemur and mouse (y axis) for individual hormonal genes. Black lines in (b, c) indicate 1-1 relationship between the two coefficients. d Dot plot showing expression patterns of highly species-conserved and species-variable example genes in the 62 orthologous cell types across all three species. Rows are orthologous genes, indicated with the respective human gene symbols. Columns are cell types, displayed as triplets of the respective expression in humans, lemurs, and mice. Vertical gray lines segment different cell-type triplets. Cell types are ordered first by compartments, then by tissue, and finally by species. e, f Species-integrated UMAPs of the male germ cells with cells color-coded by species (e) or spermatogenesis stage (f). Black lines indicate the identified spermatogenesis trajectory with arrows pointing to the direction of maturation. g Dot plot showing cross-species expression patterns of spermatogenesis stage-specific hormonal genes in germ cells grouped and ordered by the integrated spermatogenesis trajectory. Cell grouping in the UMAP format is shown in Supplementary Fig. S9a. e Scatter plots showing the species-conserved or species-variable expression patterns of example genes in (g). Points are single cells color-coded by species. Solid curves show a moving average of the expression level along the spermatogenesis trajectory. d, g, h Colored bars next to the genes indicate the species conservation patterns as in (b, c).

References

    1. Bayliss WM, Starling EH. The mechanism of pancreatic secretion. J. Physiol. 1902;28:325–353. doi: 10.1113/jphysiol.1902.sp000920. - DOI - PMC - PubMed
    1. Takei, Y., Ando, H. & Tsutsui, K. Handbook of Hormones: Comparative Endocrinology for Basic and Clinical Research (Academic Press, 2015).
    1. Tata JR. One hundred years of hormones. EMBO Rep. 2005;6:490–496. doi: 10.1038/sj.embor.7400444. - DOI - PMC - PubMed
    1. Lewis GF, Brubaker PL. The discovery of insulin revisited: lessons for the modern era. J. Clin. Investig. 2021;131:e142239. doi: 10.1172/JCI142239. - DOI - PMC - PubMed
    1. Horby P, et al. Dexamethasone in hospitalized patients with Covid-19. New Engl. J. Med. 2021;384:693–704. doi: 10.1056/NEJMoa2021436. - DOI - PMC - PubMed