. 2024 Mar 11;15(1):2180.
doi: 10.1038/s41467-024-46592-2.

Identification of gene regulatory networks affected across drug-resistant epilepsies

Affiliations

Identification of gene regulatory networks affected across drug-resistant epilepsies

Liesbeth François et al. Nat Commun. .

Abstract

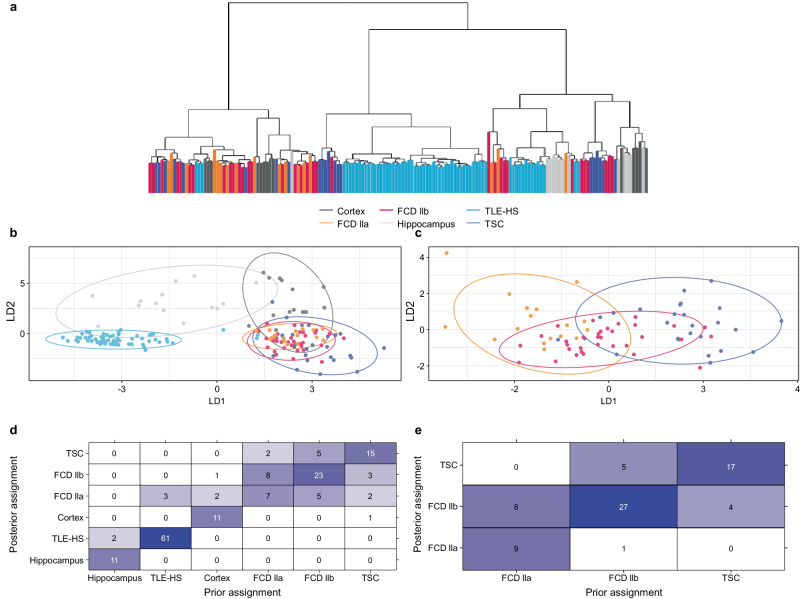
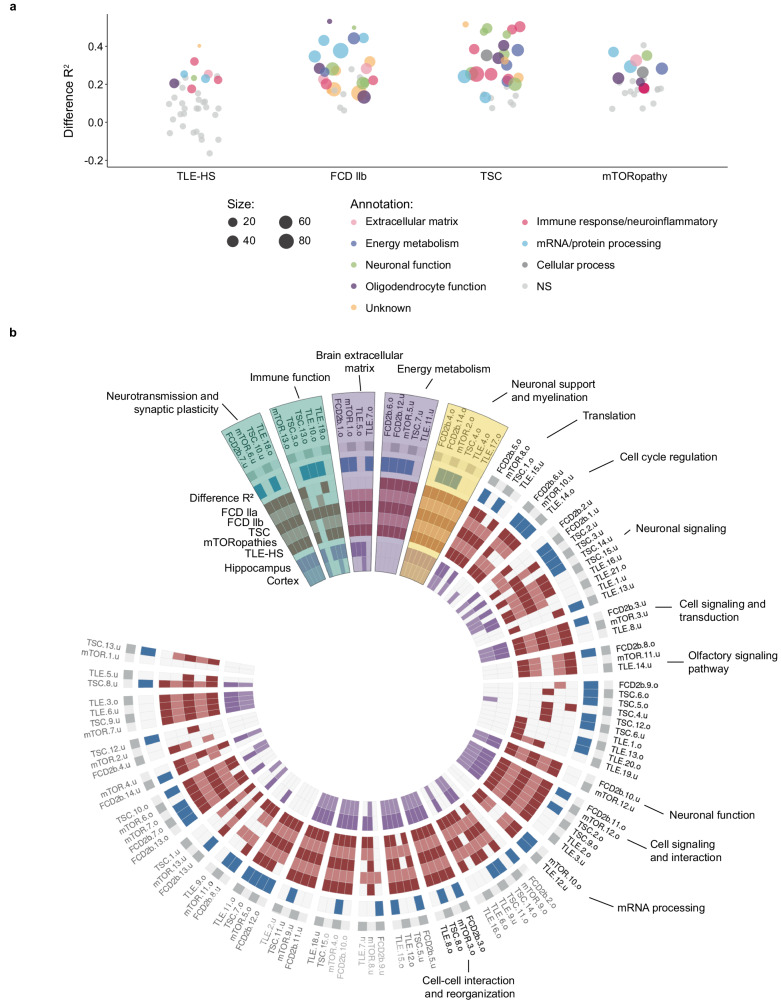
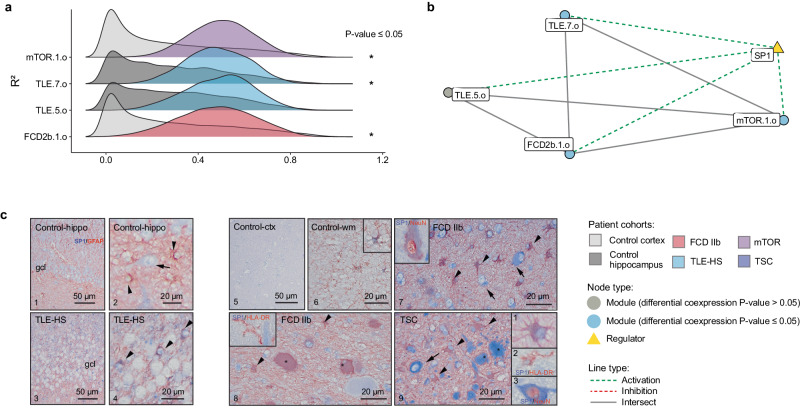
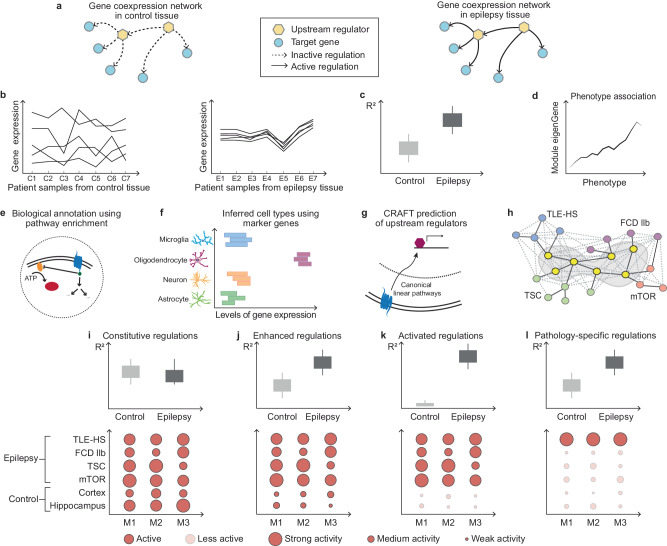
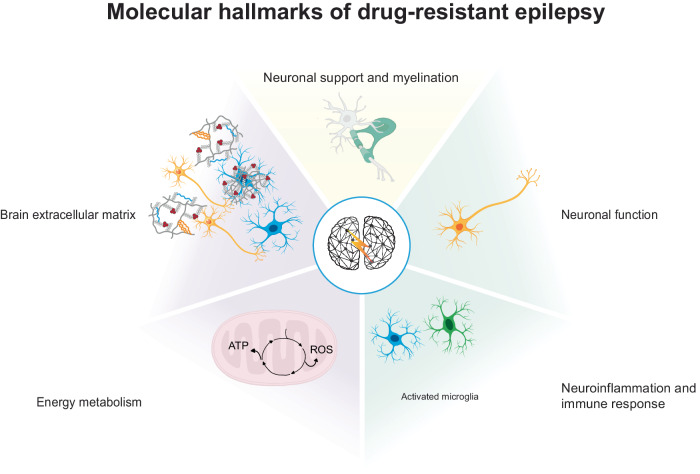
Epilepsy is a chronic and heterogenous disease characterized by recurrent unprovoked seizures, that are commonly resistant to antiseizure medications. This study applies a transcriptome network-based approach across epilepsies aiming to improve understanding of molecular disease pathobiology, recognize affected biological mechanisms and apply causal reasoning to identify therapeutic hypotheses. This study included the most common drug-resistant epilepsies (DREs), such as temporal lobe epilepsy with hippocampal sclerosis (TLE-HS), and mTOR pathway-related malformations of cortical development (mTORopathies). This systematic comparison characterized the global molecular signature of epilepsies, elucidating the key underlying mechanisms of disease pathology including neurotransmission and synaptic plasticity, brain extracellular matrix and energy metabolism. In addition, specific dysregulations in neuroinflammation and oligodendrocyte function were observed in TLE-HS and mTORopathies, respectively. The aforementioned mechanisms are proposed as molecular hallmarks of DRE with the identified upstream regulators offering opportunities for drug-target discovery and development.


Conflict of interest statement

A.R., E.A., and J.D.M. received an unrestricted grant from UCB Pharma. L.F., P.G., A.S., M.R., J.v. E., and S.D. are employees of UCB Pharma, and P.G., J.v. E., A.S., and S.D. receive stock or stock options from their employment. The remaining authors declare no competing interests.

Figures

Fig. 1
Fig. 1. Comparison of transcriptional profile across cohorts.
a Dendrogram based on unsupervised hierarchical clustering including all epilepsy (TLE-HS, FCD IIa, FCD IIb, and TSC) and control (cortex and hippocampus) patient samples. b Discriminant analysis on principal components on all cohorts identified discriminating features by tissue on the first component (linear discriminant 1 – LD1) and disease status on the second component (linear discriminant 2 – LD2). c Discriminant analysis on principal components on mTORopathy cohorts only (FCD IIa, FCD IIb, and TSC) identified limited separation on the first discriminant function. d Prior and posterior cohort assignment after discriminant analysis on principal components on all cohorts. The prior and posterior assignment of individuals to the cohort based on the discriminant functions is provided indicating admixture between cohorts. The numbers in the heatmap indicate how many samples of each cohort are (re)assigned to the same cohort based on the discriminant functions. e, Prior and posterior cohort assignment after discriminant analysis on principal components on mTORopathies specifically. The prior and posterior assignment of individuals to the cohort based on the discriminant functions were provided indicating admixture between cohorts. The numbers in the heatmap indicate how many samples of each cohort are (re)assigned to the same cohort based on the discriminant functions. FCD focal cortical dysplasia, TLE-HS temporal lobe epilepsy with hippocampal sclerosis, TSC tuberous sclerosis complex. Source data are provided as a Source Data file.
Fig. 2
Fig. 2. Overview of the gene modules per epilepsy cohorts (TLE-HS, FCD IIb, TSC, and mTORopathies).
a Overall comparison of the different gene modules indicating the change in R² between epilepsy patient samples and healthy control samples for each analyzed epilepsy cohort. Gene modules were annotated when differentially coexpressed by their main inferred biological function. b Circular heatmap showing identified regulomes derived from the systematic comparison of all identified modules by the different metrics. From outside to the inside: the gene module names were shown, the effect on disease based on differential R² (blue), conservation in epilepsy cohorts (red), and conservation in healthy control (purple). Labels of regulomes lacking functional annotation were colored in gray, regulomes with consistent functional annotation were labeled in black. The highlighted regulomes in blue, purple, and yellow represent the ‘enhanced’, ‘activated’, and ‘pathology-specific’ regulomes, respectively, that were selected. FCD focal cortical dysplasia, TLE-HS temporal lobe epilepsy with hippocampal sclerosis, TSC tuberous sclerosis complex. Source data are provided as a Source Data file.
Fig. 3
Fig. 3. Gene modules differential coexpression for multiple regulomes related to pathological mechanisms.
Network showing the gene overlap size between different gene modules and upstream transcriptional regulators. Cellular expression pattern of SOX10 immunoreactivity (IR) assessed in TLE-HS, FCD IIb, and TSC (n = 3 biological replicates per cohorts, n = 2 technical replicates). a The ridgeplots showed the distribution of gene modules coexpression (R²) for epilepsy and control patient cohorts within neuronal support and myelination regulome. Statistical significance of differential coexpression was assessed using a two-sided permutation test (mTOR.2.o p-value = 3.6 × 102, TSC.4.o p-value = 1.1 × 102, FCD2b.14.o p-value = 2.09 × 102). b Neuronal support and myelination network with indication of differential coexpression of the relevant gene modules. SOX10 and miR-488-5p were predicted as common transcriptional regulators showing activation or inhibition effect on the gene modules. c Cellular expression pattern of SOX10 immunoreactivity (IR) in hippocampal sclerosis (HS), focal cortical dysplasia type IIb (FCD IIb), and tuberous sclerosis complex (TSC). Panels 1–2 (control hippocampus; gcl, granule cell layer) and panels 3–4 (hippocampal sclerosis, HS): nuclear expression of SOX10 was restricted to oligodendroglial cells; insert 1 in panel 3: SOX10 (red) was not detectable in GFAP (blue) positive cells (astrocytes); insert 2 in panel 3: SOX10 (red) was not detectable in HLA-DR (blue) positive cells (microglial cells); insert in panel 4: SOX10 (red) co-localized with OLIG2 (blue) positive cells. Panels 5–6 (control cortex, 5 and white matter, 6), panels 7–8 (FCD IIb), and panels 9–10 (TSC): nuclear expression of SOX10 was restricted to oligodendroglial cells; insert 1 in panels 7–8: SOX10 positive cells surrounding negative balloon cells (asterisks). Insert 2 in panel 7: SOX10 (red) co-localized with OLIG2 (blue) positive cells; insert 1 in panel 8: SOX10 (red) was not detectable in GFAP (blue) positive cells; insert 3 in panel 8: SOX10 (red) was not detectable in MAP2 (blue) positive cells. Insert 1 in panels 9 and 10: SOX10 positive cells surrounding a negative dysmorphic neuron (asterisk in 1 in panel 9) and a negative giant cell (asterisk in 3 in panel 10); insert 2 in panel 10: SOX10 (red) co-localized with OLIG2 (blue) positive cells. Scale bars: 50 µm. FCD focal cortical dysplasia, GFAP glial fibrillary acidic protein, HLA human leukocyte antigen, TLE-HS temporal lobe epilepsy with hippocampal sclerosis, TSC tuberous sclerosis complex. Source data are provided as a Source Data file.
Fig. 4
Fig. 4. Gene modules differential coexpression for multiple regulomes related to pathological mechanisms.
Network showing the gene overlap size between different gene modules and upstream transcriptional regulators. Cellular expression pattern of SP1 immunoreactivity (IR) assessed in TLE-HS, FCD IIb, and TSC (n = 3 biological replicates per cohorts, n = 2 technical replicates). a The ridgeplots showed the distribution of gene modules coexpression (R²) for epilepsy and control cohorts within brain extracellular matrix regulome; mTOR.1.o, TLE.7.o, and FCD2b.1.o gene modules showed a significant increase of R2. Statistical significance of differential coexpression was assessed using a two-sided permutation test (TSC.13.0 p-value = 9.99 × 104, TSC.3.o p-value = 4.00 × 103, TLE.10.o p-value = 3.28 × 102). b Brain extracellular matrix network highlighting the differentially coexpressed gene modules. SP1 was predicted as a common transcriptional regulator showing activation effect on the gene modules. c The cellular expression pattern of SP1 IR was assessed in TLE-HS, FCD IIb, and TSC. Panels 1–9: IHC of SP1. Panels 1–2 In control hippocampus, SP1 expression was very low in neuronal cells (arrow in panel 2, hilar neuron); SP1 was not detectable in GFAP-positive cells. Panels 2–4: In TLE-HS, SP1 expression in astroglial cells (arrowheads). Panels 5–6: In control cortex, very low expression of SP1 (panel 5); occasionally few GFAP-positive cells were observed in the white matter (wm) (panel 6). Panels 7–8: In FCD IIb, SP1 IR was observed in dysplastic neurons (arrows) and GFAP-positive cells (arrowheads), including GFAP-positive balloon cells (asterisks). SP1 expression in a NeuN dysplastic neuron (insert in panel 7). Absence of SP1 expression in HLA-DR positive cells (microglia/macrophages; insert in panel 8). Panel 9: In TSC, SP1 expression in dysplastic neurons (arrow; high-magnification of a dysplastic neuron; insert 3 in panel 9) and GFAP-positive cells (arrowheads; insert 1 in panel 9), including giant cells (asterisks). Absence of SP1 expression in HLA-DR positive cells (microglia/macrophages; insert 2 in panel 9). Scale bars: 50 µm. FCD focal cortical dysplasia, GFAP glial fibrillary acidic protein, HLA human leukocyte antigen, TLE-HS temporal lobe epilepsy with hippocampal sclerosis, TSC tuberous sclerosis complex. Source data are provided as a Source Data file.
Fig. 5
Fig. 5. Gene modules differential coexpression for multiple regulomes related to pathological mechanisms.
Network showing the gene overlap size between different gene modules and upstream transcriptional regulators. Cellular expression pattern of KDM1A immunoreactivity (IR) assessed in TLE-HS, FCD IIb, and TSC (n = 3 biological replicates per cohorts, n = 2 technical replicates). a The ridgeplots showed the distribution of gene modules coexpression (R²) for epilepsy and control cohorts within the energy metabolism regulome. Statistical significance of differential coexpression was assessed using a two-sided permutation test (TSC.10.u p-value = 3.9 × 102, FCD2b.7.u p-value = 1.46 × 102). b Energy metabolism network highlighting the differentially coexpressed gene modules. KMD1A/LSD1 was predicted as common transcriptional regulator showing activation effect on FCD2b.12.u, TSC.7.u, and mTOR.5.u. c Cellular expression of KDM1A IR in TLE-HS, FCD IIb, and TSC. Panels 1–11: IHC of KDM1A. Panels 1–2: In control hippocampus, KDM1A expression was restricted to neuronal cells; KDM1A was not detectable in GFAP-positive cells (astrocytes); Panel 1: Nuclear expression in granule cell layer (gcl; arrows) of the dentate gyrus (DG); Panel 2: Nuclear expression in hilar neurons (arrows). Panels 3–4: In TLE-HS, KDM1A nuclear expression in both neurons (arrows) and astroglial cells (arrowheads). KDM1A expression in a NeuN positive neuron (insert in 2 in panel 4). Absence of KDM1A expression in HLA-DR positive cells (microglia/macrophages; insert 3 in panel 4). Panels 5–6: In control cortex, KDM1A expression was restricted to neuronal cells (insert in panel 5: high-magnification of a positive neuron); KDM1A was not detectable in GFAP-positive cells. Panels 7–9: In FCD IIb, KDM1A IR was observed in dysplastic neurons (arrows) and GFAP-positive cells (arrowheads; insert 1 in panel 7), including GFAP-positive balloon cells (asterisk). KDM1A expression in a NeuN positive dysplastic neuron (insert 2 in panel 7). Absence of KDM1A expression in HLA-DR positive cells (microglia/macrophages; panel 9). Panels 10–11: In TSC, KDM1A IR was observed in dysplastic neurons (arrows) and GFAP-positive cells (arrowheads), including giant cells (asterisks). Absence of KDM1A expression in HLA-DR positive cells (microglia/macrophages; insert 1 in panel 11). KDM1A expression in a NeuN dysplastic neuron (insert 2 in panel 11). Scale bars: 50 µm. FCD focal cortical dysplasia, GFAP glial fibrillary acidic protein, HLA human leukocyte antigen, TLE-HS temporal lobe epilepsy with hippocampal sclerosis, TSC tuberous sclerosis complex. Source data are provided as a Source Data file.
Fig. 6
Fig. 6. The workflow of gene module annotation and identification of regulomes epilepsies, leading to a proposed summary of impaired biological mechanisms as the molecular hallmarks of drug-resistant epilepsy.
a Gene modules capture the underlying regulatory processes that are present in the disease state. b Correlation matrix across the different samples within one cohort. To infer potential biological function, responsible cell type(s), and the link to disease, the following metrics were considered for each gene module: c differential coexpression between control and epilepsy (R²), d association to phenotype, e functional pathway annotation, f inferred cell type, and g prediction of direct (transcription factor and microRNA) and indirect (cell membrane receptor) upstream regulators. h Unsupervised hierarchical clustering identified corresponding clusters of gene modules, termed regulomes. For all regulomes, differential coexpression and conservation were obtained to classify the following four classes of regulations: i Constitutive regulations capture those that are present in control and epilepsy patient samples. j Enhanced regulations are present in control samples but show enhanced activity in epilepsy patient samples. k Activated regulations can only be identified in epilepsy patient samples and may represent strong disease impaired pathways. l Some gene modules did not show a strong overlap with gene modules of other epilepsy cohorts while showing significant increase in coexpression in the original epilepsy cohort and were referred to as pathology-specific regulations. ADP adenosine diphosphate, ATP adenosine triphosphate, C1-7 samples from control tissue, CRAFT Causal Reasoning Analytical Framework for Target discovery, E1-7 samples from epilepsy patient tissue, FDC IIb focal cortical dysplasia type IIb, M1-3 gene modules, mTOR mechanistic target of rapamycin, mTORopathies mTOR-related malformations of cortical development, TLE-HS temporal lobe epilepsy with hippocampal sclerosis, TSC tuberous sclerosis complex. Source data are provided as a Source Data file.
Fig. 7
Fig. 7. Proposed summary of impaired biological mechanisms as the molecular hallmarks of drug-resistant epilepsy.
This workflow led to a proposal for the molecular hallmarks of drug-resistant epilepsy. Enhanced regulations were identified related to neuronal function and neuroinflammation and immune response. Two activated regulomes were identified and involved in brain extracellular matrix and energy metabolism (oxidative phosphorylation/respiratory electron transport). Finally, connecting gene coexpression modules across epilepsy cohorts allows the identification of regulations specific to epilepsy cohorts such as neuroinflammation and immune response in TLE-HS and neuronal support and myelination in mTORopathies. mTORopathies mTOR-related malformations of cortical development, TLE-HS temporal lobe epilepsy with hippocampal sclerosis.

References

    1. Fisher RS, et al. ILAE official report: a practical clinical definition of epilepsy. Epilepsia. 2014;55:475–482. doi: 10.1111/epi.12550. - DOI - PubMed
    1. Feigin VL, et al. Global, regional, and national burden of neurological disorders, 1990–2016: a systematic analysis for the Global Burden of Disease Study 2016. Lancet Neurol. 2019;18:459–480. doi: 10.1016/S1474-4422(18)30499-X. - DOI - PMC - PubMed
    1. Fisher RS, et al. Operational classification of seizure types by the International League Against Epilepsy: Position Paper of the ILAE Commission for Classification and Terminology. Epilepsia. 2017;58:522–530. doi: 10.1111/epi.13670. - DOI - PubMed
    1. Dreier JW, Laursen TM, Tomson T, Plana-Ripoll O, Christensen J. Cause-specific mortality and life years lost in people with epilepsy: a Danish cohort study. Brain. 2023;146:124–134. doi: 10.1093/brain/awac042. - DOI - PubMed
    1. Kwan P, et al. Definition of drug resistant epilepsy: consensus proposal by the ad hoc Task Force of the ILAE Commission on Therapeutic Strategies. Epilepsia. 2010;51:1069–1077. doi: 10.1111/j.1528-1167.2009.02397.x. - DOI - PubMed

MeSH terms