. 2024 Mar 11;15(1):2194.
doi: 10.1038/s41467-024-46371-z.

The thymocyte-specific RNA-binding protein Arpp21 provides TCR repertoire diversity by binding to the 3'-UTR and promoting Rag1 mRNA expression

Affiliations

The thymocyte-specific RNA-binding protein Arpp21 provides TCR repertoire diversity by binding to the 3'-UTR and promoting Rag1 mRNA expression

Meng Xu et al. Nat Commun. .

Erratum in

Abstract

The regulation of thymocyte development by RNA-binding proteins (RBPs) is largely unexplored. We identify 642 RBPs in the thymus and focus on Arpp21, which shows selective and dynamic expression in early thymocytes. Arpp21 is downregulated in response to T cell receptor (TCR) and Ca2+ signals. Downregulation requires Stim1/Stim2 and CaMK4 expression and involves Arpp21 protein phosphorylation, polyubiquitination and proteasomal degradation. Arpp21 directly binds RNA through its R3H domain, with a preference for uridine-rich motifs, promoting the expression of target mRNAs. Analysis of the Arpp21-bound transcriptome reveals strong interactions with the Rag1 3'-UTR. Arpp21-deficient thymocytes show reduced Rag1 expression, delayed TCR rearrangement and a less diverse TCR repertoire. This phenotype is recapitulated in Rag1 3'-UTR mutant mice harboring a deletion of the Arpp21 response region. These findings show how thymocyte-specific Arpp21 promotes Rag1 expression to enable TCR repertoire diversity until signals from the TCR terminate Arpp21 and Rag1 activities.


Conflict of interest statement

The authors declare no competing interests.

Figures
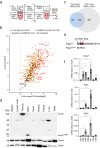
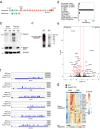
Fig. 1
Fig. 1. The thymic RBPome includes the dynamically expressed Arpp21 protein.
a Schematic representation of the OOPS method. b Volcano plots from two-sided Student’s t test analysis using a permutation-based FDR method for multiple hypothesis corrections showing the −log 10 p value plotted against the log2 fold-change comparing the organic phase after RNase treatment of the interphase of OOPS experiments of the crosslinked (XL) mouse thymocytes versus the non-crosslinked sample. Black dots represent proteins significant at a 5% FDR cutoff level. Yellow dots show RBPs additionally identified in the EuRBPDB and red dots represent proteins for which crosslinks to RNA moieties have directly been measured. c Venn diagram showing the overlap between mouse CD4 T cell RBPs and confirmed RBPs detected in thymocytes (represented by yellow and red dots in (b)). d Representative immunoblots from two independent experiments showing the indicated proteins in cell lysates from different tissues. e Scheme of Arpp21 isoforms showing the domains of R3H in red, SUZ in purple and coiled-coil (CC) in blue. f RT-qPCR analysis of the indicated mRNAs in sorted DN1, DN2, DN3, DN4, DP, CD4-SP, or CD8-SP thymocytes from WT mice. Data are presented as mean values ± SD. n = 7 (for Arpp21 and Rag1) or n = 4 (for Rag2), statistic significance was determined by One-way ANOVA, *p < 0.05, **P < 0.01, ***P < 0.001 and ****P < 0.001. Source data for (d, f) are provided as a Source Data file.
Fig. 2
Fig. 2. Ca2+ signals induce phosphorylation, polyubiquitination and proteasomal degradation of Arpp21.
Immunoblot analyses of Arpp21 and indicated loading controls in extracts of thymocytes from (a) TCR-transgenic OTI, Stim1fl/fl;Stim2fl/fl;Vav-iCre (g) or Camk4–/– (h) as well as WT mice (bh). Cells were stimulated with (a) 2 µg/mL of cognate peptide SIINFEKL or (b) 1 µg/mL of anti-CD3 and 2 µg/mL anti-CD28 for 0 h, 1 h, 2 h and 3 h or (ch) with 1 µM ionomycin or (c) 20 nM PMA or (df) 10 μM MG132, as indicated. e, f Protein extracts from WT mice stimulated with ionomycin and MG-132 were immunoprecipitated with Arpp21-specific antibodies, separated by SDS-PAGE and probed with ubiquitin-reactive antibodies or treated with phosphatase buffer and with antarctic phosphatase to analyze Arpp21 mobility in SDS-PAGE as detected by immunoblotting. Each experiment was performed at least twice. Source data for (ah) are provided as a Source Data file.
Fig. 3
Fig. 3. Identification of targets and binding sites of Arpp21 in thymocytes.
a Description of the Arpp21/miR-128-2 gene locus, indicating the Arpp21 gene targeting strategy. b Representative immunoblot analysis of Arpp21 and Arpp21short proteins in brain and thymus extracts of WT and Arpp21–/– mice. The experiment was repeated twice. c Representative autoradiography of crosslinked and 32P-labeled RNA-Arpp21 immunoprecipitation complexes from thymocyte lysates of WT and Arpp21–/– mice (n = 4 each). d Association of Arpp21 peaks on RNA transcript according to gene region. e Volcano plot of DEGs identified in mRNA-sequencing of DN3 thymocytes showing the −log10 (P value) plotted against the log2 (fold-change). The Arpp21-target mRNAs identified by iCLIP are shown in red. f Integrated genome view displaying Arpp21 iCLIP reads in the 3′-UTRs of Phf6, Lin7c, Tgfbr1, Rc3h1, Rc3h2, and Rag1 showing merged data from four biological replicates. g Heat map showing differentially expressed Arpp21-target genes identified in mRNA-sequencing of DN3 thymocytes (padj < 0.1) in the intersection with iCLIP data in DN2 and DN3 thymocytes from WT (gray) and Arpp21–/– (blue) mice. Values represent the z-score. Source data for (b) are provided as a Source Data file.
Fig. 4
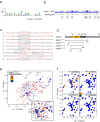
Fig. 4. Arpp21 binds uridine-rich motifs through its R3H domain.
a MEME motif search identifies a uridine-rich sequence enriched at Arpp21 binding sites. b Integrated genome view of Arpp21 iCLIP reads in the 3’-UTRs of Rag1 with predicted binding sites called by PureCLIP. c Sequences in and flanking peak regions of the 3’-UTRs of Rag1 are displayed. d Arpp21 subconstructs used for the NMR experiments within the N-terminal region in relation to R3H (163-226) or SUZ (227-298) domains as predicted by PROSITE. e HSQC-monitored titration of Arpp21130-260 with U9 RNA (molar ratios of 0, 0.05, 0.1, 0.25, 0.5, 1.0). Assigned resonances are annotated and the resonances with significant CSP or intensity loss, at the equimolar U9 RNA addition, are annotated in red. f Comparisons of Arpp21130-260 titrations with four types of RNA (U6, A6, C6, G6) with the protein-to-RNA molar ratios of 0, 0.25, 0.5, 1.0 (see Supplementary Fig. 5 for full spectra).
Fig. 5
Fig. 5. Arpp21 deficiency results in the accumulation of DN3a thymic progenitors.
a Comparison of thymocyte development in WT and Arpp21–/– mice. Representative contour plots (left) and statistical analysis (right) of main thymic populations (WT n = 6; KO = 7). b Representative pseudo-color plots (left) and statistical analysis (right) of main DN populations (WT n = 6; KO = 7). c Flow cytometry of DN or DP thymocytes on the indicated subpopulations stained with 8G2 antibody. (n = 4). The stages of positive selection were defined by TCRβ and CD69 markers. d Pseudo-color plots showing all DN populations in WT and Arpp21–/– mice (left) and statistical analysis (right) (WT n = 5; KO = 5). Red arrows show either accumulation (DN3a) or reduced (DN4a+b) frequency of progenitors in the Arpp21-deficient thymus. Data are representative of three (a) or two (b, d) experiments. Each point represents an individual thymus, mean values with SD are shown. Statistical analysis was performed using two-way ANOVA followed by Sidak’s multiple comparison test. Source data for (ad) are provided as a Source Data file.
Fig. 6
Fig. 6. Arpp21-dependent regulation of the Rag1 3′-UTR promotes TCRβ rearrangement.
a RT-qPCR determining Rag1 and Rag2 mRNA levels in DN3 thymocytes from WT and Arpp21–/– mice. Data are presented as mean values ± SD. n = 7, statistic significance was determined by two-sided Student’s t test, with ****P < 0.001 indicating significance, and n.s. indicating no significance (p > 0.05). b Western blot analysis of Rag1 protein expression in whole thymocytes lysates from Rag1–/–, WT and Arpp21–/– mice (left) with a densitometric quantification of Rag1 protein expression in WT and Arpp21–/– thymocytes shown in (right), statistical significance was determined by two-sided Student’s t test. c, d Hela cells were transduced with MSCV-thy1.1 or MSCV-Arpp21-thy1.1 retroviruses. Cells were then transfected with psiCheck2 empty (negative control) or psiCheck2 vectors harboring the indicated 3′-UTRs in full-length (c) or 3end deleted versions (d). Renilla and Firefly luciferase activity (upper panel) or mRNA level (lower panel) were assessed. Data are representative of two or more experiments. Data are represented as mean values ± SD. Two-way ANOVA was used to determine statistical significance and ns indicates no significance (p > 0.05). e Flow cytometry analysis of intracellular TCRβ expression in DN3 thymocytes from WT and Arpp21–/– mice displayed as representative histogram (upper panel) or statistical analysis (lower panel). Data are presented as mean values ± SD. n = 5, statistic significance was determined two-sided Student’s t test ****P < 0.001. f Semi-quantitative PCR analysis of Dβ2-to-Jβ2.6, Vβ8.2-to-DJβ2.6, Vβ11-to-DJβ2.6 and Vβ12-to-DJβ2.6 rearrangements in sorted CD25 + DN thymocytes from WT and Arpp21–/– mice. MEF cells were used as the negative control. CD14 was used as the loading control. Source data of (af) are provided as a Source Data file.
Fig. 7
Fig. 7. Altered TCR repertoire in Arpp21-deficient T cells.
a The number of TRBV and TRAV clones identified in splenic CD4 T cells sufficient or deficient for Arpp21. b Repertoire diversity of TRBV and TRAV in peripheral CD4 T cells (a, b) error bars represent SD, significance was determined by unpaired t test, two-tailed. c Cumulative percentage of the most frequent 50,000 TRBV clones. Solid lines represent the mean of all analyzed mice, shaded areas indicate the standard deviation (d) Heat map showing the relative distribution of the top 20 TRBV clones. Each column represents a mouse with the indicated phenotype. e Schematic representation of TCR alpha locus, showing recombination order. Only TRAV and TRAJ elements are shown, TRDV elements have been omitted for clarity. Not to scale. Adapted after. f Heat map showing the z-score of the relative usage of all productive TRAV (left) and TRAJ (right) segments in WT and Arpp21-deficient splenic CD4 T cells. Each line represents a single mouse, except for the last two where the average for WT and KO is shown. WT vs. KO ratio of usage of all productive TRBV (g) as well as TRAV and TRAJ (h) segments in relation to their chromosomal location. i Length distribution (measured in nucleotides) of all TRBV and TRAJ CDR3 elements detected in WT and Arpp21 KO T cells, significance was analyzed by two-way ANOVA, effect of genotype is shown. Data are representative of one experiment, n = 7 for each genotype, each data point in (a, b, d and f) represents a single mouse. All analyzed mice are shown. Source data of (a–h) are provided as Source Data file.
Fig. 8
Fig. 8. Uncoupling Rag1 from Arpp21 regulation phenocopies Arpp21 deficiency.
a Schematic of the Rag1 3-UTR locus showing the strategy used to generate Rag13’del/3’del mice. b Representative plots of all major DN thymic progenitor populations in WT and Rag13’del/3’del thymocytes. The red line indicates the point of beta selection, red arrows indicate the accumulation of pre-selected progenitors and the subsequent reduction of post-beta selected cells. c Quantification of the data shown in (b) (WT n = 8; KO = 6). Error bars represent SD significance was determined by two-way ANOVA followed by Sidak’s multiple comparison test. d Representative histograms (top) and statistical analysis by unpaired t test, two-tailed (bottom) of the intracellular expression of the TCR beta chain in DN3 progenitors (WT n = 8; KO = 6). e RT-qPCR of Rag1 and Rag2 in unfractionated thymocytes. ce error bars represent SD. f Representative WB analysis of Rag1 expression in WT (n = 3) and Rag13’del/3’del (n = 4) thymocytes. g Frequency of the 20 most common TRBV clones in peripheral CD4 T cells. h A plot showing the WT vs. KO (Rag13’del/3’del) ratio of TRBV (left) and TRAV (right) in relation to their chromosomal location. i Heat map showing the z-score of the relative usage of all productive TRAV segments in WT and KO (Rag13’del/3’del) splenic CD4 T cells. Each line represents a single mouse, except for the last two where the average for WT/het and KO (Rag13’del/3’del) is shown. Data are representative of one experiment, n = 8 for combined WT and het mice, n = 4 for KO (Rag13’del/3’del). Each data point in (c, d and e, f) represents a single mouse. All analyzed mice are shown. Source data for (ci) and f are provided as a Source Data file.
Fig. 9
Fig. 9. The role of post-transcriptional regulation of Rag1 on thymocyte development.
a, b Immunoblot analysis of Rag1 and Arpp21 in thymocytes from two different control or mice with specified genotypes. Gapdh or β-actin serve as loading controls (n = 2 biological replicates). c Display of multicolor thymic staining data projected in two UMAP dimensions. UMAPs were calculated from concatenated files containing 250,000 live thymocytes from each mouse used in the experiment (6,250,000 cells in total). The overlay dot plot is colored according to manual gates. d Gates created around the cell clusters of the two UMAP dimensions. The heat map shows the expression of the 18 parameters used for UMAP in each cluster. e Representative UMAP projections of total thymocytes isolated from mice of specified genotypes. Red arrows indicate the accumulation of progenitors before the β-selection point. f Representative pseudocolor plots of DN3-DN4 thymocytes isolated from thymi with the indicated genotypes. g Statistical analysis of all major DN thymic progenitors. The data are representative of two experiments, with two (a, b) or minimum three mice per each genotype (cg). ce All markers listed in (d) were used in the UMAP parameter calculations. e Each point represents a single thymus, means with SD are shown. Statistical analysis was performed using two-way ANOVA followed by Sidak’s multiple comparison test. Source data for (ag) are provided as a Source Data file.

Similar articles

Cited by

References

    1. Behrens, G. et al. Disrupting Roquin-1 interaction with Regnase-1 induces autoimmunity and enhances antitumor responses. Nat. Immunol.22, 1563–1576 (2021). 10.1038/s41590-021-01064-3 - DOI - PMC - PubMed
    1. Jeltsch, K. M. et al. Cleavage of roquin and regnase-1 by the paracaspase MALT1 releases their cooperatively repressed targets to promote T(H)17 differentiation. Nat. Immunol.15, 1079–1089 (2014). 10.1038/ni.3008 - DOI - PubMed
    1. Matsushita, K. et al. Zc3h12a is an RNase essential for controlling immune responses by regulating mRNA decay. Nature458, 1185–1190 (2009). 10.1038/nature07924 - DOI - PubMed
    1. Tavernier, S. J. et al. A human immune dysregulation syndrome characterized by severe hyperinflammation with a homozygous nonsense Roquin-1 mutation. Nat. Commun.10, 4779 (2019). 10.1038/s41467-019-12704-6 - DOI - PMC - PubMed
    1. Taylor, G. A. et al. A pathogenetic role for TNF alpha in the syndrome of cachexia, arthritis, and autoimmunity resulting from tristetraprolin (TTP) deficiency. Immunity4, 445–454 (1996). 10.1016/S1074-7613(00)80411-2 - DOI - PubMed

MeSH terms