. 2024 Mar 11;15(1):2192.
doi: 10.1038/s41467-024-46167-1.

Delivery of a BET protein degrader via a CEACAM6-targeted antibody-drug conjugate inhibits tumour growth in pancreatic cancer models

Affiliations

Delivery of a BET protein degrader via a CEACAM6-targeted antibody-drug conjugate inhibits tumour growth in pancreatic cancer models

Youya Nakazawa et al. Nat Commun. .

Abstract

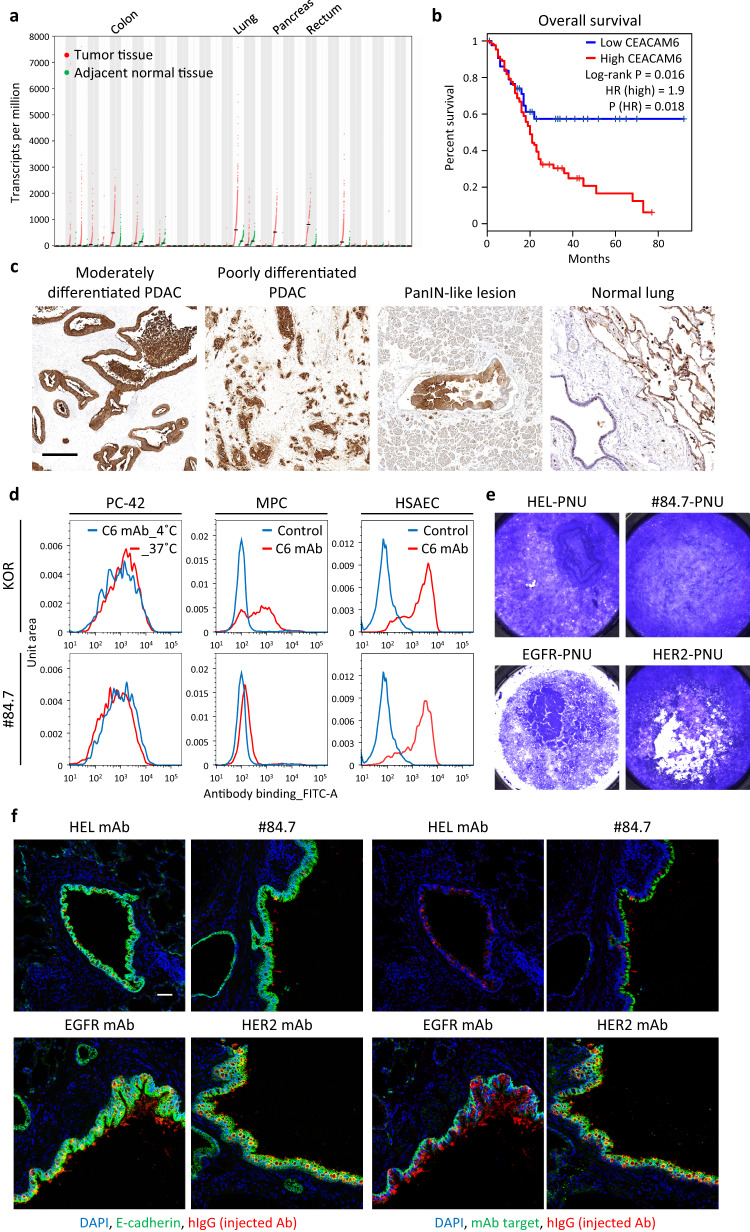
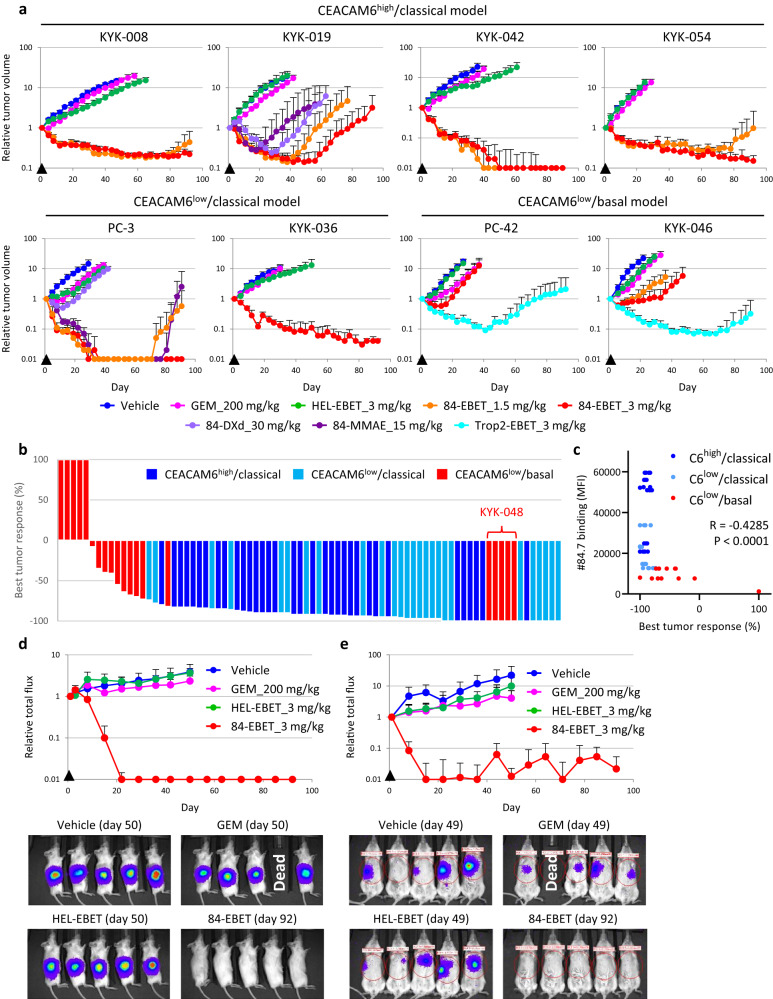
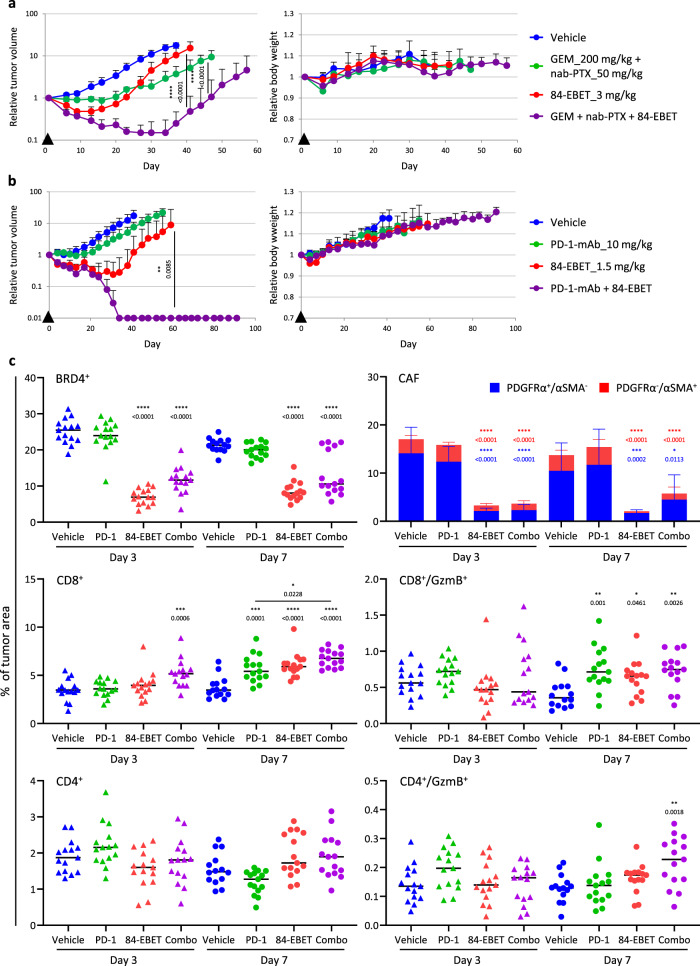
Pancreatic ductal adenocarcinoma (PDAC) has the worst prognosis of all cancers. To improve PDAC therapy, we establish screening systems based on organoid and co-culture technologies and find a payload of antibody-drug conjugate (ADC), a bromodomain and extra-terminal (BET) protein degrader named EBET. We select CEACAM6/CD66c as an ADC target and developed an antibody, #84.7, with minimal reactivity to CEACAM6-expressing normal cells. EBET-conjugated #84.7 (84-EBET) has lethal effects on various PDAC organoids and bystander efficacy on CEACAM6-negative PDAC cells and cancer-associated fibroblasts. In mouse studies, a single injection of 84-EBET induces marked tumor regression in various PDAC-patient-derived xenografts, with a decrease in the inflammatory phenotype of stromal cells and without significant body weight loss. Combination with standard chemotherapy or PD-1 antibody induces more profound and sustained regression without toxicity enhancement. Our preclinical evidence demonstrates potential efficacy by delivering BET protein degrader to PDAC and its microenvironment via CEACAM6-targeted ADC.


Conflict of interest statement

All authors are employees of Eisai Co., Ltd. and this study was funded by Eisai Co., Ltd.

Figures

Fig. 1
Fig. 1. Compound screening with organoids identifies EBET-1055, a compound effective against PDAC.
a PC-3 and PC-42 organoid growth inhibition by EBET and reference compounds. Data are presented as means ± standard deviation (n = 4 biological replicates for EBET, n = 2 biological replicates for others). Fitted curves with nonlinear regression are shown. GEM: gemcitabine; PTX: paclitaxel; ERL: erlotinib; 5FU: 5-fluorouracil; SN38: an active metabolite of irinotecan; OXA: oxaliplatin; MAY: maytansine; MMAE: monomethyl auristatin E; EXA: exatecan; PNU: PNU-159682; CALI: calicheamicin; SJG: SJG-136. b Inhibition of stromal signaling by GEM and EBET in co-culture of PC-3 cells and liver stellate cells (LSCs). Signal intensity was normalized by the viability of LSCs, and relative values against the signal in monoculture of LSCs are presented as means ± standard deviation (n = 4 biological replicates). Fitted curves with nonlinear regression are shown. c Immunofluorescence staining of E-cadherin, BC2LCN, and Ki-67 in organoids. Representative images are shown from 2 independent experiments with similar results. Scale bars, 50 μm. a, b Source data are provided as a Source data file.
Fig. 2
Fig. 2. Establishment of CEACAM6 antibody, #84.7.
a Expression of CEACAM6 mRNA in 33 cancer types (red dots) and paired normal tissues (green dots) was plotted by using the TCGA database and GEPIA server. Bars represent means. Arrowhead indicates PDAC data. b Patient survival analysis in PDAC patients (n = 90, from TCGA) according to CEACAM6 mRNA expression (high: upper 75%; low: lower 25%). HR, hazard ratio; 95% confidence interval. P-value calculated by log-rank test is shown on the plot. c Immunohistochemical staining of CEACAM6 in human PDAC samples and normal lung tissue. Representative images are shown from 2 independent experiments with similar results. Scale bar, 100 μm. PanIN, pancreatic intraepithelial neoplasia. d Flow cytometric analysis of CEACAM6 antibodies using PC-42 cancer cells, myeloid progenitor cells (MPCs) and human small airway epithelial cells (HSAECs). With PC-42 cells, cell-internalization activity was also examined after incubation in culture at 37 ˚C. Representative data are shown from 2 independent experiments with similar results. KOR is a reference mAb for CEACAM6. e In vitro lung toxicity assay with air-liquid interface (ALI) culture of human pulmonary alveolar epithelial cells. Five days after incubation of ADCs in the lower chamber of ALI culture in 1 nM of PNU-conjugated #84.7, hen egg lysozyme 3 (HEL) mAb, EGFR mAb (cetuximab), or HER2 mAb (trastuzumab), surviving epithelial cells were stained with crystal violet. Representative data are shown from 2 independent experiments with similar results. f Immunofluorescence staining of injected antibodies in monkey lung. Twenty-four hours after injection of #84.7, HEL mAb, EGFR mAb (cetuximab), or HER2 mAb (trastuzumab), injected antibodies were visualized by using anti-human-IgG, and the respective antibody targets were visualized by using antibodies different from the injected ones. Scale bar, 50 μm.
Fig. 3
Fig. 3. 84-EBET efficiently kills various PDAC organoids and modulates CAF activity via the bystander effect.
a Organoid growth inhibition by 84-EBET, 84-MMAE, and 84-DXd (-deruxtecan), in 16 PDAC organoid models (n = 4 biological replicates). Fitted curves with nonlinear regression are shown. b Cell growth inhibition by 84-EBET, 84-MMAE, and 84-DXd in co-culture of HPAF-II/Cas9/Fluc (target) and HPAF-II/CEACAM6-KO/Rluc (bystander) cells at multiple ratios. The viabilities of the target and bystander were measured by using dual luciferase assay. Data are presented as means ± standard deviation (n = 4 biological replicates). Fitted curves with nonlinear regression are shown. c Quantification of inflammatory cytokines released from CAFs in co-culture with PC-3 and PC-42 cells. Data are presented as means ± standard deviation (n = 3 biological replicates). *P < 0.05, **P < 0.01, ***P < 0.001, ****P < 0.0001, one-way ANOVA test followed by Dunnett’s test between control group and treatment groups in each culture. ac Source data are provided as a Source data file.
Fig. 4
Fig. 4. 84-EBET induces substantial regression of various PDAC-PDX tumors after a single injection.
a Representative tumor growth curves in response to GEM and 84-EBET in the PDAC-PDX panel. 84-MMAE, 84-DXd, and Trop2-EBET were examined in only some models. The average starting tumor volumes were as follows, PC-3: 100 mm3, PC-42: 80 mm3, KYK-008: 100 mm3, KYK019: 100 mm3, KYK-036: 140 mm3, KYK-042: 75 mm3, KYK-046: 80 mm3, KYK-054: 100 mm3. Arrowheads indicate times of drug administration. Complete regression (100% reduction of tumor volume) was defined as 0.01 on a log-scale graph. Data are presented as means ± standard deviation (n = 5 mice). b Waterfall plot showing the best tumor response after a single injection of 84-EBET at 3 mg/kg. The average starting tumor volumes ranged between 75 and 140 mm3. Tumor volume changes from the baseline of 16 PDAC-PDX models are shown (n = 5 mice). c Binding affinity of #84.7 to PDAC cells in each model was quantitated by flow cytometry and plotted against tumor response (n = 5 mice). R-value and P-value calculated by using Pearson’s correlation (two-sided) are shown on the plot. MFI, mean fluorescence intensity. d Tumor growth curves in response to GEM and ADCs with 84-EBET in the orthotopic transplant of PC-3 model. Arrowheads indicate times of drug administration. Complete regression (100% reduction of Fluc signal) was defined as 0.01 in a log scale graph. Data are presented as means ± standard deviation (n = 5 mice). Representative luminescence images are shown in the bottom panels. e Tumor growth curves in response to GEM and ADCs with 84-EBET in liver metastasis in the PC-3 model. Arrowheads indicate times of drug administration. Complete regression (100% reduction of Fluc signal) was defined as 0.01 on a log-scale graph. Data are presented as means ± standard deviation (n = 6 mice). Representative luminescence images are shown in the bottom panels. ae Source data are provided as a Source data file.
Fig. 5
Fig. 5. 84-EBET modulates CAFs via the bystander effect.
a Immunohistochemical staining for BRD4, pSTAT3, pSMAD2, pSMAD3, collagen I, PDGFRα, and α-SMA in the PC-3 tumor 3 days after treatment with 84-EBET. Representative images are shown from 2 independent experiments with similar results. Scale bar, 100 μm. b Quantitation of BRD4, pSTAT3, pSMAD2, pSMAD3, and collagen I staining in the PC-3 and PC-42 tumors 3 days after drug treatment. The cancer cell area and stromal cell area were distinguished by nuclear shape using Indica Labs’ HALO system. The ratio of BRD4+ area to total area was calculated in cancer cell nuclei and in stromal cell nuclei. The ratio of pSTAT3+, pSMAD2+, pSMAD3+, and collagen I+ stromal area to total stromal area was calculated. Data are presented as means ± standard deviation (n = 5 mice). *P < 0.05, **P < 0.01, ***P < 0.001, ****P < 0.0001, one-way ANOVA test followed by Dunnett’s test between vehicle-treated group and drug-treated groups. c Quantitation of PDGFRα and α-SMA staining in the PC-3 and PC-42 tumors 3 and 7 days after drug treatment (n = 5). The ratio of PDGFRα+ and α-SMA+ stromal area to total stromal area was quantified. Data are presented as means ± standard deviation (n = 5 mice). *P < 0.05, **P < 0.01, ***P < 0.001, ****P < 0.0001, one-way ANOVA test followed by Dunnett’s test between vehicle-treated group and drug-treated groups. b, c Source data are provided as a Source data file.
Fig. 6
Fig. 6. 84-EBET has a combinational effect with standard chemotherapy and PD−1 antibody, without toxicity enhancement.
a Tumor growth curves and body weight curves in response to GEM + nanoparticle albumin-bound paclitaxel (nab-PTX), 84-EBET, and the combination of both in the PC-42 model. The average starting tumor volume was 80 mm3. Arrowheads indicate times of drug administration. Data are presented as means ± standard deviation (n = 5 mice). ****P < 0.0001, two-way ANOVA test followed by Fisher’s LSD test. b Tumor growth curves and body weight curves in response to PD-1-mAb, 84-EBET, and the combination of both in the Pan02/hCEACAM6 model. The average starting tumor volume was 80 mm3. Complete regression (100% reduction of tumor volume) was defined as 0.01 on a log-scale graph. Arrowheads indicate times of drug administration. Data are presented as means ± standard deviation (n = 5 mice). **P < 0.01, two-way ANOVA test followed by Fisher’s LSD test. c Quantitation of BRD4, PDGFRα, α-SMA, CD8, and granzyme B (GzmB) staining in the Pan02/hCEACAM6 tumors 3 and 7 days after drug treatment. The ratios of BRD4+, PDGFRα+, α-SMA+, CD8+, CD4+, and GzmB+ area to total tumor area were calculated by using Indigo Labs’ HALO system. Data are presented as means ± standard deviation (n = 15 mice). *P < 0.05, **P < 0.01, ***P < 0.001, ****P < 0.0001, one-way ANOVA test followed by Dunnett’s test between vehicle-treated group and drug-treated groups. Combo, combination of 84-EBET and PD-1-mAb. ac Source data are provided as a Source data file.

Similar articles

Cited by

References

    1. Viale PH. The American Cancer Society’s facts & figures: 2020 edition. J. Adv. Pr. Oncol. 2020;11:135–136. - PMC - PubMed
    1. Rahib L, et al. Projecting cancer incidence and deaths to 2030: the unexpected burden of thyroid, liver, and pancreas cancers in the United States. Cancer Res. 2014;74:2913–2921. doi: 10.1158/0008-5472.CAN-14-0155. - DOI - PubMed
    1. Rahib L, Wehner MR, Matrisian LM, Nead KT. Estimated projection of US cancer incidence and death to 2040. JAMA Netw. Open. 2021;4:e214708. doi: 10.1001/jamanetworkopen.2021.4708. - DOI - PMC - PubMed
    1. Beck A, Goetsch L, Dumontet C, Corvaïa N. Strategies and challenges for the next generation of antibody-drug conjugates. Nat. Rev. Drug Discov. 2017;16:315–337. doi: 10.1038/nrd.2016.268. - DOI - PubMed
    1. Staudacher AH, Brown MP. Antibody drug conjugates and bystander killing: is antigen-dependent internalisation required? Br. J. Cancer. 2017;117:1736–1742. doi: 10.1038/bjc.2017.367. - DOI - PMC - PubMed