

Population genetics of the critically endangered three-striped turtle, Batagur dhongoka, from the Ganga river system using mitochondrial DNA and microsatellite analysis
- PMID: 38467641
- PMCID: PMC10928089
- DOI: 10.1038/s41598-024-54816-0
Population genetics of the critically endangered three-striped turtle, Batagur dhongoka, from the Ganga river system using mitochondrial DNA and microsatellite analysis
Abstract
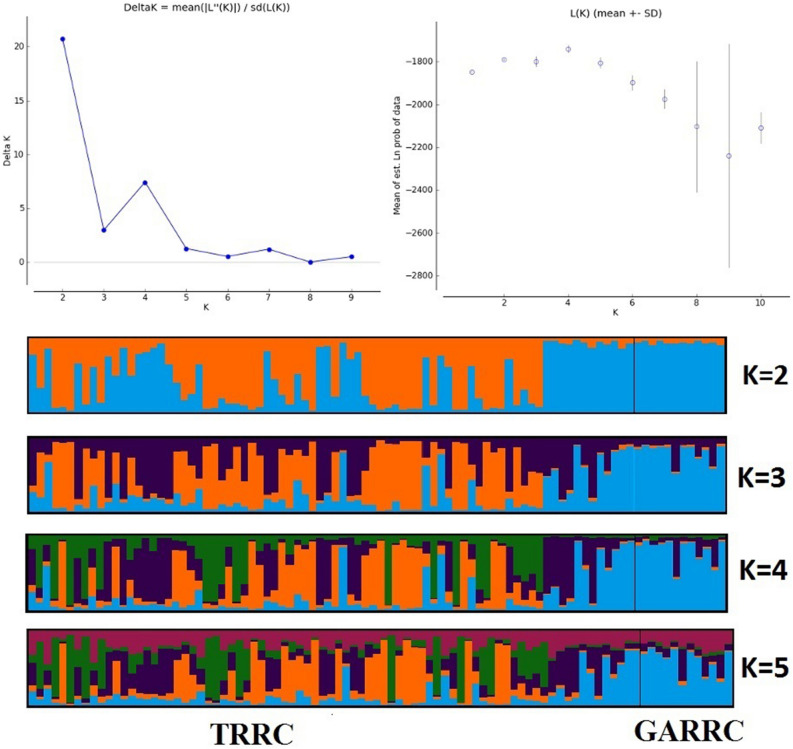
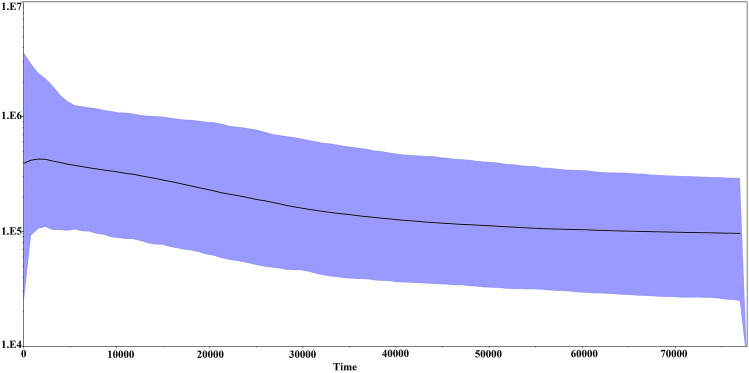
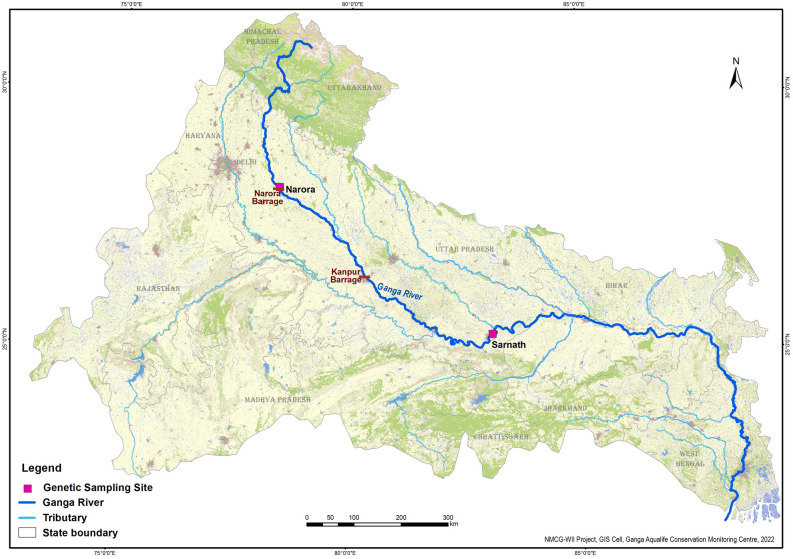
The three-striped roofed (Batagur dhongoka) is a semi-aquatic turtle that belongs to family Geoemydidae. Due to anthropogenic pressure, it has been facing an intense decline of over 80% in its distribution range in the past 50 years. It is considered as 'Critically Endangered' so effective conservation strategies are needed to protect the species by determining their genetic diversity and population genetic structure. This study investigates the genetic diversity, population structure and demographic pattern of B. dhongoka from two Turtle Rescue and Rehabilitation Centre established near Ganga river using mitochondrial cytochrome b (Cyt b: 1140 bp) ; control region (CR: 451 bp) and ten nuclear microsatellite loci. mtDNA results show low levels of nucleotide diversity (π = 0.0022) in B. dhongoka haplotypes and provide evidence for a low substitution rate. The demographic pattern estimated by the Bayesian skyline plot (BSP) analysis indicates historical stability followed by growth in the effective population size, with a recent reduction in population size from ~ 2 thousand years ago. The microsatellite findings show a moderate level of observed heterozygosity (Ho: 0.49). Bayesian-based clustering analysis revealed weak genetic structures in B. dhongoka and presence of admixed assignations suggesting close genetic relationships. These findings shed light on B. dhongoka's genetic status and underline the necessity of comprehensive rehabilitation and relocation programs and conservation and management techniques to ensure the species' long-term survival. In order to ensure the effective protection and conservation of B. dhongoka, the Government of India has taken a proactive measure by incorporating it into Schedule I of the Wildlife (Protection) Act, 1972, as amended in 2022.
Keywords: Genetic diversity; Heterozygosity; Microsatellite; Population structure; mtDNA.
© 2024. The Author(s).
Conflict of interest statement
The authors declare no competing interests.
Figures


Similar articles
-
Range-wide understanding of genetic diversity and population structure of endangered Kashmir musk deer in North-Western Himalaya.Mol Biol Rep. 2025 Jan 18;52(1):136. doi: 10.1007/s11033-025-10237-4. Mol Biol Rep. 2025. PMID: 39825993
-
Evaluation of the effect of longitudinal connectivity in population genetic structure of endangered golden mahseer, Tor putitora (Cyprinidae), in Himalayan rivers: Implications for its conservation.PLoS One. 2020 Jun 15;15(6):e0234377. doi: 10.1371/journal.pone.0234377. eCollection 2020. PLoS One. 2020. PMID: 32542044 Free PMC article.
-
Genetic structuring and recent demographic history of red pandas (Ailurus fulgens) inferred from microsatellite and mitochondrial DNA.Mol Ecol. 2011 Jul;20(13):2662-75. doi: 10.1111/j.1365-294X.2011.05126.x. Epub 2011 May 17. Mol Ecol. 2011. PMID: 21585580
-
Genetic diversity loss in a biodiversity hotspot: ancient DNA quantifies genetic decline and former connectivity in a critically endangered marsupial.Mol Ecol. 2015 Dec;24(23):5813-28. doi: 10.1111/mec.13430. Epub 2015 Nov 24. Mol Ecol. 2015. PMID: 26497007
-
Genetic diversity, spatial connectivity, and population structure of Asian silurid catfish Wallago attu (Bloch and Schneider, 1801) in the Ganga River System: insights from mitochondrial DNA analysis.Mol Biol Rep. 2024 Mar 1;51(1):378. doi: 10.1007/s11033-024-09323-w. Mol Biol Rep. 2024. PMID: 38427103
Cited by
-
Multi-dimensional scaling for space-time transformation to achieve sustainable planning and management of water resource under changing land use pattern.Sci Rep. 2025 Jan 7;15(1):1129. doi: 10.1038/s41598-024-82207-y. Sci Rep. 2025. PMID: 39774782 Free PMC article.
-
Genetic diversity of the Khorat snail-eating turtle (Malayemys khoratensis) in Thailand.PeerJ. 2024 Dec 9;12:e18699. doi: 10.7717/peerj.18699. eCollection 2024. PeerJ. 2024. PMID: 39670087 Free PMC article.
References
-
- Shaffer HB, FitzSimmons NN, Georges A, Rhodin AG. Turtle conservation genetics working group. Chelonian Res. Monogr. 2007;4:107–123.
-
- Das, I., Choudhury, B. C., Praschag, P., Ahmed, M. F. & Singh, S. Batagur dhongoka (errata version published in 2019). The IUCN Red List of Threatened Species 2019: e.T10953A152042542. 10.2305/IUCN.UK.2019-1.RLTS.T10953A152042542.en (2019).
-
- Praschag, P., Ahmed, M. F., Das, I. & Singh, S. Batagur kachuga (errata version published in 2019). The IUCN Red List of Threatened Species 2019: e.T10949A152043133. 10.2305/IUCN.UK.2019-1.RLTS.T10949A152043133.en (2019).
-
- Rashid SMA, Khan SMMH. Trade and conservation status of freshwater turtles and tortoises in Bangladesh. In: van Dijk PP, Stuart BL, Rhodin AGJ, editors. Asian Turtle Trade: Proceedings of a Workshop on Conservation and Trade of Freshwater Turtles and Tortoises in Asia. Chelonian Research Monographs. Chelonian Research Foundation: Lunenburg; 2000. pp. 77–85.
MeSH terms
Substances
LinkOut - more resources
Full Text Sources
Research Materials
Miscellaneous
